Back to Journals » Drug Design, Development and Therapy » Volume 19
Enhancing Quercetin’s Potential: A Nanoliposome Delivery System for High Altitude Pulmonary Edema
Authors Lin L ![]() , Shen B, Cui J, Gao Y, Wang L
, Shen B, Cui J, Gao Y, Wang L ![]() , Yang T, Weng J, Lai C, Tang X, Xiao C, Shen X, Gao Y
, Yang T, Weng J, Lai C, Tang X, Xiao C, Shen X, Gao Y ![]()
Received 16 June 2025
Accepted for publication 30 September 2025
Published 8 October 2025 Volume 2025:19 Pages 9151—9167
DOI https://doi.org/10.2147/DDDT.S509270
Checked for plagiarism Yes
Review by Single anonymous peer review
Peer reviewer comments 2
Editor who approved publication: Dr Tuo Deng
Lin Lin,1,2 Baoying Shen,1,2 Jialu Cui,1,2 Yehui Gao,1,2 Libin Wang,3 Tingyu Yang,1,2 Jiading Weng,2,4 Chengcai Lai,2 Xianglin Tang,2 Chengrong Xiao,2 Xin Shen,2 Yue Gao1,2,5
1Institute of Traditional Chinese Medicine, Tianjin University of Traditional Chinese Medicine, Tianjin, People’s Republic of China; 2Beijing Institute of Radiation Medicine, Beijing, People’s Republic of China; 3School of Medicine, Shaanxi Energy Institute, Xianyang, Shaanxi, People’s Republic of China; 4School of Pharmacy, Guangdong Pharmaceutical University, Guangzhou, People’s Republic of China; 5State Key Laboratory of Kidney Diseases, Chinese PLA General Hospital, Beijing, People’s Republic of China
Correspondence: Xin Shen, Beijing Institute of Radiation Medicine, No. 27 Taiping Road, Haidian District, Beijing, 100850, People’s Republic of China, Tel +86010-66931233, Email [email protected] Yue Gao, Beijing Institute of Radiation Medicine, No. 27 Taiping Road, Haidian District, Beijing, 100850, People’s Republic of China, Tel +86010-66931312, Email [email protected]
Purpose: This study aimed to develop quercetin-loaded nanoliposomes (QUL) to improve the oral bioavailability of quercetin (QU). Furthermore, we comprehensively evaluated the potential of QU for preventing high-altitude pulmonary edema (HAPE) and explored its underlying molecular mechanisms.
Methods: Quercetin nanoliposome was created using thin-film hydration method, which was analyzed for morphology, zeta potential, drug loading, encapsulation efficiency, and release in vitro. A simple, sensitive and accurate LC MS/MS method was developed and validated for the simultaneous quantification of QU and QUL in rat plasma using Carbamazepine as internal standard (IS). The efficacy of QU and QUL in preventing HAPE was demonstrated in vitro and in vivo. Various techniques such as Western blotting, and immunofluorescence were employed to elucidate the associated mechanism.
Results: Transmission electron microscopy proved that the nanoparticles were evenly distributed. The mean particle size (DLS) was determined to be 157.08± 1.215 nm, with a polydispersity index (PDI) of 0.204± 0.012. After oral administration of QU and QUL, Tmax values were 2.677± 1.033h and 1.167± 0.408h, respectively. Additionally, the Cmax values were 0.37± 0.049ug/mL and 0.585± 0.032ug/mL, respectively, suggesting a faster absorption rate and greater absorption content for QUL. QU and QUL improved lung permeability, reduced mortality, and decreased lung water content in a mouse model. Moreover, they significantly inhibited hypoxia-induced hyperproliferation and migration of pulmonary arterial smooth muscle cells (PASMCs). Mechanistic studies indicated that these effects were mediated through the PI3K/AKT/VEGF and ROCK/HIF/TRPC signaling pathways.
Conclusion: QU reduces lung water content by modulating the PI3K/AKT/VEGF and ROCK/HIF/TRPC signaling pathways, suggesting its potential for preventing and treating HAPE. Furthermore, quercetin-loaded lipid nanoparticles improve oral bioavailability, thereby enhancing the therapeutic efficacy of quercetin in HAPE management.
Keywords: quercetin, nanoliposome, pharmacokinetic, high altitude pulmonary edema, pulmonary artery smooth muscle cells
Graphical Abstract:

Introduction
When entering the plateau environment above 2500m altitude, the partial pressure of oxygen decreases and enters a state of hypoxia, causing the body to undergo pathological changes. HAPE is a non-cardiogenic form of pulmonary edema characterized by significant morbidity, rapid progression, and high lethality. It poses a serious threat to the health and lives of individuals who rapidly ascend to high altitudes. Without timely treatment, patients may quickly deteriorate to respiratory failure and even death, severely limiting the operational capacity of personnel in high altitude environments.1 The pathophysiology of HAPE is primarily attributed to several etiological factors like the hypoxia-induced elevation of pulmonary vascular resistance (PVR), hypoxic pulmonary vasoconstriction (HPV), and increased pulmonary vascular pressure, ultimately resulting in elevated lung permeability and pulmonary edema.2 However, current drug treatments of HAPE have limitations and certain adverse reactions. Chinese medicinal herbs and natural products possess the unique characteristic of “one-drug-multi-targets-multi-pathways”, making them advantageous for the discovery and development of effective drugs for the prevention and treatment of HAPE within Chinese traditional medicine.
QU is a natural polyphenolic flavonoid believed to have widespread health benefits and the most ubiquitous flavonoid in fruits, vegetables, and medicinal plants.3 Research has indicated that QU exhibits a diverse range of biological properties, including antioxidant, anti-aging, antiviral, anticancer, antibacterial, and anti-inflammatory effects4 QU has been demonstrated to inhibit pulmonary artery contraction and alleviate hypoxia-induced pulmonary hypertension as well as LPS-induced pulmonary edema.5 However, its efficacy in preventing and treating HAPE remains unknown. This study aims to evaluate the potential of QU in the prevention and treatment of HAPE.
PASMCs are significant contributors to the pathogenesis of abnormal proliferation and narrowing or occlusion of the pulmonary vasculature through their phenotypic transition from contractile to synthetic and proliferative states, subsequently resulting in increased pulmonary vascular pressure and HAPE.6,7 Researchers found that the expression of transient receptor potential cation channels (TRPCs) was significantly increased in the pulmonary artery smooth muscle of hypoxic rats, thereby promoting calcium influx. Rho-associated coiled-coil containing protein kinase (ROCK), as a key upstream regulator of TRPCs, plays an essential activating role in this process. Under hypoxic conditions, the upregulation of this ROCK-TRPC signaling axis contributes to pulmonary vascular remodeling and increased endothelial permeability, thereby participating in the initiation and progression of HAPE.8,9 QU demonstrates promising therapeutic efficacy in the treatment of high-altitude pulmonary disorders. The limited solubility, permeability, half-life, and poor oral bioavailability of QU restrict its broad application.10 In our article, we tried to improve the physicochemical properties of QU by fabricating QU nanoliposomes. Furthermore, we comprehensive investigated the preventive and therapeutic functions of QU in HAPE mice and its underlying molecular mechanisms, in order to offer novel insights into the utilization of natural products for the treatment and prevention of HAPE.
Materials and Methods
Cell and Reagents
PASMCs were purchased from BeNa Culture Collection (BNCC, Beijing, China; cell number: BNCC359367). After examination, the morphology of the cells was normal. QU (Rhon Reagent, Lot No. RH356579). Nifedipine (NiF) (Rhon Reagent, Lot No. RH310323). Dexamethasone (Dex) (Rhon Reagent, Lot No. RH278007 98% content). lipopolysaccharide (LPS) (Solarbio, Lot No. L8880). Antibody: Rho-associated protein kinase (ROCK) (GR32307386,abcam), TRPC1 (Rb3173-150218-WS,Nouvs), TRPC6 (#MKCF5774, Nouvs), hypoxia-inducible factor 1-α (HIF-1α) (L07JL01, zenbio), hexokinase2 (HK2,00134547, proteintech), 6-phosphofructo-2-kinase/fructose-2,6-bisphosphatase 3 (PFKFB3,00131360, proteintech), pyruvate kinase M2 (PKM2,00132394, proteintech), lactate dehydrogenase A (LDHA,00131132, proteintech), Glucose transporter 4 (GLUT4,10016192, proteintech), phosphoinositide 3-kinase (PI3K) (00127889, proteintech), P-AKT (10028150, proteintech), vascular endothelial growth factor (VEGF) (00110516, proteintech), angiopoietin2 (Ang2,00026300, Proteintech), Tie2 (00071719, Proteintech), β-actin (1:5000, L21JU85, zenbio).
Animals
Male KM mice weighing 20–25 g and Male Sprague Dawley (SD) rats weighing 200–220 g. Certificate: were obtained from Beijing Viton Lihua Lab Animal Technology Co, kept in a controlled environment, and fed with standard rodent chow and water. Experimental animal license number: SCXK (Beijing) 2021–0011. All animal studies are conducted in accordance with the regulations of the Animal Ethics Committee of the Academy of Military Medical Sciences (approval number: IACUC-DWZX-2022-612). Animal welfare and operation procedures strictly follow the Chinese guidelines for animal protection and welfare. KM mice were randomly assigned to a different group: Normal control group (Nor), hypoxia-complex LPS group (Mod), QU group: (L, M, H, 25/50/100mg/kg), QUL low-dose group (QUL-L,25mg/kg), QUL high-dose group (QUL-H, 100mg/kg), NiF (3.9mg/kg) and Dex (1.04 mg/kg). From 7 days before modeling until the day of modeling, the mice were administered daily via oral gavage. Thirty minutes prior to hypoxia exposure, LPS (3 mg/kg) was injected intraperitoneally. Subsequently, the mice were placed in a hypoxia chamber with an oxygen concentration of 10% for 24 hours. Ensure that the number of animals per group is no less than six after successful model establishment. Observe and record mouse mortality. Weighing at the end of hypoxia.
Determination of Lung Water Content
Mice were killed 24h after LPS and hypoxia challenge, and the lungs after removal of excess blood were weighed. Then, they were placed in an oven at 60°C for 48h and weigh dry. Calculate the lung dry to wet ratio.
Lung water content (%) = (wet weight - dry weight)/wet weight) × 100%.
Lung wet-dry ratio (W/D) = wet weight/dry weight.
Biochemical Detection
Blood samples were centrifuged to obtain serum, and the concentrations of alkaline phosphatase (ALP), albumin (ALB), lactate dehydrogenase (LDH), and total protein (TP) were measured using a biochemical analyzer (Roche, Cobas C 311).
Blood Cell Count Test
The chest cavity was opened, and the lungs were lavaged with 1mL of sterile saline (0.9% w/ v) to obtain broncho alveolar lavage fluid (BALF). BALF was centrifuged at 4°C and the cell residue after centrifugation was suspended in 100μL saline for quantitative inflammatory cell counting.
Preparation of QUL
QU (10mg), DSPE-PEG2000 (100mg), soy lecithin (100mg) and cholesterol (20mg) were dissolved in a beaker of 10mL of chloroform. The organic solvents were removed by rotary evaporation under reduced pressure at 30°C in a 250mL rotary evaporator flask. A yellowish film precipitated from the bottom wall of the vial. The membrane was dissolved in deionized water, and then processed through a liposome extruder (polycarbonate membrane with a pore size of 30nm). Then it was dialyzed by a nano-dialysis device (polycarbonate membrane, pore size 10nm) to remove the unloaded DSPE-PEG2000 and QU, and deionized water was added to obtain an aqueous solution of QUL.
Characterization of QUL
Uniform Distribution
QUL solution was taken in a 50mL centrifuge tube and irradiated with a laser pointer to observe the presence of Tyndall effect. QUL was stained with phosphotungstic acid (2%), and the morphology was visualized by transmission electron microscopy (Tecnia-12). The DLS, zeta potential, and PDI were measured by a nanoparticle size analyzer (Brookhaven, USA, NanoBrook90plusPALS) at room temperature. The liposomes we constructed had high stability and repeatability.
In Vitro Release
In vitro release of QUL was measured by the dialysis membrane method. The QUL solution was added to phosphate buffer solution (PBS) containing 0.5% polysorbate 80 and released by dialysis at 37°C and 100 r/min. QU concentrations were determined at 2h, 4h, 6h, 8h, 1d, 5d, 10d, 15d and 20d by UV-visible spectrophotometry.
DL% and EF%
Ethanol was added to the QUL solution and vortexed to disrupt the structure of the nanoliposomes and release the encapsulated QU. The concentration of QU in the solution at this point in time was determined by UV spectrophotometry, and the total mass of QU was calculated. The lyophilized liposome nanosuspension without lyophilization protectant was lyophilized and weighed to obtain the total weight of the nanosuspension. The aqueous QUL solution was centrifuged, the supernatant and precipitate were separated and diluted separately, and then the absorbance values of the solution were measured by ultraviolet spectrophotometry (UV-2550).
DL%=QM/QP×100%
EF%=QW/QM100%
Where QM is the mass of QU in the nanoliposomes QP is the total mass of the nanoliposomes and QW is total quercetin minus quercetin in the supernatant.
Stability
Different concentrations of PH solution (PH=5, 6, 7) were added to the QUL solution. The DLS, PDI were measured at 4°C and 27°C protected from light for 1d, 5d, 10d, 15d and 20d.
Samples Preparation
The 12 rats fasted for 12 hours before oral administration but were allowed to drink water freely. The rats were then given QU (34mg/kg) and QUL (containing QU 34mg/kg). The blood samples were collected in tubes containing sodium heparin at 1,5,15,30,45min, and at 1, 2, 4, 6, 8, 12, 24h after dosing. A 100μL plasma sample was spiked with 10μL IS solution. The mixture was vortexed followed by the addition of 50μL HCl (4mol/L) at 80°C for 30min. 1000μL ethyl acetate was added, and the mixture was vortexed 10min. Following thorough mixing, the sample was subjected to centrifugation to extract the supernatant, which was subsequently dried under a nitrogen stream. The residue was reconstituted by adding 100μL methanol and the supernatant was taken into the injection bottle.
LC-MS/MS Conditions
Chromatographic conditions were as follows: The chromatographic column was Shiseido Capcell PAK C18 MG III (100mm×2.1mm, 5μm); the mobile phase was (A)-0.1% formic acid aqueous solution (B) methanol with gradient elution, and the elution program was as follows: 0~2min, 55% A; 2~5min, 55%→90% A; 5~9min, 90% A; 9~10min, 90%→55% A; 10~12min, 55% A. Column flow rates were set at 0.2mL/min, column temperatures of 25°C, and injection volumes of 2μL; analysis time 12min. Multiple reaction monitoring (MRM) mode; electrospray ionization (ESI); positive ion detection mode (Table 1).
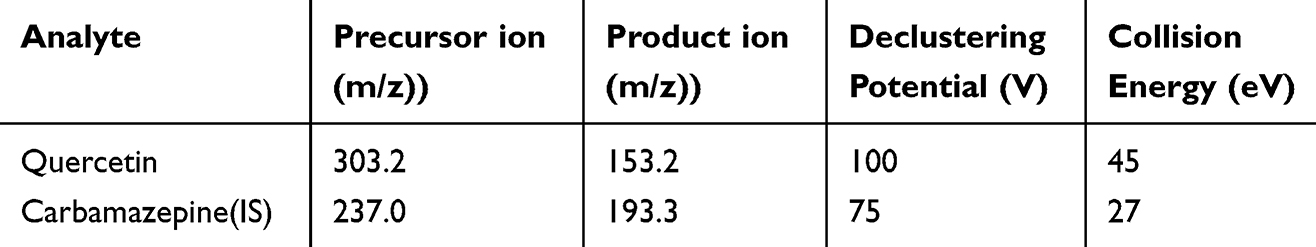 |
Table 1 The Mass Spectrometry Conditions of Quercetin and IS |
Method Validation
The method validation procedure was conducted according to the guiding principles of the US FDA and EMA.
Selectivity and Specificity
Chromatograms of blank plasma and plasma-added analytes were utilized to exclude endogenous substance interference, and the selectivity of this method was evaluated by the retention time of the analytes. Blank plasma samples were analyzed in comparison to pharmacokinetic samples and plasma spiked analytes to assess specificity.
Linearity and Lower Limit of Quantification
A series of plasma samples with QU concentrations of 0.01, 0.025, 0.05, 0.1, 0.25, 0.5, 1, 2.5, and 5μg/mL, respectively. Add 10µL of IS solution separately, mix well, then measure and analyze. The regression equation calculation produced standard curves. Determine the lowest concentration of LLOQ for the calibration curve.
Precision and Accuracy
Accuracy and precision were evaluated separately for six replicates of four QC samples (LLOQ, low, medium, and high) on one day (intraday) and different batches on three consecutive days (interday).
Recovery and Matrix Effect
Recoveries were calculated by comparing the peak areas of the QC samples with those of blank plasma added at different concentrations. The matrix effect was calculated by the ratio of the peak area after extraction of blank plasma to the clean standard solution at three different concentration levels.
Stability
The samples were stored room temperature for 12h, at a temperature of minus 80°C for 30d and were repeated freeze-thaw and placed in the injector for 12h before being analyzed.
Network Pharmacology Research
QU potential bioactive ingredients were analyzed with the Traditional Chinese Medicine Systems Pharmacology Database and Analysis Platform (TCMSP). The keywords “hypoxia, HAPE” was used to obtain the relevant targets in DRUGBANK, Therapeutic Target Database (TTD), DisGeNET databases. Utilizing the Venn online analysis site to obtain common targets of quercetin’s action with HAPE. By using Cytoscape, a protein interaction network diagram was constructed with the STRING database. The DAVID website conducted GO and KEGG enrichment analysis.
Cell Culture
PASMCs were cultured at 37°C in 95% O2 and 5% CO2, until fusion was reached for passaging with trypsin. Cells were divided into two groups, which received different treatments: (1) Normal group: treated with QU ((3000, 1000, 300, 100, 30, 10, 3 and 1μmol/L)) under normal culture conditions (95% O2 and 5% CO2); (2) Hypoxic group: simulated hypoxic conditions (1% O2 and 5% CO2) with QU (30μmol/L) treatment.
CCK-8 and EdU Staining
PASMC proliferation was assessed with cell counting kit-8 (CCK-8) and EdU incorporation assay. In 96-well plates, 2 × 10⁴cells were seeded per well. After 24h, CCK-8 reagent (1:10) was added into each well and treated for 2h, and the absorbance was recorded at 450nm by using a Live Cell Imager (gilent, BioTek). In the EdU assay, cells were labeled with EdU for 3h and imaged by inverted fluorescence microscope to observe the EdU-positive cells and calculated by Image J software.
Cell Migration Assay
PASMCs migration was assessed using a wound healing assay. Cells were seeded in 24-well plates at a density of 7 × 10⁴ per well. Upon reaching 90% confluence, a uniform wound was created in each well using an AUT SCRATCH instrument. Following hypoxia treatment, images were captured using a live-cell imaging system.
Ca2+ Concentration Assay
After 24h of cell hypoxia, we washed the cells with HANKS buffer, a HOECHST 33342 (5μmol/L) dye was used for counterstaining of the nuclei and Flou-4 (1μmol/L) was used to measure induced calcium mobilization before incubating them for 10 minutes at 37°C. Discard the staining solution and add 100μL of HANKS buffer to each well. Images were captured using a high-content screener (Opera Phenix, PerkinElmer).
Immunofluorescence
The cell was fixed with 4% paraformaldehyde, permeablized with 0.25% Triton X-100, and blocked with 2% bovine serum albumin (BSA) using a three-step procedure. Cells were then incubated with primary antibodies (TRPC6, HIF-1α), secondary antibodies, and DAPI. Immunofluorescence staining results were recorded using a live cell imager.
Energy Metabolism Analysis
An Agilent glycolytic stress test kit was used on a Seahorse XFp (Agilent Technologies, Santa Clara, USA) Analyzer to determine the extracellular acidification rate. We seeded cells into 96-well plates (2 × 10⁴ cells per well). After 24h, glycolytic stress test was performed with glucose (final concentration 10mM), oligomycin (final concentration 1.0µM) and 2-DG (final concentration 50mM).
Western Blotting
Total protein was extracted from PASMCs and lung tissues. Proteins were separated with SDS-PAGE electrophoresis and transferred to polyvinylidene difluoride (PVDF) membranes. Membranes were probed with the following antibodies against: ROCK1+2 (1:2000), TRPC1 (1:1000),TRPC6 (1:1000), HIF-1α (1:1000), HK2 (1:5000), PFKFB3 (1:1000), PKM2 (1:1000), LDHA (1:2000), GLUT4 (1:1000), PI3K (1:1000), P-AKT (1:2000), VEGFA (1:1000), Ang2 (1:1000), Tie2 (1:1000), β-actin (1:5000), incubate overnight at 4 degrees. Incubation with the secondary antibody antimouse IgG, antirabbit IgG (1:5000), was performed for 1h at room. Using ImageJ software, post-image analysis was performed.
Statistical Analysis
All experimental data are expressed as the mean ± standard deviation, Images were counted using ImageJ software. Pharmacokinetic parameters were calculated using DAS. One-way ANOVA was used for multi-group comparisons. Differences between two groups were considered to be statistically significant at P≤0.05.
Results
QU Resolved Symptoms of HAPE Induced by LPS and Hypoxia
A mouse model of HAPE was successfully established by intraperitoneal injection of LPS combined with hypoxia exposure. Compared with the Nor group, the Mod group showed significant body weight loss, whereas QU treatment markedly attenuated this weight reduction (Figure 1A). Regarding pulmonary edema indicators, both lung water content and lung W/D ratio were significantly higher in the Mod group than in the Nor group. In contrast, QU administration significantly reduced these parameters, suggesting that QU effectively alleviated pulmonary edema in the HAPE model (Figure 1B). Serum biochemical analysis revealed that the QU group exhibited a significant decrease in LDH level, along with significant increases in ALP, ALB, and TP levels (Figure 1C). As shown in Figure 1D, the cell count in BALF was significantly elevated in the Mod group, which was reversed by QU treatment, indicating that QU improved abnormal pulmonary vascular permeability induced by HAPE. QU significantly ameliorates LPS and hypoxia-induced HAPE symptoms by reducing pulmonary edema and vascular leakage.
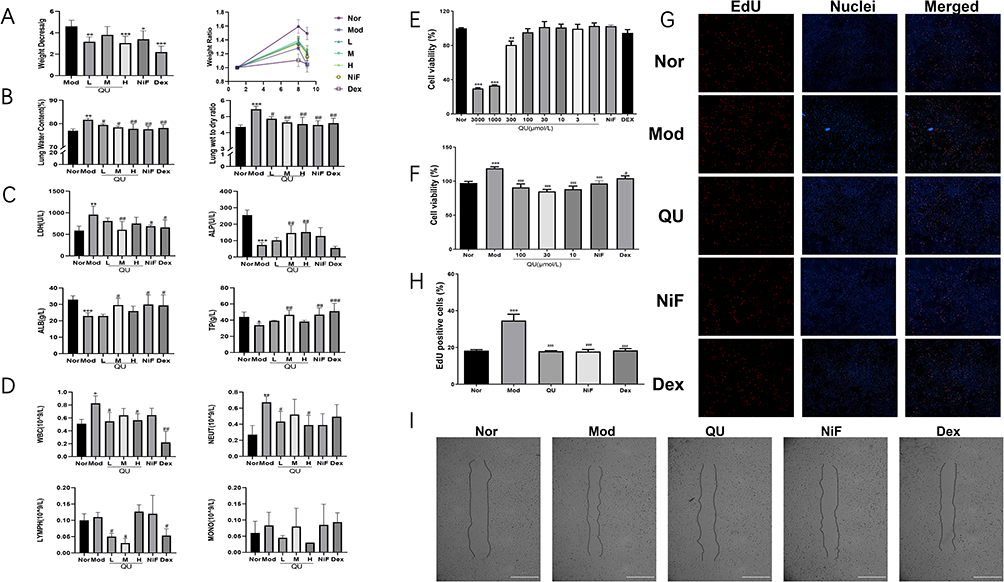 |
Figure 1 QU reduces lung water content and improves lung permeability in LPS-induced HAPE mice. It also inhibited the hyperproliferation and migration of PASMC under hypoxia. (A) Changes in body weight of mice after administration; (B) Lung water content and lung W/D in mice after drug administration; (C) Changes of LDH, ALB, ALP and TP levels in mice serum; (D) Changes of the number of WBCs, NEUTs, LYMPHs and MONOs in BALF; (E) Effect of QU on the viability of PASMCs at normoxia conditions; (F) Effect of QU on the proliferation of PASMCs at hypoxia conditions; (G) EdU staining results; (H) Quantification of EdU-positive cells; (I) Effect of QU on PASMCs migration at 1% oxygen concentration. *P<0.05, **P<0.01, ***P<0.001 compared with Nor group; #P<0.05, ##P<0.01, ###P<0.001 compared with Mod group, The experiment was conducted independently (n=6). |
QU Inhibited Hypoxia-Induced Proliferation and Migration in PASMCs
The CCK-8 assay indicated that QU (1–100 μmol/L) did not affect the viability of PASMCs under normoxic conditions within 24 h (Figure 1E). Under hypoxic conditions, however, QU at concentrations of 30–100 μmol/L significantly suppressed hypoxia-induced PASMCs proliferation compared to the Model group (Figure 1F). Based on its optimal anti-proliferative effect, 30 μmol/L QU was selected for subsequent experiments. To further evaluate the effect of QU on the proliferation of hypoxic PASMCs, an EdU immunofluorescence assay was performed. As shown in Figure 1G and H, the hypoxia group exhibited a significant increase in EdU expression, indicating that hypoxia promoted DNA synthesis in PASMCs. However, after treatment with QU, the red fluorescence intensity was markedly reduced. These results demonstrate that quercetin inhibited hypoxia-induced proliferation and induced apoptosis in PASMCs. Furthermore, wound healing assays demonstrated that hypoxia markedly promoted PASMCs migration compared to the Nor group, an effect that was significantly reversed by QU treatment (Figure 1I). QU effectively inhibits both proliferation and migration of PASMCs under hypoxic conditions.
Preparation and Characterization of QUL
Quercetin nanoliposome was successfully created using thin-film hydration method and extrusion through polycarbonate membrane filters. A laser pointer was directed at the sample, and the QUL exhibited a strong Tyndall effect and displayed liposome-like nanostructures (Figure 2A). As shown in Figure 2B, the drug-loaded liposomes were uniformly dispersed and spherical under transmission electron microscopy. The DLS measurement of QUL was 157.08±1.215nm and the PDI was 0.204±0.012. The average zeta potential was −38.12±0.071mV, suggesting that the QUL were stably dispersed in the medium (STable 1). The EE% and DL% of QUL were 98.96% and 10.12%, respectively. The release of QU from liposomes was studied by dialysis. As depicted in Figure 2C, QUL demonstrated a rapid release and consistently maintained a high release rate. To investigate the effect of solution pH on the stability of QUL, three pH treatment gradients (5.0, 6.0, and 7.0) were established to detect the changes in DLS and PDI at room temperature for 1d, 5d, 10d, 15d, and 20d, respectively. As shown in Figure 2D, QUL showed a significant increase in the DLS of liposome particles over time at pH levels below 7. It is speculated that phospholipid membrane rearrangement and liposome aggregation may have occurred. The PDI value of QUL exhibited minimal variation at pH 7, whereas a notable increase was observed at pH 5. This indicated the uniformity of particle size distribution of the liposomes was decreased with declining PH, raising the possibility of liposome aggregation. The effect of different temperatures on the stability of QUL was explored in pH 7 solution. As illustrated in Figure 2E, the DLS of QUL exhibited a gradual increase over time at 27°C, while remaining stable at 4°C. This observation suggested that the nanoliposome aggregation might have occurred at the elevated temperature. After 20 days, the PDI of QUL remained essentially unchanged at both 4°C and 27°C, indicating that the uniformity of the particle size distribution of liposomes was predominantly affected by the solution pH rather than the temperature. Notably, the PDI values were lower in the 4°C environment compared to those at 27°C, signifying a more uniform particle size distribution of the liposomes at 4°C. In summary, QUL demonstrated long-term stability at 4°C and a solution pH of 7.
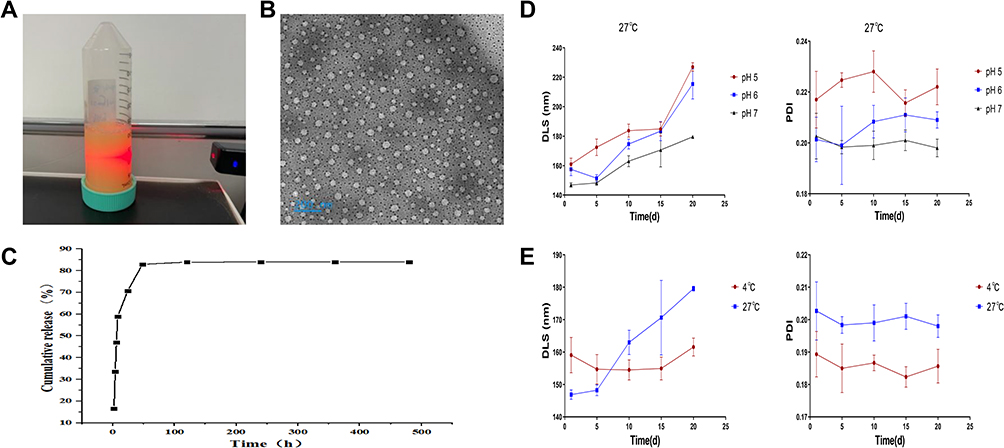 |
Figure 2 Preparation, characterization evaluation and stability studies of QUL. (A) Tyndall phenomenon in aqueous solutions of QUL; (B) Transmission electron micrograph of QUL; (C) In vitro release profile of QUL; (D) Changes in average DLS and PDI of QUL aqueous solutions at different pH conditions; (E) Changes in average DLS and PDI of QUL aqueous solutions under different temperature conditions. The experiment was repeated independently six times. |
Pharmacokinetic Studies of QUL
The product ion mass spectra of [M+H] + of quercetin and IS were presented in Figure 3A and B.
 |
Figure 3 Establishment of LC-MS/MS method for the determination of quercetin in plasma and mean plasma concentration-time curves of quercetin in rats following intragastric administration of QU and QUL. (A) The MS Scan spectra of quercetin and IS; (B) Product ion spectra of [M+H]+ of quercetin and IS; (C) Blank plasma; (D) Blank plasma spiked with quercetin (5.00μg/mL) and IS (10μg/mL); (E) Chromatogram of plasma samples of rats after QU administration for 15min. 1: quercetin; 2: IS; (F) Mean plasma concentration–time of quercetin in rats following intragastric administration of QU and QUL. The experiment was repeated independently (n=6). |
Method Validation: Selectivity
Representative chromatograms of blank plasma, plasma samples spiked with quercetin and IS (carbamazepine), and pharmacokinetic samples from SD rats after 15min of oral QU are shown in Figure 3C–E. The retention times of quercetin and IS were 6.38min and 6.34min, respectively. It showed that the endogenous substances in rat blank plasma do not interfere with the determination of the analytes and the IS. This LC-MS/MS method was selective and specific.
Linearity and Lower Limit of Quantification
Sensitivity was evaluated by determining the lower limit of quantification (LLOQ), which was required to meet specific acceptance criteria: both accuracy and precision had to be within ≤20%, and a signal-to-noise ratio of at least 10. The calibration curves, constructed in plasma, exhibited good linearity over the range of 0.01–5 μg/mL. The corresponding equation was y = 0.00888x + 0.0000449, with an r² value of 0.9927, demonstrating excellent fit. Based on these validation results, the LLOQ was established at 0.01 μg/mL (Table 2).
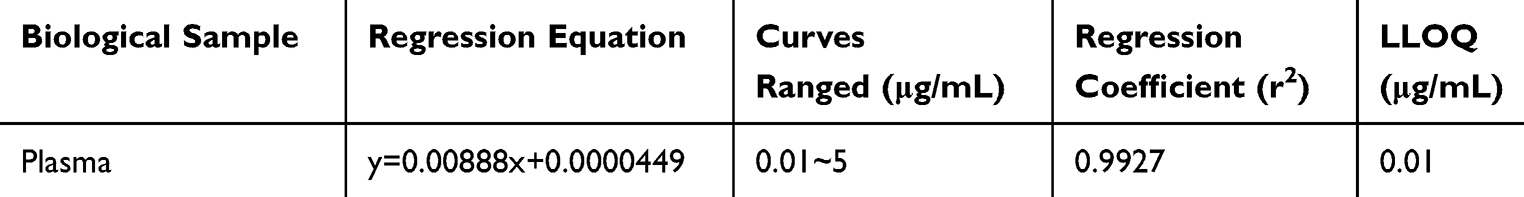 |
Table 2 Standard Curve of Quercetin in Rat Plasma Samples |
Precision and Accuracy
The precision and accuracy of the method were assessed in rat plasma by performing replicate analyses of QC samples (LLOQ, low, middle and high). The RSD% and RE% of intra-day and ir-day were less than 15%, within the acceptable criteria for bioanalytical purposes (STable 2).
Recovery and Matrix Effect
The extraction recoveries of quercetin at low, medium and high concentrations were in the range over 94.87% ~99.55% in plasma, and the results were found to be reproducible, consistent and concentration independent (STable 3). The matrix effect of the various concentrations of quercetin in rat plasma ranged from 93.76% to 95.53%, indicating no latent co-eluting endogenous substance interfered with the ionization of analytes, shown in Stable 4.
Stability
Four different conditions were used to analyze the stability of QC samples. The accuracy of each assay result at low, medium and high concentrations was less than 15%, which indicated that no significant degradation of any analyte occurred in rat plasma and the stability of the method was good (Stable 5).
Pharmacokinetics Comparison
The method was applied to study the quantification of quercetin in rat plasma after full validation. Figure 3F shows the mean plasma concentration-time profiles quercetin in plasma of rats after a single oral administration of the same dose of QU and QUL. QUL could increase the concentration of the quercetin in vivo and increase the area under the curve (AUC) with significant differences. The changes in the key pharmacokinetic parameters in QU and QUL rats are shown in Table 3. Compared with QU group rats, the peak plasma concentration (Cmax), half-life (T1/2), AUC, and mean residence time (MRT) of quercetin in QUL group rats were increased, while the time to reach Cmax (Tmax), clearance (CLz/F), and volume of distribution (Vz/F) were decreased. The results showed that the content of quercetin in QUL group rats was larger than in QU rats and the absorption rate was faster. The plasma concentration of quercetin decreased slowly after oral administration of QUL and the CLz/F was declined, leading to the prolongation of the overall elimination time and T1/2. Compared with the QU, the QUL demonstrated faster absorption, an extended half-life, increased plasma concentration, and a significantly larger area under the curve. These results indicate that the nano-formulation approach effectively enhanced the oral bioavailability of QU. However, the Vz/F was decreased in QUL group rats, indicating that the distribution of quercetin was reduced. We speculate that QUL might be concentrated in typical tissues and organs, which might be associated with target organs for treated disease or blood flow of tissues. Based on current in vivo experiments, the conclusions we have obtained still require further tissue distribution analysis and in vitro experiments for confirmation.
 |
Table 3 Pharmacokinetic Parameters After a Single Oral Dose of QU and QUL in Rats |
QUL Relieved Symptoms of HAPE Induced by LPS and Hypoxia
Mortality was significantly higher in the Mod group than in the Nor group after 24 hours of hypoxic and low-pressure exposure. In contrast, all drug-treated groups showed a notable reduction in mortality. Among them, QUL conferred a significantly superior protective effect over QU (100 mg/kg) (Figure 4A, Stable 6). Body weight was monitored throughout the study. As shown in Figure 4B, the Mod group exhibited a significant decrease in body weight, whereas the QUL-L, QUL-H, and QU groups showed a slower rate of weight loss, indicating that both QU and QUL alleviated weight reduction in HAPE mice. Measurement of lung water content revealed values of 78.17 ± 0.74%, 78.14 ± 0.52%, and 78.52 ± 0.70% for the QUL-L, QUL-H, and QU groups, respectively (Figure 4C). All treatment groups showed a significant reduction compared to the Mod group. Notably, the QUL group exhibited a lower lung water content than the QU group. This indicated that QUL provided superior protective effects against pulmonary edema at an equivalent dosage. Biochemical analyses showed that LDH levels were significantly decreased in all treatment groups compared to the Mod group, while ALP, ALB, and TP levels were significantly increased. These findings suggested that both QU and QUL ameliorated lung vascular permeability in HAPE mice (Figure 4D). In summary, both QU and QUL alleviated HAPE symptoms induced by LPS and hypoxia. Moreover, at an equivalent dosage, QUL demonstrated a significantly superior protective effect compared to QU.
 |
Figure 4 QUL relieved symptoms of HAPE. (A) Survival curves in mice after drug administration; (B) Changes in body weight of mice after administration; (C) Lung water content and lung W/D ratio in mice after drug administration; (D) Changes of serum biochemical indexes LDH, ALB, ALP and TP in mice after drug administration. *P<0.05, ***P<0.001 compared with Nor group; #P<0.05, ##P<0.01, ###P<0.001, compared with Mod group, the experiment was conducted independently (n=6). |
Investigating the Signaling Pathways Linked to the Anti-HAPE Properties of QU
Through network pharmacology analysis, we investigated the signaling pathways linked to the anti- HAPE properties of QU and revealed 148 live targets associated with QU and 1363 disease targets. As shown in Figure 5A, a total of 68 overlapping drug and disease targets were identified from the intersection of these targets. Utilizing the STRING protein interaction online database, the network of interacting proteins was analyzed, resulting in a network comprising 54 nodes and 230 edges (Figure 5B). The results of the Gene Ontology (GO) analysis revealed the top 10 enriched pathways for biological processes (BP), cellular components (CC), and molecular functions (MF), as depicted in Figure 5C. These pathways encompassed functions such as angiogenesis, oxidative stress response, and ATP binding. In addition, the Kyoto Encyclopedia of Genes and Genomes (KEGG)enrichment analysis indicated that the relevant pathways primarily involved in VEGF signaling pathway and PI3K-AKT signaling pathway (Figure 5D). The enrichment of these pathways is closely associated with the pathogenesis of HAPE.
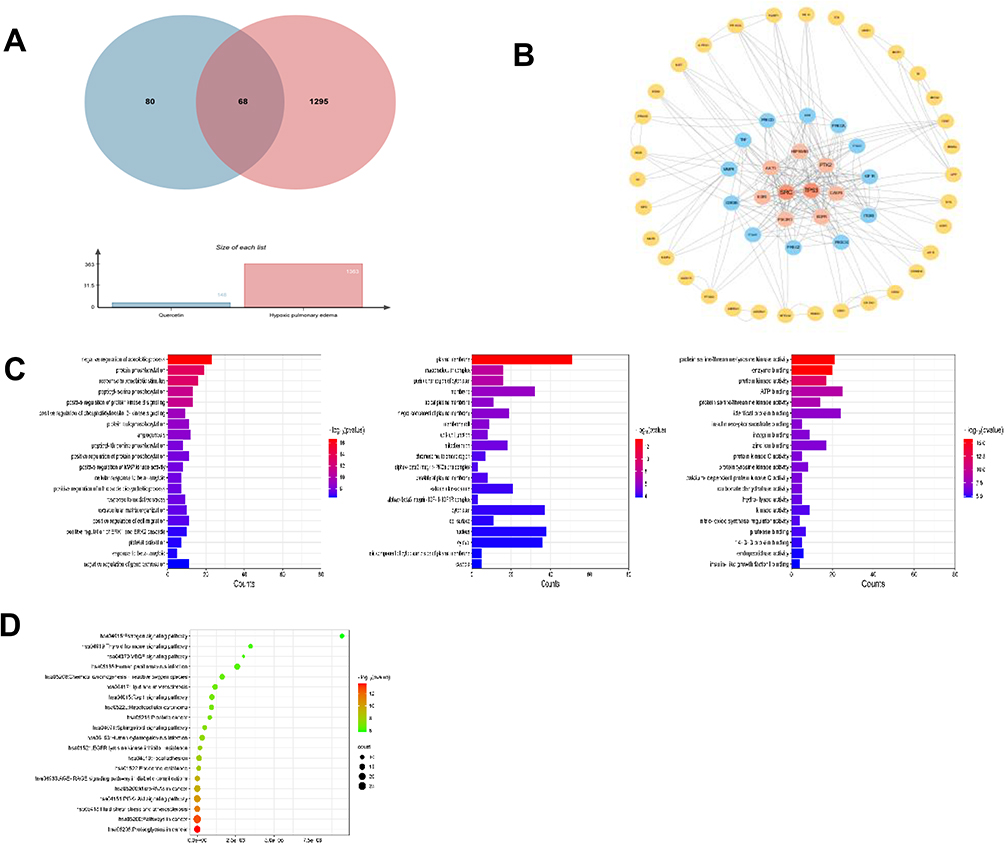 |
Figure 5 Pharmacology of QU against HAPE network. (A) Venn diagram of QU HAPE targets; (B) CYTOSCAPE constructs a common target PPI of QU and HAPE; (C) GO enrichment analysis results of intersection target.; (D) Analysis of KEGG enrichment pathway of intersection target. |
QU Reduces Intracellular Ca2+ Concentration via the ROCK/HIF/TRPC Signaling Pathway
Our study demonstrated a significant increase in Ca2+ influx and cell proliferation under hypoxia in PASMCs. However, both Ca2+ influx and cell number were decreased after QU intervention, indicating that QU inhibits extracellular calcium influx and PASMCs proliferation (Figure 6A). Subsequently, we performed Western blotting experiments, which showed that QU was able to downregulate the expression of ROCK, TRPC1, TRPC6 and HIF-1α in PASMCs (Figure 6B). The downregulation of TRPC6 and HIF-1α by QU in PASMCs was further confirmed by immunofluorescence staining results as seen in Figure 6C. These findings suggested that QU could inhibit hypoxia induced intracellular Ca2+ endocytosis and proliferation in PASMCs by modulating ROCK/HIF/TRPC signaling pathways.
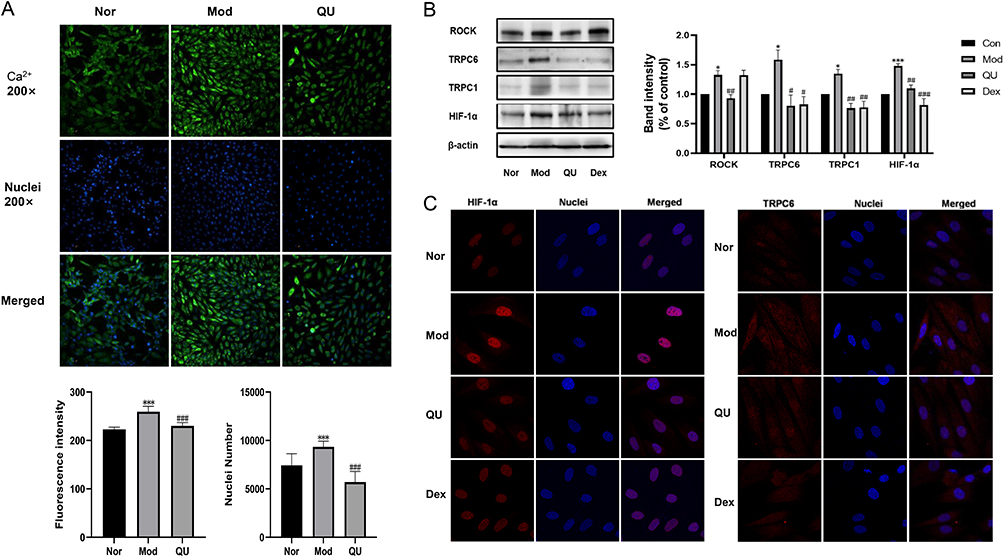 |
Figure 6 QU inhibited Ca2+ inward flow and downregulates ROCK/HIF/TRPC expression in PASMCs. (A) High-content assay to measure Ca2+influx and cell proliferation; (B) QU decreases TRPC6 and HIF-1α expression in PASMCs; (C) Immunofluorescence staining results. The results from five independent experiments (n≥5). ***P<0.001 compared with Nor group; ###P<0.001, compared with Mod group. |
QU Alleviates HAPE by Inhibiting Glycolysis Via Modulation of the ROCK/HIF/TRPC and PI3K/AKT/VEGF Signaling Pathways
To investigate the effect of QU on the ROCK/HIF/TRPC and PI3K/AKT/VEGF signaling pathways, Western blot analysis was performed. As shown in Figure 7A and B, QU treatment downregulated the expression of HIF-1α, TRPC6, ROCK, PI3K, AKT, and VEGF in lung tissues of HAPE mice, suggesting that QU may exert protective effects against HAPE by modulating these pathways.
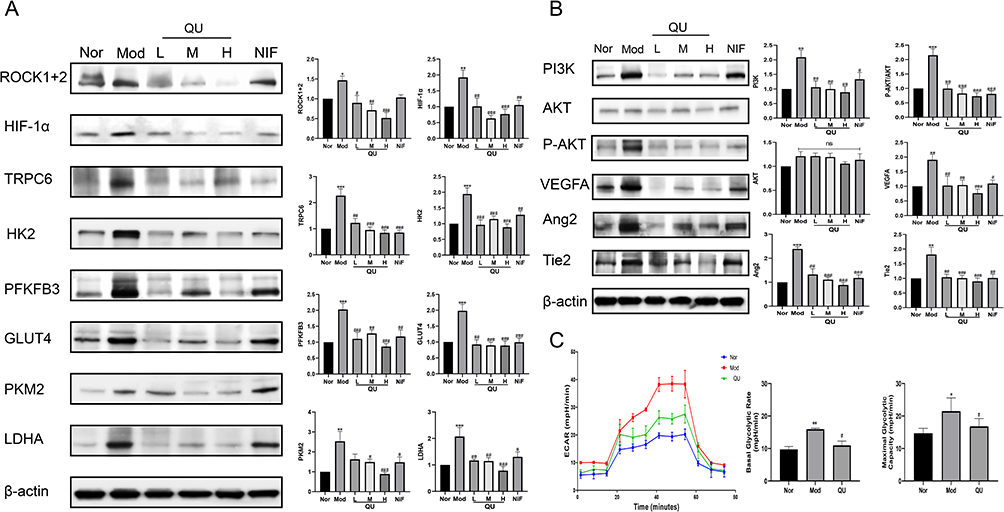 |
Figure 7 Effect of QU on the expression of ROCK/HIF/TRPC and PI3K/AKT signaling pathway-related proteins in lung tissues of mice with HAPE. (A) QU reduced ROCK/HIF/TRPC-related signaling pathway protein expression (n≥5); (B) QU regulated the expression of PI3K/AKT-related signaling pathway proteins (n≥5); (C) QU suppressed hypoxic PASMC glycolysis (n=5). *P<0.05, **P<0.01, ***P<0.001 compared with Nor group; #P<0.05, ##P<0.01, ###P<0.001 compared with Mod group. |
Furthermore, the extracellular acidification rate (ECAR) of PASMCs was measured using a Seahorse XFp Analyzer to evaluate glycolytic levels. As presented in Figure 7C, both basal glycolysis and maximal glycolytic capacity were significantly increased under hypoxic conditions, while QU treatment markedly reduced these parameters, indicating that quercetin inhibits hypoxia-induced glycolysis in PASMCs. Concurrently, analysis of key glycolytic enzymes in lung tissues revealed upregulated expression of PKM2, LDHA, HK2, GLUT4, and PFKFB3 in the Mod group, which was downregulated in all QU-treated groups (Figure 7A). These results demonstrate that QU attenuates pulmonary vascular remodeling by suppressing glycolysis, which is associated with the inhibition of the ROCK/HIF/TRPC and PI3K/AKT/VEGF signaling pathways.
Discussion
HAPE is an acute high altitude disease that typically manifests within a short period after individuals enter plateau environments. Under conditions of low oxygen, there is a notable increase in pulmonary blood flow and pulmonary vascular resistance, which triggers pulmonary vasoconstriction and increased pulmonary permeability, ultimately contributing to the onset of HAPE.11 The lung W/D ratio is a typical index of the pulmonary edema. This study found that both QU and its nanoliposome formulation QUL significantly reduced lung water content and effectively alleviated pathological symptoms associated with HAPE in model mice. After 24 hours of exposure to a hypoxic and low-pressure environment, the mortality rate in the Mod group reached 50%. In contrast, the mortality rates in the QUL-L, QUL-H, and QU groups were reduced to 37.5%, 25%, and 37.5%, respectively, representing decreases of 25%, 50%, and 25% compared to the Mod group. These results indicate that both QU and QUL significantly reduced mortality in mice with high-altitude pulmonary edema. Furthermore, analysis of serum biochemical parameters and cell counts in BALF showed that treatment with QU or QUL improved the biochemical indicators and reduced cell numbers in BALF, suggesting an amelioration of pulmonary vascular permeability. The majority of the pathophysiological processes underlying HAPE occur in PASMCs, where hypoxia induces thickening of the intimal and extimal layers of the vasculature. Intimal thickening is primarily attributed to the hyperproliferative migration of undifferentiated PASMCs.12 In our article, QU treatment effectively inhibited hypoxia-induced proliferation and migration of PASMCs, suggesting a potential therapeutic effect in attenuating the development of HAPE.
QU has been reported to possess various and complicated pharmacological effects, while the poor solubility and oral bioavailability limited its application. We successfully prepared quercetin nanoliposome using thin-film hydration method. The QUL revealed well-defined spheres structures with small particle sizes, uniformly distributed, high encapsulation efficiency. The stability of the liposomal formulation was systematically evaluated and confirmed by adjusting the pH of the solution and under various storage conditions. The results showed that the formulation could remain stable for extended time periods when stored at 4°C with a solution pH of 7.0. The pharmacokinetic study results demonstrated that oral administration of QUL to rats resulted in a significant increase in Cmax, AUC(0-t) and t1/2 values by 58.11%, 77.28%, and 36.84%, respectively, while the Tmax value was decreased by 56.24%. These results suggest that QUL may enhance oral bioavailability of quercetin due to its accelerated absorption rate and higher absorption content. Both in vivo and in vitro experiments demonstrated that QUL exhibited superior hypoxic protection and anti-HAPE effects.
Under hypoxic conditions, PASMCs undergo significant metabolic reprogramming, characterized by enhanced glycolytic flux. When mitochondrial oxidative phosphorylation is suppressed, glycolysis serves as the primary energy source, supplying necessary biosynthetic precursors and ATP for abnormal cell proliferation. This process promotes aberrant proliferation, migration, and anti-apoptotic capabilities in PASMCs¹³, thereby contributing to pulmonary vascular remodeling. Recent studies indicate that the small GTPase RhoA and its downstream effector Rho-associated kinase (ROCK) are involved in the pathogenesis of pulmonary hypertension. Hypoxia inhibits potassium channels, disrupts calcium homeostasis in PASMCs, leads to elevated cytosolic calcium levels, enhanced vasoconstriction, and stimulates PASMC proliferation.13,14 Intracellular calcium influx is regulated by TRPC family proteins, with TRPC6 playing a critical role. TRPC6 facilitates extracellular calcium entry, resulting in increased intracellular Ca²⁺ levels and subsequent vasoconstriction.15–17 Furthermore, inhibition of the RhoA/ROCK pathway has been shown to reduce HIF-1α expression, thereby modulating TRPC1/6 levels. Decreased TRPC1 and TRPC6 expression further attenuates ROCE- and SOCE-mediated Ca²⁺ influx, alleviating pulmonary vasoconstriction.18 Additional evidence suggests that HIF-1α directly upregulates multiple key glycolytic enzymes, influencing glycolytic metabolism under hypoxia.19 In summary, hypoxia activates the ROCK/HIF-1α/TRPC6 axis, modulating glycolysis and promoting abnormal PASMC proliferation and vasoconstriction. Our study demonstrates that QU effectively inhibits glycolysis and reduces Ca²⁺ influx in PASMCs under hypoxic conditions. Moreover, QU significantly downregulated the expression of ROCK, HIF-1α, TRPC6, and key glycolytic enzymes including HK2, PKM2, PFKFB3, GLUT1, and LDHA. Since ROCK activation enhances HIF-1α activity, which in turn promotes the transcription of glycolytic genes such as GLUT1, HK2, and PKM2, we propose that QU may regulate the expression of glycolytic enzymes and reduce glycolytic capacity by suppressing HIF-1α activity and function.
These alterations are also associated with the PI3K/Akt signaling pathway, which plays a crucial role in various signaling cascades that govern cell proliferation, migration, and angiogenesis.20 VEGFA, a pivotal mediator of angiogenesis, could promote endothelial cell proliferation, adhesion, and migration. VEGFA triggers Ang2 activation, which in turn enhances vascularization through the PI3K-AKT-VEGF-Ang2 signaling pathway.21–24 In our article, we revealed that the protein expression of PI3K, PAKT, VEGFA, Ang2, and Tie2 were elevated following exposure to hypoxia, which was attenuated by the administration of QU. However, these genes and signaling pathways do not function independently. Under hypoxic conditions, HIF-1α is activated and upregulates the expression of target genes such as VEGF, TRPC, and HK2, triggering a series of intracellular signaling events including PI3K phosphorylation, Ca²⁺ influx, and enhanced glycolysis. Angiogenesis, calcium dyshomeostasis, and aberrant glycolysis are key processes in the pathogenesis of HAPE, in which molecules such as VEGF, HIF-1α, ROCK, TRPC, and various glycolytic enzymes play central roles. These target molecules collectively promote the proliferation, phenotypic switching, and neovascularization of PASMCs, thereby exacerbating the pathological progression of HAPE.25,26 QU has been shown to modulate multiple key targets mentioned above. We speculate that QU may exert multi-target therapeutic potential in the prevention and treatment of HAPE by regulating the ROCK/HIF-1α/TRPC6/glycolysis axis and the PI3K/AKT/VEGFA/Ang2/Tie2 signaling pathway. Future studies should focus on elucidating the precise mechanisms of QU within these pathways to provide a deeper theoretical basis for its clinical application. Due to its favorable pharmacological properties and multi-target characteristics, QUL shows promise as a potential therapeutic agent for the clinical intervention of high-altitude pulmonary edema.
Conclusion
In this study, we successfully prepared a stable quercetin nanoliposome, which possessed a uniform DLS as well as high dispersion characteristics. The quercetin nanoliposome could notably enhance absorption rate and concentration of QU in rats and displayed a favorable pharmacokinetic profile. Additionally, our findings indicated that QU and QUL effectively suppressed HAPE by modulating the PI3K/AKT/VEGF and ROCK/HIF/TRPC pathways. Therefore, these findings facilitate the clinical development of quercetin and offer novel insights for the prevention and management of HAPE.
Abbreviations
AKT, protein kinase B; ALP, alkaline phosphatase; ALB, albumin; AUC, area under the curve; BALF, broncho alveolar lavage fluid; BP, biological processes; CCK-8, cell counting kit-8; Cmax, the peak plasma concentration; CLz/F, clearance; CC, cellular components; Dex, Dexamethasone; DLS, mean particle size; ECAR, extracellular acidification rate; GO, Gene Ontology; HAPE, high altitude pulmonary edema; HIF-1α, hypoxia-inducible factor 1-α; HPV, hypoxic pulmonary vasoconstriction; IS, internal standard; KEGG, Kyoto Encyclopedia of Genes and Genomes; LDH, lactate dehydrogenase; LLOQ, lower limit of quantification; MF, molecular functions; NiF, Nifedipine; PDI, polydispersity index; PASMCs, pulmonary artery smooth muscle cells; PI3K, phosphoinositide 3-kinase; PVR, pulmonary vascular resistance; QU, Quercetin; QUL, quercetin nanoliposome; ROCK, Rho-associated protein kinase; TP, total protein; TRPCs, transient receptor potential cation channels; TCMSP, Traditional Chinese Medicine Systems Pharmacology Database and Analysis Platform; TTD, Therapeutic Target Database; T1/2, half-life; MRT, mean residence time; VEGF, vascular endothelial growth factor; Vz/F, volume of distribution; W/D, lung wet-dry ratio.
Data Sharing Statement
The datasets generated and/or analyzed during the current study are available from the corresponding author on reasonable request.
Ethics Approval and Informed Consent
The experiments were conducted at the Central Laboratory of the Animal Ethics Committee of the Academy of Military Medical Sciences (Beijing, China). All animal studies are conducted in accordance with the regulations of the Animal Ethics Committee of the Academy of Military Medical Sciences (approval number: IACUC-DWZX-2022-612).
Author Contributions
All authors made a significant contribution to the work reported, whether that is in the conception, study design, execution, acquisition of data, analysis and interpretation, or in all these areas; took part in drafting, revising or critically reviewing the article; gave final approval of the version to be published; have agreed on the journal to which the article has been submitted; and agree to be accountable for all aspects of the work.
Funding
This research was supported by the National Natural Science Foundation of China (Grant Numbers: 82304867), Innovation Team and Talents Cultivation Program of National Administration of Traditional Chinese Medicine (ZYYCXTD-D-202207).
Disclosure
The authors report no conflicts of interest in regard to this work.
References
1. Gatterer H, Villafuerte FC, Ulrich S, Bhandari SS, Keyes LE, Burtscher M. Altitude illnesses. Nat Rev Dis Primers. 2024;10(1):43. doi:10.1038/s41572-024-00526-w
2. El Alam S, Pena E, Aguilera D, Siques P, Brito J. Inflammation in pulmonary hypertension and edema induced by hypobaric hypoxia exposure. IJMS. 2022;23(20):12656. doi:10.3390/ijms232012656
3. Singh P, Arif Y, Bajguz A, Hayat S. The role of quercetin in plants. Plant Physiolog Biochem. 2021;166:10–19. doi:10.1016/j.plaphy.2021.05.023
4. Yang D, Wang T, Long M, Li P. Quercetin: its main pharmacological activity and potential application in clinical medicine. Oxid Med Cell Longev. 2020;2020:1–13. doi:10.1155/2020/8825387
5. Ishizawa K, Yoshizumi M, Kawai Y, et al. Pharmacology in health food: metabolism of quercetin in vivo and its protective effect against arteriosclerosis. J Pharmacol Sci. 2011;115(4):466–470. doi:10.1254/jphs.10R38FM
6. Christou H, Khalil RA. Mechanisms of pulmonary vascular dysfunction in pulmonary hypertension and implications for novel therapies. Ame J PhysiolHeart Circul Physiol. 2022;322(5):H702–H724. doi:10.1152/ajpheart.00021.2022
7. Crosswhite P, Sun Z. Molecular mechanisms of pulmonary arterial remodeling. Mol Med. 2014;20(1):191–201. doi:10.2119/molmed.2013.00165
8. Tabeling C, Yu H, Wang L, et al. CFTR and sphingolipids mediate hypoxic pulmonary vasoconstriction. Proc Natl Acad Sci USA. 2015;112(13). doi:10.1073/pnas.1421190112
9. Morris HE, Neves KB, Nilsen M, Montezano AC, MacLean MR, Touyz RM. Notch3/Hes5 induces vascular dysfunction in hypoxia-induced pulmonary hypertension through er stress and redox-sensitive pathways. Hypertension. 2023;80(8):1683–1696. doi:10.1161/HYPERTENSIONAHA.122.20449
10. Mukhopadhyay P, Prajapati AK. Quercetin in anti-diabetic research and strategies for improved quercetin bioavailability using polymer-based carriers – a review. RSC Advances. 2015;5(118):97547–97562. doi:10.1039/C5RA18896B
11. Gojkovic M, Darmasaputra GS, Veliça P, Rundqvist H, Johnson RS. Deregulated hypoxic response in myeloid cells: a model for high‐altitude pulmonary oedema (HAPE). Acta Physiologica. 2020;229(2):e13461. doi:10.1111/apha.13461
12. Liu Y, Zhang H, Li Y, et al. Long noncoding RNA Rps4l mediates the proliferation of hypoxic pulmonary artery smooth muscle cells. Hypertension. 2020;76(4):1124–1133. doi:10.1161/HYPERTENSIONAHA.120.14644
13. Dunham-Snary KJ, Wu D, Sykes EA, et al. Hypoxic pulmonary vasoconstriction. Chest. 2017;151(1):181–192. doi:10.1016/j.chest.2016.09.001
14. Richalet JP, Hermand E, Lhuissier FJ. Cardiovascular physiology and pathophysiology at high altitude. Nat Rev Cardiol. 2024;21(2):75–88. doi:10.1038/s41569-023-00924-9
15. Mishra A, Mohammad G, Norboo T, Newman JH, Pasha MAQ. Lungs at high-altitude: genomic insights into hypoxic responses. J Appl Physiol. 2015;119(1):1–15. doi:10.1152/japplphysiol.00513.2014
16. Camacho Londoño JE, Marx A, Kraft AE, et al. Angiotensin-II-evoked Ca2+ entry in murine cardiac fibroblasts does not depend on TRPC channels. Cells. 2020;9(2):322. doi:10.3390/cells9020322
17. Wang H, Cheng X, Tian J, et al. TRPC channels: structure, function, regulation and recent advances in small molecular probes. Pharmacol Therap. 2020;209:107497. doi:10.1016/j.pharmthera.2020.10749719
18. Lei S, Peng F, Li ML, Duan WB, Peng CQ, Wu SJ. LncRNA-SMILR modulates RhoA/ROCK signaling by targeting miR-141 to regulate vascular remodeling in pulmonary arterial hypertension. Ame J Physiol Heart Circul Physiol. 2020;319(2):H377–H391. doi:10.1152/ajpheart.00717.2019
19. Li S, Wang J, Wei Y, et al. Critical role of TRPC6 in maintaining the stability of HIF-1α in glioma cells under hypoxia. J Cell Sci. 2015:
20. Kang Z, Jiang W, Luan H, Zhao F, Zhang S. Cornin induces angiogenesis through PI3K–Akt–eNOS–VEGF signaling pathway. Food Chem Toxicol. 2013;58:340–346. doi:10.1016/j.fct.2013.05.017
21. Ke B, Huang J, Duan Z, et al. VEGFA promotes the occurrence of PLA2R-associated idiopathic membranous nephropathy by angiogenesis via the PI3K/AKT signalling pathway. BMC Nephrol. 2022;23(1):313. doi:10.1186/s12882-022-02936-y
22. Zou W, Qian C, Zhang S, et al. Targeting the Ang2/Tie2 axis with tanshinone IIA elicits vascular normalization in ischemic injury and colon cancer. Oxid Med Cell Longev. 2021;2021(1):1–19. doi:10.1155/2021/7037786
23. Liu C, He L, Wang J, et al. Anti-angiogenic effect of Shikonin in rheumatoid arthritis by downregulating PI3K/AKT and MAPKs signaling pathways. J Ethnopharmacol. 2020;260:113039. doi:10.1016/j.jep.2020.113039
24. Lin Y, Jiang Y, Xian H, Cai X, Wang T. Expression and correlation of the Pi3k/Akt pathway and
25. Iorio J, Petroni G, Duranti C, Lastraioli E. Potassium and sodium channels and the warburg effect: biophysical regulation of cancer metabolism. Bioelectricity. 2019;1(3):188–200. doi:10.1089/bioe.2019.0017
26. Xiao Y, Peng H, Hong C, et al. PDGF Promotes the Warburg Effect in Pulmonary Arterial Smooth Muscle Cells via Activation of the PI3K/AKT/mTOR/HIF-1α Signaling Pathway. Cell Physiol Biochem. 2017;42(4):1603–1613. doi:10.1159/000479401
 © 2025 The Author(s). This work is published and licensed by Dove Medical Press Limited. The
full terms of this license are available at https://www.dovepress.com/terms
and incorporate the Creative Commons Attribution
- Non Commercial (unported, 4.0) License.
By accessing the work you hereby accept the Terms. Non-commercial uses of the work are permitted
without any further permission from Dove Medical Press Limited, provided the work is properly
attributed. For permission for commercial use of this work, please see paragraphs 4.2 and 5 of our Terms.
© 2025 The Author(s). This work is published and licensed by Dove Medical Press Limited. The
full terms of this license are available at https://www.dovepress.com/terms
and incorporate the Creative Commons Attribution
- Non Commercial (unported, 4.0) License.
By accessing the work you hereby accept the Terms. Non-commercial uses of the work are permitted
without any further permission from Dove Medical Press Limited, provided the work is properly
attributed. For permission for commercial use of this work, please see paragraphs 4.2 and 5 of our Terms.