Back to Journals » International Journal of Nanomedicine » Volume 13
Enhancement of surface bioactivity on carbon fiber-reinforced polyether ether ketone via graphene modification
Authors Yan JH, Wang CH, Li KW, Zhang Q ![]() , Yang M, Di-Wu WL, Yan M, Song Y, Ba JJ, Bi L, Han YS
, Yang M, Di-Wu WL, Yan M, Song Y, Ba JJ, Bi L, Han YS ![]()
Received 16 December 2017
Accepted for publication 30 March 2018
Published 14 June 2018 Volume 2018:13 Pages 3425—3440
DOI https://doi.org/10.2147/IJN.S160030
Checked for plagiarism Yes
Review by Single anonymous peer review
Peer reviewer comments 2
Editor who approved publication: Professor Lei Yang
Jin-Hong Yan,1,* Chun-Hui Wang,2,* Ke-Wen Li,1,3,* Qi Zhang,1 Min Yang,1 Wei-Long Di-Wu,1 Ming Yan,1 Yue Song,1 Jing-Jing Ba,4 Long Bi,1 Yi-Sheng Han1
1Department of Orthopedics, Xijing Hospital, Fourth Military Medical University, Xi’an, Shaanxi, 2Department of Army Military Medical Frontier Medical Service Brigade, Urumqi Ethnic Cadre College, Urumqi, Xinjiang Uyghur, 3Department of Orthopedics, Qinghai University Affiliated Hospital, Xining, Qinghai, 4Shandong Weigao Orthopedic Mechanics Laboratory, Weihai, Shandong, China
*These authors contributed equally to this work
Background and objective: The modulus of carbon fiber-reinforced polyether ether ketone (CFR-PEEK), a composite containing layers of carbon fiber sheets, can be precisely controlled to match bone. However, CFR-PEEK is biologically inert and cannot promote bone apposition. The objective of this study was to investigate whether graphene modification could enhance the bioactivity of CFR-PEEK.
Methods and results: In vitro, the proliferation and differentiation of rat bone marrow stromal cells on scaffolds were quantified via cell-counting kit-8 assay and Western blotting analysis of osteoblast-specific proteins. Graphene modification significantly promoted bone marrow stromal cell proliferation and accelerated induced differentiation into osteogenic lineages compared to cells seeded onto nongraphene-coated CFR-PEEK. An in vivo rabbit extraarticular graft-to-bone healing model was established. At 4, 8, and 12 weeks after surgery, microcomputed tomography analyses and histological observations revealed significantly better microstructural parameters and higher average mineral apposition rates for graphene-modified CFR-PEEK implants than CFR-PEEK implants (P<0.05). van Gieson staining indicated more new bone was formed around graphene-modified CFR-PEEK implants than CFR-PEEK implants.
Conclusion: Graphene may have considerable potential to enhance the bioactivity and osseointegration of CFR-PEEK implants for clinical applications.
Keywords: graphene, carbon fiber-reinforced polyether ether ketone, surface modification, bioactivity, osseointegration
Introduction
Application of implants in orthopedic surgery has been demonstrated to restore the structure and function of bones and joints that have been damaged by trauma, arthritis, bone tumors, infections, or medication-related osteonecrosis.1 Various materials, including metals, ceramics, polymers, and composites, are used to prepare orthopedic implants.
Metals (eg, stainless steel and titanium alloys) are widely used as prostheses, due to their high mechanical strength and excellent friction resistance.2,3 However, metals can release harmful metal ions and are radiopaque, which limits their application.4 Ceramics (eg, Al2O3, hydroxyapatite, and bioglass) exhibit excellent biocompatibility and good corrosion resistance, but their mechanical properties, fracture toughness, and ductility are insufficient for load-bearing applications.5 Polymers like polytetrafluoroethylene and polylactide are also used widely in biomedical implants. However, because of their poor mechanical properties and instability during sterilization processes, few polymers are used in orthopedic implants.6
The thermoplastic polymer polyether ether ketone (PEEK) retains stable chemical and physical properties during sterilization processes.7 Carbon fiber-reinforced PEEK (CFR-PEEK) is a PEEK composite containing layers of carbon fiber sheets. In contrast to metal alloys, CFR-PEEK is radiolucent, and the modulus of CFR-PEEK can be precisely controlled to match that of bone accurately by changing the orientation and number of carbon fiber layers. This feature reduces stress shielding and makes CFR-PEEK a suitable choice for a number of orthopedic implants. However, CFR-PEEK cannot promote bone apposition, due to its bioinert chemical properties.8,9
Two principal strategies – surface modification and composite preparation – have been proposed to increase the bioactivity of PEEK-based hybrid materials to improve the bone–implant interface.10 Reinforcements, such as TiO2, ZrO2, and nanohydroxyapatite, improve the biological compatibility of CFR-PEEK, but usually negatively affect mechanical properties, thus limiting the clinical application of such reinforcements.11–13 In contrast, surface modification is an effective method of tailoring surface mechanical and biological properties while preserving the favorable bulk characteristics of the material.14
Graphene, isolated by Novoselov and Geim in 2004, is an atomically thick sheet. Over the last decade, graphene has received unprecedented attention, owing to its high mechanical strength, large surface area, low mass density, and excellent thermal and electrical conductivity.15 In 2010, Kalbacova et al indicated that graphene exerts osteogenic effects toward human mesenchymal stem cells.16 We recently demonstrated that graphene promoted the adhesion, proliferation, and osteogenic differentiation of MC3T3E1 cells on graphene-coated polyethylene terephthalate artificial ligaments. These excellent mechanical and biological properties indicate graphene may represent a new type of coating material for tissue engineering in implants and scaffolds.17
In this study, we investigated whether transferring graphene onto the surface of CFR-PEEK would improve CFR-PEEK bioactivity in vitro and in vivo. We hypothesized that graphene could be coated stably onto the surface of CFR-PEEK, and that graphene-modified CFR-PEEK (G-CFR-PEEK) would promote the proliferation and osteogenic differentiation of bone marrow stromal cells (BMSCs) compared to cells on non-G-CRF-PEEK.
Materials and methods
Scaffold fabrication
The large-scale graphene used in this study was synthesized on copper foil via chemical vapor deposition.18 G-CFR-PEEK scaffolds were prepared using a previously published protocol.17 Briefly, after a layer of polymethyl methacrylate (PMMA) was coated onto a graphene–copper surface, FeCl3 solution was used to etch the copper. Then, the free-standing PMMA–graphene membrane was placed onto the CFR-PEEK (disk, φ=25 mm for Western blot analysis, φ=12 mm for other in vitro tests; rods, length 10 mm, φ=6 mm for in vivo tests) with the graphene facing the surface of the CFR-PEEK. Finally, G-CFR-PEEK scaffolds were obtained by dissolving the PMMA with acetone, then each scaffold was washed several times with absolute ethanol, rinsed with deionized water, and dried in an oven at 60°C for 24 hours.
Scaffold characterization
Raman spectroscopy analysis and scanning electron microscopy (SEM)
The fine structures of graphene on copper were characterized via Raman spectroscopy (Jobin Yvon HR800; Horiba, Kyoto, Japan) using a 633 nm wavelength laser. After gold coating, the surface morphologies of the CFR-PEEK and G-CFR-PEEK samples were investigated via field-emission SEM (S4800; Hitachi, Tokyo, Japan) at an accelerating voltage of 5 kV.
Wettability properties
The wettability of the scaffolds with water was examined by measuring the contact angle at three different locations on each sample (n=6). Briefly, 3 μL water was dropped onto the surface of each CFR-PEEK and G-CFR-PEEK sample using an EasyDrop Standard (Krüss GmbH, Hamburg, Germany). When the droplet contacted the surface of the scaffold, photographs were captured and the contact angle calculated. The mean of six measurements for each sample was calculated.
In vitro tests
Isolation and culture of rat BMSCs
All procedures for animal experiments were approved by the Institutional Animal Care Committee of the Fourth Military Medical University and executed in compliance with the US National Institutes of Health Guidelines on the Care and Use of Laboratory Animals. Bone marrow was harvested from the tibia and femur of dead male 3-week-old Sprague Dawley rats under sterile conditions. The marrow cavity was gently, repeatedly rinsed with α-MEM (HyClone, Logan, UT, USA) to obtain a single-cell suspension. The cells were cultured in α-MEM containing 10% fetal bovine serum (FBS) (Thermo Fisher Scientific, Waltham, MA, USA), 100 U/mL penicillin, and 100 U/mL streptomycin at 37°C in a humidified atmosphere of 5% CO2. After 48 hours, nonadherent cells were carefully removed and the culture medium replaced. Thereafter, the culture medium was refreshed every 2–3 days. The BMSCs in these experiments were used before passage five. Flow cytometry was used to confirm expression of the surface antigen markers CD29, CD34, CD44, and CD45 on BMSCs.
All scaffold samples, in addition to stainless-steel rings (inner diameter 12.2 mm), were sterilized using a cobalt 60 source for 24 hours, then rinsed twice with sterile PBS before cell seeding. Each scaffold was placed in a 24-well plate and an autoclaved stainless-steel ring was placed around each scaffold to confine the seeding area. In all experiments, scaffolds were transferred to another 24-well plate at 4 hours after seeding.
Attachment and morphology of BMSCs on scaffolds
BMSCs were seeded onto the scaffolds (in 24-well plates) at a density of 1.5×10⁴ cells per well. At 1 or 3 days after seeding (n=3 each), scaffolds were rinsed twice with PBS, fixed overnight in 2.5% glutaraldehyde, and washed three times with double-distilled water. Prior to SEM (S4800), samples were sequentially dehydrated using a series of different concentrations of ethanol (30%, 50%, 70%, 90%, 95%, and 100% v:v, 10 minutes each). After being sputter-coated with gold, the dried scaffolds were observed via SEM at an accelerating voltage of 5 kV.
Cell-counting kit-8 (CCK-8) assay
The CCK-8 assay (Dojindo, Kumamoto, Japan) was employed to quantify the cell viability and proliferation of BMSCs on the scaffolds at 1, 3, 5, and 7 days after seeding. BMSCs were seeded onto the scaffolds (three replicates) in 24-well plates at a density of 3×10⁴ cells per well. The culture medium was refreshed 24 hours before each time point. CCK-8 solution (100 μL) was added to each well, and samples were incubated for 4 hours. Then, 110 μL medium in each well was transferred into a 96-well plate and optical density (OD) values evaluated using a microplate reader (Dragon WellScan MK3; Labsystems Diagnostics, Vantaa, Finland) at 450 nm (n=6).
In vitro cell-image analysis
BMSCs were seeded onto the samples (n=3) at a density of 3×10⁴ cells per well. After 1, 3, 5, or 7 days, the culture medium was replaced with equal quantities of fresh α-MEM. Fluorescein diacetate (FDA; Sigma-Aldrich, St Louis, MO, USA) and propidium iodide (PI; Sigma-Aldrich) were added simultaneously to each well to attain final concentrations of 100 μg/mL and 60 μg/mL, respectively. FDA can cross intact cell membranes and is hydrolyzed to fluorescein by intracellular esterases (living cells appear green under fluorescence microscopy), whereas PI only penetrates damaged nuclear membranes and stains the nucleic acids of nonviable cells (nonviable cells appear red). Cells were viewed using confocal laser-scanning microscopy (TCS SP5; Leica Microsystems, Wetzlar, Germany).
Additionally, BMSCs were seeded onto scaffolds (n=3) at a density of 1.5×10⁴ cells per well. At 1 or 3 days after seeding, the samples were fixed with 4% w:v paraformaldehyde for 30 minutes, permeabilized with 0.1% Triton X-100 for 20 minutes, and blocked with 1% bovine serum albumin for 30 minutes at room temperature (RT). Samples were incubated with 10 μg/mL primary antivinculin antibody (ab129002; Abcam, Cambridge, UK) for 12 hours at 4°C, followed by fluorescein isothiocyanate-labeled goat antirabbit immunoglobulin G antibody (Abcam) for 2 hours, then tetramethylrhodamine isothiocyanate-labeled phalloidin (Cytoskeleton, Denver, CO, USA) for 40 minutes at RT to stain the actin cytoskeleton. Then, samples were incubated in 4′,6-diamidino-2-phenylindole for 5 minutes to stain cell nuclei. Samples were washed three times with PBS after every incubation step. Scaffolds were mounted on coverslips and examined using confocal laser scanning microscopy (TCS SP5).
Alkaline phosphatase staining and assay
BMSCs were seeded onto the scaffolds (n=3) at a density of 3×10⁴ cells per well. At 24 hours after seeding, the medium was replaced with osteoinductive medium composed of DMEM with 4.5 g/L glucose, 10% v:v FBS, 10 mM sodium β-glycerophosphate, 50 μg/mL vitamin C, 10−8 mM dexamethasone, 100 U/mL penicillin, and 100 U/mL streptomycin, and cells were cultured for 7 or 14 days. After being washed three times with PBS, cells were fixed in ice-cold acetone (4°C) for 2 minutes and washed three times with PBS (pH 7.4). Alkaline phosphatase (ALP) staining was performed using a 5-bromo-4-chloro-3-indolyl phosphate–nitro blue tetrazolium ALP staining kit (Beyotime, Haimen, China) according to the manufacturer’s instructions, and staining was observed using stereomicroscopy (M205FA; Leica Microsystems).
ALP activity was also quantified using an ALP assay kit (Beyotime). After 7 and 14 days culture in osteoinductive medium, scaffolds were washed three times with PBS and cells harvested via trypsinization, centrifuged at 1,500 rpm for 5 minutes, lysed using 0.1% Triton X-100, and sonicated twice on ice. Fragmentized cells were centrifuged at 12,000 rpm for 20 minutes at 4°C, and ALP activity quantified using a colorimetric ALP assay kit based on the conversion of colorless para-nitrophenylphosphate to colored para-nitrophenol after coincubation for 30 minutes at 37°C. ALP activity was normalized to total intracellular protein content, which was determined using a bicinchoninic acid assay (BCA) protein kit (Beyotime). ALP activity is expressed as nanomoles para-nitrophenol released per minute per microgram protein.
Extracellular matrix mineralization assay
Calcium mineralization was measured by assessing selective binding of alizarin red S (ARS, Sigma) to calcium salts. BMSCs were seeded onto scaffolds at a density of 3×10⁴ cells per well, cultured in osteoinductive medium for 21 and 28 days, then washed three times with PBS, fixed in ice-cold ethanol for 5 minutes, stained with 0.5% ARS (pH 8.3) for 30 minutes at RT, washed with distilled water until the water was clear, and assessed by stereomicroscopy (M205FA).
Western blotting analysis
Scaffolds were placed into 6-well plates (φ=25 mm), seeded with BMSCs at a density of 1.5×10⁵ cells per well (three replicates), and incubated for 7 and 14 days. For Western blotting analysis, total cytoplasmic proteins were extracted using radioimmunoprecipitation lysis buffer (Beyotime) and protein content determined using a BCA protein assay kit (Thermo Fisher Scientific). Proteins were separated by 10% sodium dodecyl sulfate polyacrylamide-gel electrophoresis and electroblotted onto polyvinylidene difluoride membranes (Merck Millipore, Billerica, MA, USA). Membranes were incubated overnight at 4°C with primary anti-Runx2, anti-BMP2, anti-Col1A1, and anti-Osx antibodies (all Abcam). Immunoreactive bands were detected using antirabbit or antimouse fluorescein-conjugated secondary antibodies (Goodbio, Wuhan, China) and visualized using an Epson V300 image-scanning system. Densitometric analyses were performed using Photoshop software (Adobe, San Jose, CA, USA).
In vivo experiments
Implantation surgery
A total of 36 mature New Zealand rabbits (male, 12 weeks old, 3.2±0.3 kg) were subjected to a surgical extraarticular graft-to-bone healing procedure. The rabbits were fasted with free access to water for 12 hours before the experiment, then anaesthetized using xylazine hydrochloride (1 mg/kg) and 3% pentobarbital (30 mg/kg) via intramuscular injection. After disinfection and incision, a tunnel (φ=6 mm, L>10 mm) was drilled through the femoral condyle using 4 mm diameter and 6 mm diameter aiguilles.
A G-CFR-PEEK implant was implanted into the condyle of one femur and a CFR-PEEK implant implanted into the contralateral femoral condyle as the control. The wounds were sutured in layers. Postoperatively, gentamicin (5 mg/kg) and penicillin (50 kU/kg) were administered intramuscularly for 3 days. At 4, 8, or 12 weeks after surgery, the rabbits were humanely killed for subsequent examinations. To assess osteogenic activity, the fluorochromes tetracycline (50 mg/kg at 14 days before death; Sigma-Aldrich) and calcein (8 mg/kg at 4 days before death; Sigma-Aldrich) were administered via intramuscular injection to the rabbits killed at the 4-week time point.
Microcomputed tomography analysis
The femoral condyles were carefully dissected, fixed in 80% ethanol for 2 weeks, placed in a sample holder, and scanned using an X-ray three-dimensional (3D imaging system (Cheetah; Yxlon, Hamburg, Germany). For each specimen, a 4×10 mm cylindrical region in the middle of the bone tunnel along the longitudinal axis was selected as the region of interest. This region was reconstructed and analyzed at a threshold of 2,000 using the VGStudio Max software package (Volume Graphics, Heidelberg, Germany) to determine bone volume (BV)/total volume (TV; %), bone surface (BS)/BV (1/mm), trabecular thickness (TbTh; mm), trabecular number (TbN; 1/mm), and trabecular spacing (TbSp; mm).
Biomechanical testing
The push-out test was applied to investigate the weld strength of the implant–bone interface using a universal mechanical testing machine (858 Mini Bionix; MTS, Eden Prairie, MN, USA). Femoral condyles were extracted from rabbits killed at 4, 8, or 12 weeks after surgery and trimmed to fit the size of the testing machine fixture. Metal rods (φ=4 mm) were applied to the implants to detach the implants gradually from the femoral condyle at 1 mm/min loading speed. Maximum failure load was recorded from the load–displacement curves. To determine the bone–implant contact area, the thickness of cortical bone was measured at five sites and shear strength between bone tissue and the implant calculated.
Histological analysis
After the microcomputed tomography analysis, femoral condyle samples were dehydrated using a graded ethanol series (70%–100%) and soaked in methyl methacrylate solution for 3 weeks. After polymerization of the methyl methacrylate, pathology sections were prepared using a Leica Microtome. Sections prepared from animals killed at 4 weeks were observed by fluorescence microscopy to determine the mineral apposition rate (MAR) of new bone formation by monitoring the length between the two labels over time (μm/day). Then, all bone sections were stained using van Gieson staining and osseointegration of the bone–implant interfaces observed by light microscopy (DM6000B; Leica Microsystems). The new bone area rate and bone:implant contact ratio were calculated to analyze quantitatively the extent of mineralized bone tissue. For histomorphometric measurements, a 1 mm annular region around the implant was selected as the region of interest.
Statistical analysis
All data were analyzed using SPSS 16.0 (SPSS, Chicago, IL, USA) or Prism 5 (GraphPad, La Jolla, CA, USA). Data are representative of at least three separate experiments. All quantitative data are expressed as means ± SD for each group, and significance was evaluated using Student’s t-test. Significance was defined as P<0.05.
Results
Scaffold fabrication and characterization
As shown in Figure 1A, the large-scale chemical vapor deposition-grown graphene on copper foils was characterized via SEM. Raman spectroscopy analysis is presented in Figure 1B. The G (1,580 cm−1) and two-dimensional (2,670 cm−1) bands were the most prominent features in the graphene samples. These features were used to identify graphene and determine its layers. Graphene was stably transferred onto the surface of the CFR-PEEK scaffolds. CFR-PEEK and G-CFR-PEEK scaffolds had comparable local surface morphology but looked very different at the ultrascale. The G-CFR-PEEK scaffolds (Figure 1D) contained many ripples and wrinkles on the micrometer scale, whereas the surface of CFR-PEEK (Figure 1C) consisted of a large number of larger valleys. Also, the G-CFR-PEEK scaffolds had a significantly lower water-contact angle (74.96°±1.65°) than the CFR-PEEK scaffolds (91.26°±1.53°, P<0.05), indicating graphene modification effectively increased the wettability of CFR-PEEK scaffolds (Figure 2).
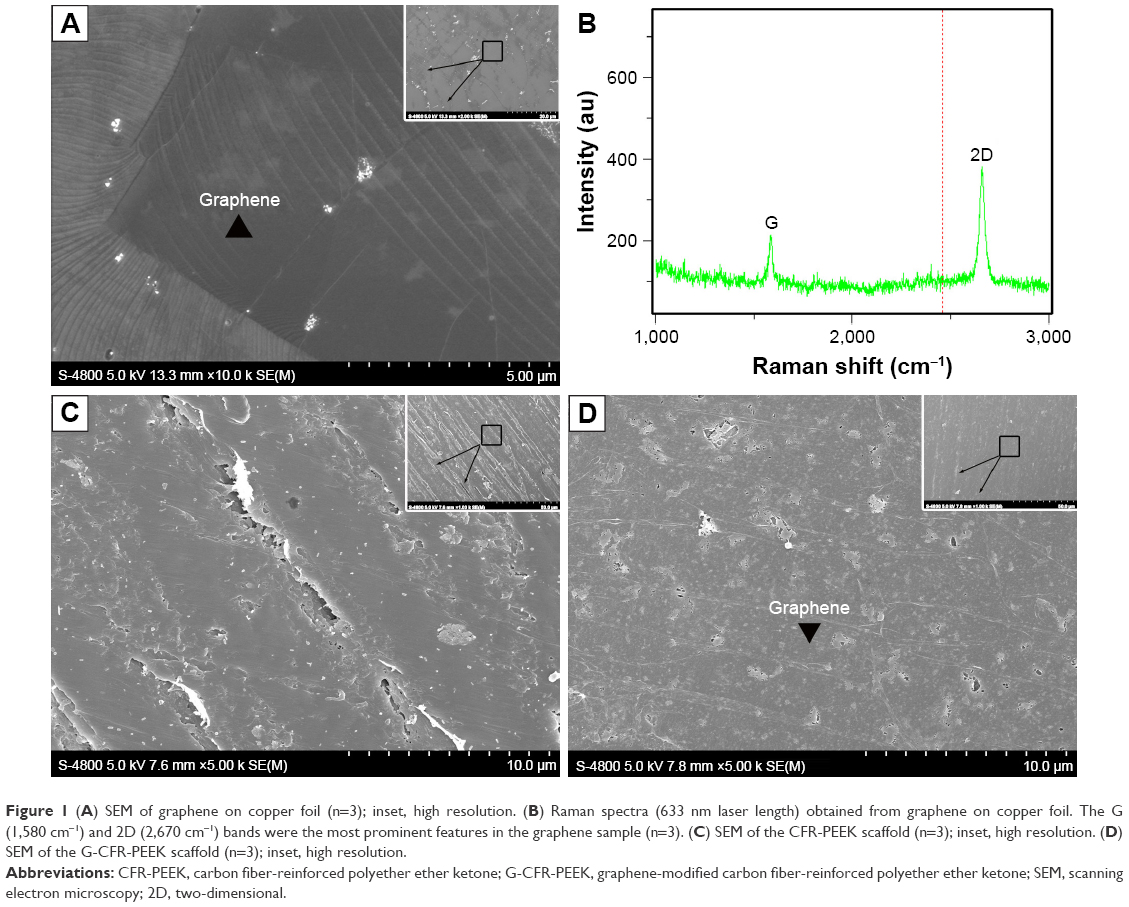 | Figure 1 (A) SEM of graphene on copper foil (n=3); inset, high resolution. (B) Raman spectra (633 nm laser length) obtained from graphene on copper foil. The G (1,580 cm−1) and 2D (2,670 cm−1) bands were the most prominent features in the graphene sample (n=3). (C) SEM of the CFR-PEEK scaffold (n=3); inset, high resolution. (D) SEM of the G-CFR-PEEK scaffold (n=3); inset, high resolution. |
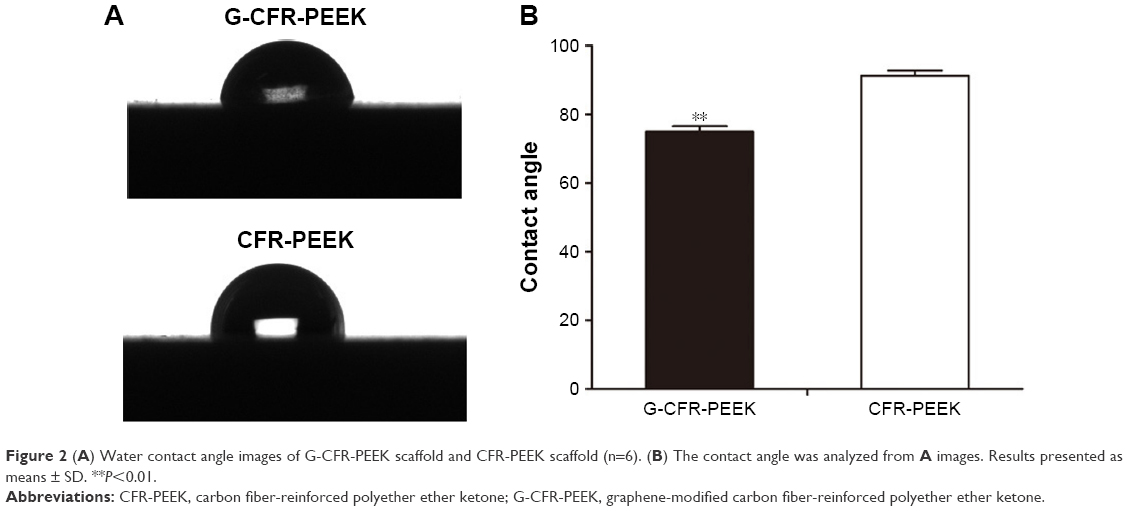 | Figure 2 (A) Water contact angle images of G-CFR-PEEK scaffold and CFR-PEEK scaffold (n=6). (B) The contact angle was analyzed from A images. Results presented as means ± SD. **P<0.01. |
Isolation and culture of rat BMSCs
After the third passage, the adherent cells had expanded and gradually fused into one other to form relatively homogeneous, long, spindle-shaped colonies. Compared with the first passage cells, these cells exhibited greater homogeneity. Flow cytometry demonstrated the isolated cells were CD29+, CD44+, CD34−, and CD45−, confirming they were BMSCs (Figure 3A).
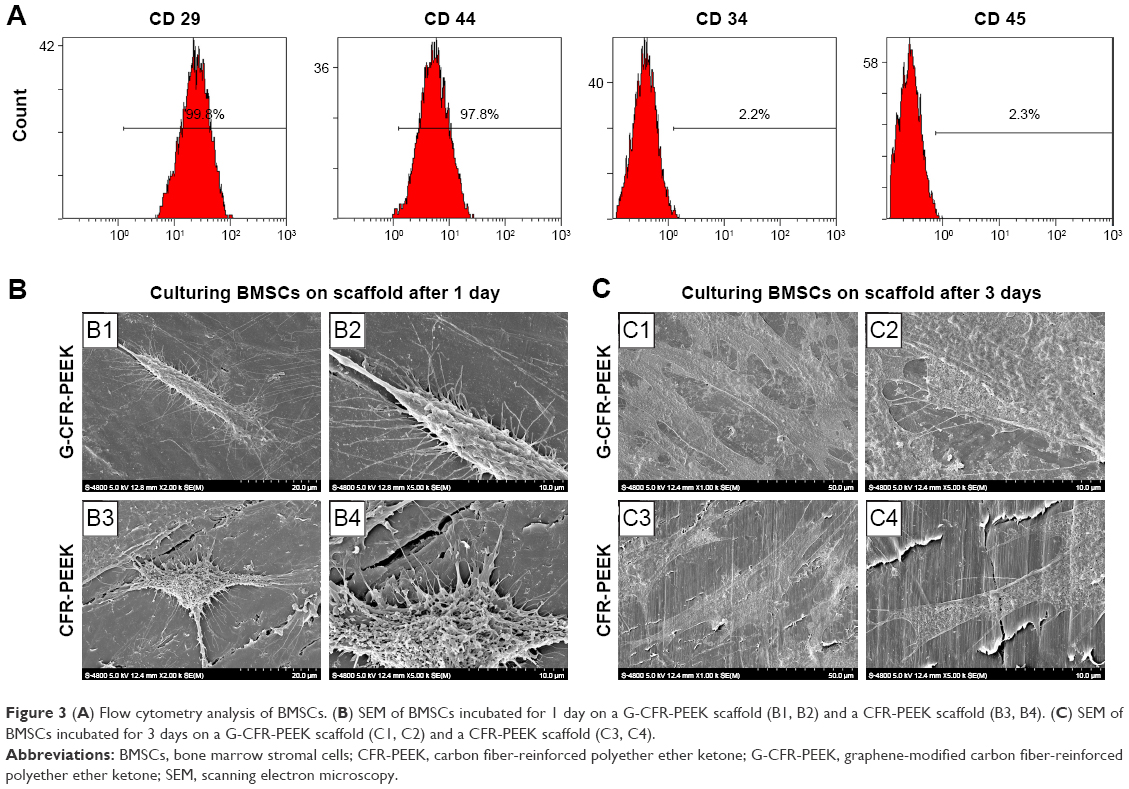 | Figure 3 (A) Flow cytometry analysis of BMSCs. (B) SEM of BMSCs incubated for 1 day on a G-CFR-PEEK scaffold (B1, B2) and a CFR-PEEK scaffold (B3, B4). (C) SEM of BMSCs incubated for 3 days on a G-CFR-PEEK scaffold (C1, C2) and a CFR-PEEK scaffold (C3, C4). |
BMSC adhesion and proliferation on scaffolds
SEM (Figure 3B) revealed that BMSCs adhered more firmly to the G-CFR-PEEK scaffolds, presented more cellular pseudopods, and had more spindle-shaped morphology at 24 hours after seeding than the starlike cells on CFR-PEEK scaffolds. After 3 days’ culture (Figure 3C), a greater amount of extracellular matrix (ECM) was observed on the seeded G-CFR-PEEK scaffolds than seeded CFR-PEEK scaffolds.
To investigate the biocompatibility of the scaffolds further, BMSC morphology was observed at 24 and 72 hours after seeding. Immunostaining for vinculin (green), F-actin (red), and DNA (blue) was performed on the seeded scaffolds (Figure 4). After 24 hours’ culture, BMSCs were well distributed on the G-CFR-PEEK scaffolds, with a projected cell area of 1,589.3±178.7 μm2, whereas the cells on CFR-PEEK scaffolds had starlike morphology and smaller area of 692.0±68.2 μm2 (P<0.05). After 72 hours’ culture, the projected cell areas on G-CFR-PEEK and CFR-PEEK scaffolds were 2,336.5±132.3 μm2 and 1,915.5±195.8 μm2, respectively (P<0.05). Integral OD values for vinculin immunostaining were calculated quantitatively to evaluate BMSC adhesion. BMSCs on G-CFR-PEEK scaffolds exhibited significantly higher levels of focal adhesion compared with cells on CFR-PEEK scaffolds at all time points (P<0.05; Figure 4).
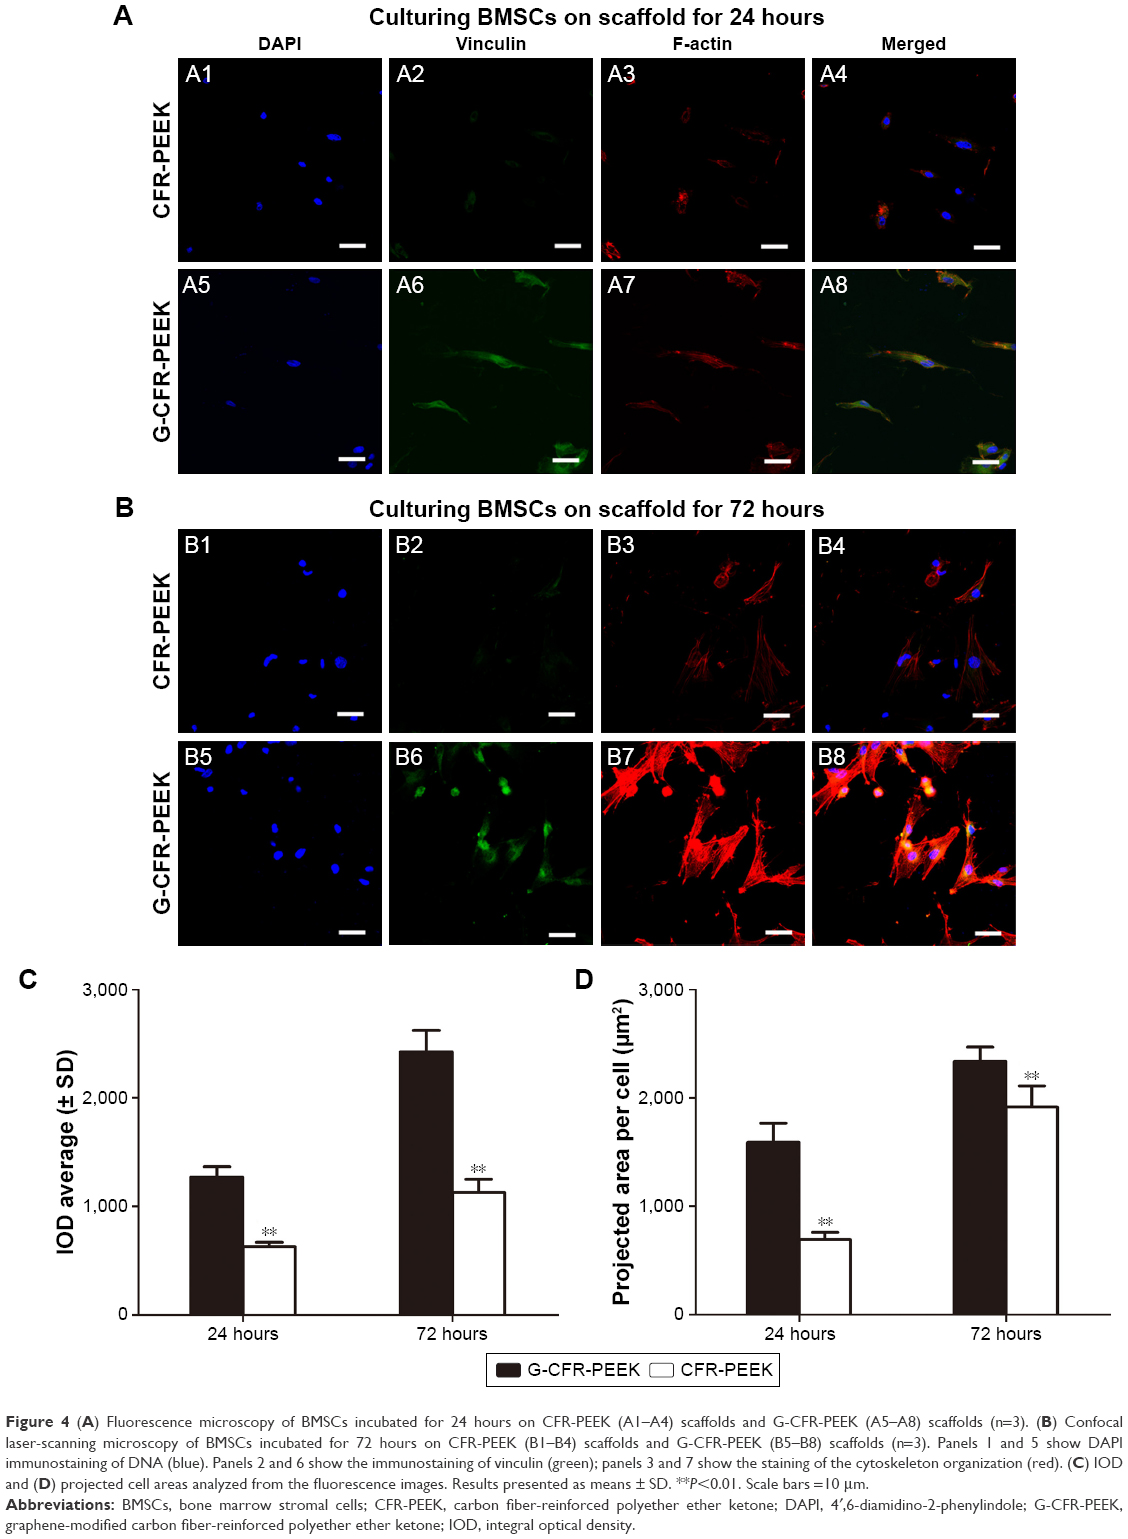 | Figure 4 (A) Fluorescence microscopy of BMSCs incubated for 24 hours on CFR-PEEK (A1–A4) scaffolds and G-CFR-PEEK (A5–A8) scaffolds (n=3). (B) Confocal laser-scanning microscopy of BMSCs incubated for 72 hours on CFR-PEEK (B1–B4) scaffolds and G-CFR-PEEK (B5–B8) scaffolds (n=3). Panels 1 and 5 show DAPI immunostaining of DNA (blue). Panels 2 and 6 show the immunostaining of vinculin (green); panels 3 and 7 show the staining of the cytoskeleton organization (red). (C) IOD and (D) projected cell areas analyzed from the fluorescence images. Results presented as means ± SD. **P<0.01. Scale bars =10 μm. |
BMSC proliferation on CFR-PEEK and G-CFR-PEEK scaffolds was evaluated using the CCK8 assay at 1, 3, 5, and 7 days after seeding (Figure 5A). OD values of seeded CFR-PEEK and G-CFR-PEEK scaffolds increased over time, with significantly higher OD observed for G-CFR-PEEK scaffolds than CFR-PEEK scaffolds at all time points (P<0.05). FDA and PI staining were also used to evaluate cell growth on the scaffolds. As shown in Figure 5C, the number of live cells increased over time in all groups; however, the number of live cells was significantly higher for G-CFR-PEEK scaffolds than CFR-PEEK scaffolds at all time points (P<0.05; Figure 5B).
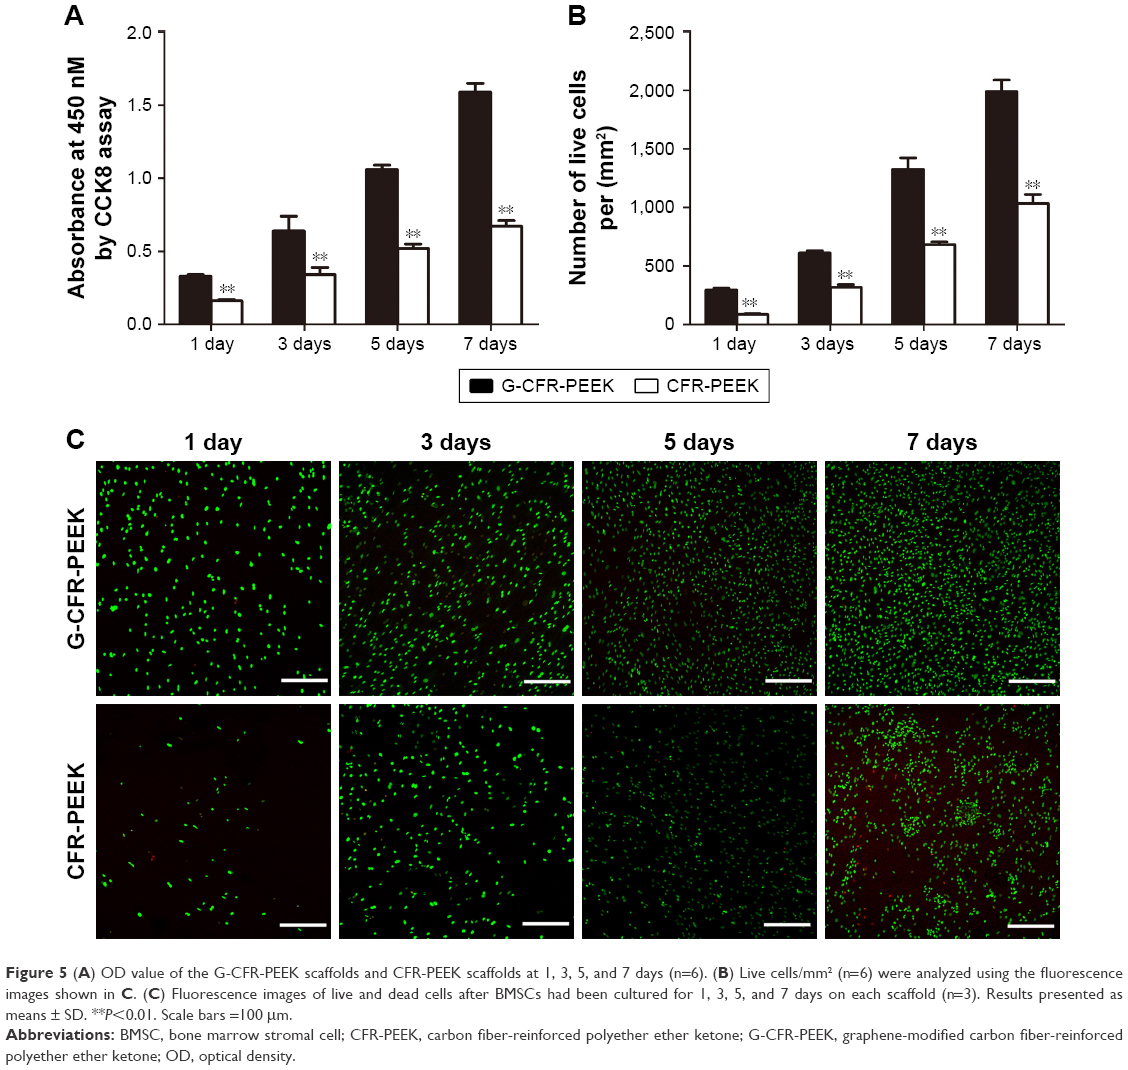 | Figure 5 (A) OD value of the G-CFR-PEEK scaffolds and CFR-PEEK scaffolds at 1, 3, 5, and 7 days (n=6). (B) Live cells/mm2 (n=6) were analyzed using the fluorescence images shown in C. (C) Fluorescence images of live and dead cells after BMSCs had been cultured for 1, 3, 5, and 7 days on each scaffold (n=3). Results presented as means ± SD. **P<0.01. Scale bars =100 μm. |
BMSC differentiation on scaffolds in vitro
Expression and activity of ALP, an early marker of osteoblast differentiation, were assessed to evaluate the osteoblastic differentiation ability of the seeded BMSCs after 4 and 7 days’ culture in osteogenic induction media (Figure 6A). As shown in Figure 6C, ALP expression was significantly higher for BMSCs on G-CFR-PEEK scaffolds than CFR-PEEK scaffolds at 4 and 7 days. Moreover, cells on G-CFR-PEEK scaffolds had significantly higher ALP activity (1.82±0.07 and 3.03±0.09 nmol/min/mg at 4 and 7 days, respectively) than cells on CFR-PEEK scaffolds (0.91±0.03 and 1.61±0.03 nmol/min/mg at 4 and 7 days, respectively; P<0.05). After 21 and 28 days’ culture in induction media, ARS staining was performed to determine calcium salt sedimentation, a marker of the late stage of osteogenic differentiation. ARS-positive staining was much stronger for cells on G-CFR-PEEK scaffolds than CFR-PEEK scaffolds at all time points (Figure 6B). Moreover, almost no mineralized nodule formation was observed in the CFR-PEEK group after 21 days’ induction.
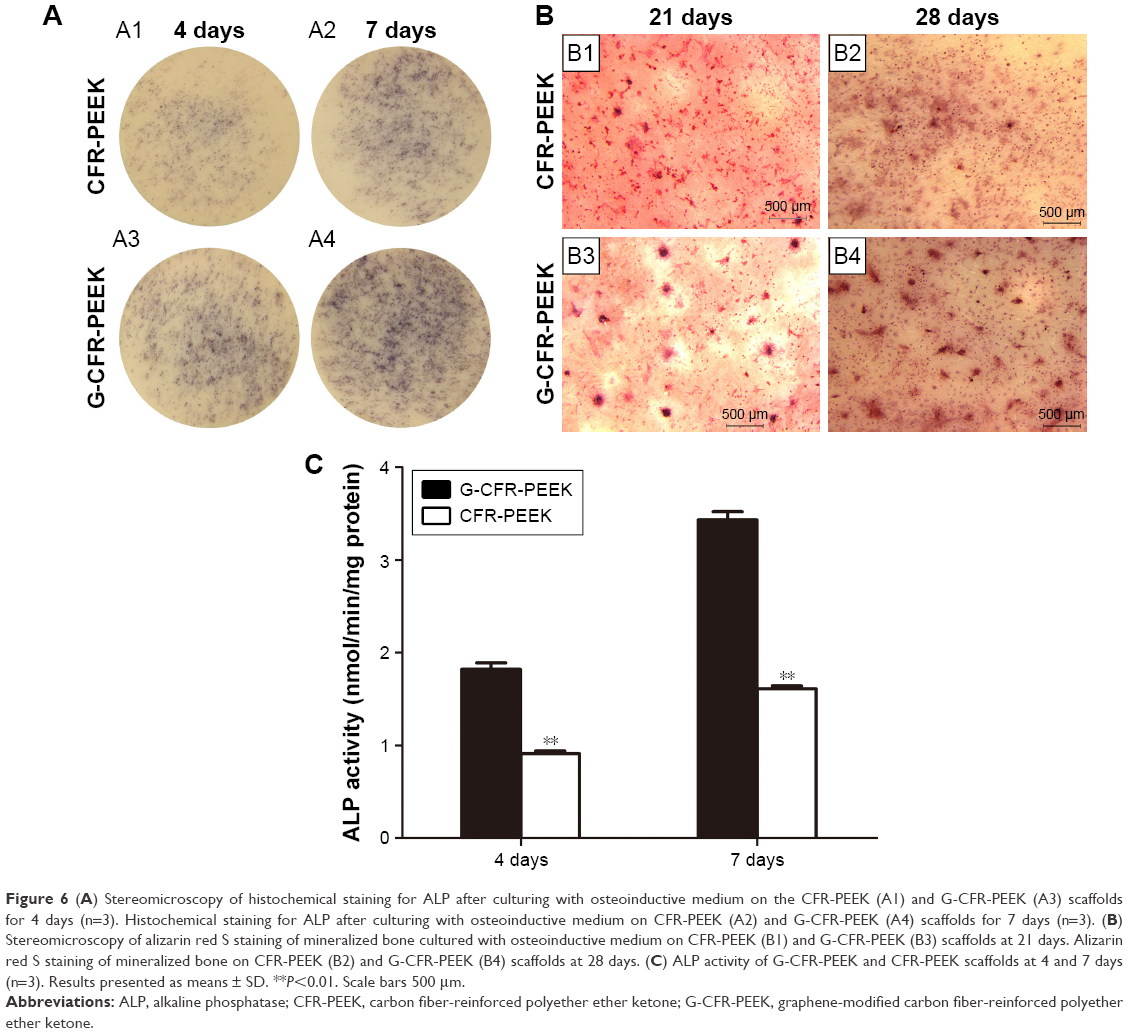 | Figure 6 (A) Stereomicroscopy of histochemical staining for ALP after culturing with osteoinductive medium on the CFR-PEEK (A1) and G-CFR-PEEK (A3) scaffolds for 4 days (n=3). Histochemical staining for ALP after culturing with osteoinductive medium on CFR-PEEK (A2) and G-CFR-PEEK (A4) scaffolds for 7 days (n=3). (B) Stereomicroscopy of alizarin red S staining of mineralized bone cultured with osteoinductive medium on CFR-PEEK (B1) and G-CFR-PEEK (B3) scaffolds at 21 days. Alizarin red S staining of mineralized bone on CFR-PEEK (B2) and G-CFR-PEEK (B4) scaffolds at 28 days. (C) ALP activity of G-CFR-PEEK and CFR-PEEK scaffolds at 4 and 7 days (n=3). Results presented as means ± SD. **P<0.01. Scale bars 500 μm. |
Osteogenic differentiation was also assessed by Western blot analysis of the osteogenesis-related proteins Col1A1, Runx2, BMP2, and Osx (Figure 7). BMSCs on G-CFR-PEEK scaffolds expressed higher levels of Col1A1, Runx2, and Osx than cells on CFR-PEEK scaffolds after 7 and 14 days’ culture in osteogenic induction media (P<0.05). Cells on CFR-PEEK scaffolds expressed slightly higher levels of BMP2 than cells on G-CFR-PEEK scaffolds at day 14, though this difference was not significant. Taken together, these results indicated surface modification with graphene effectively stimulated the osteogenic differentiation of BMSCs seeded on CFR-PEEK scaffolds.
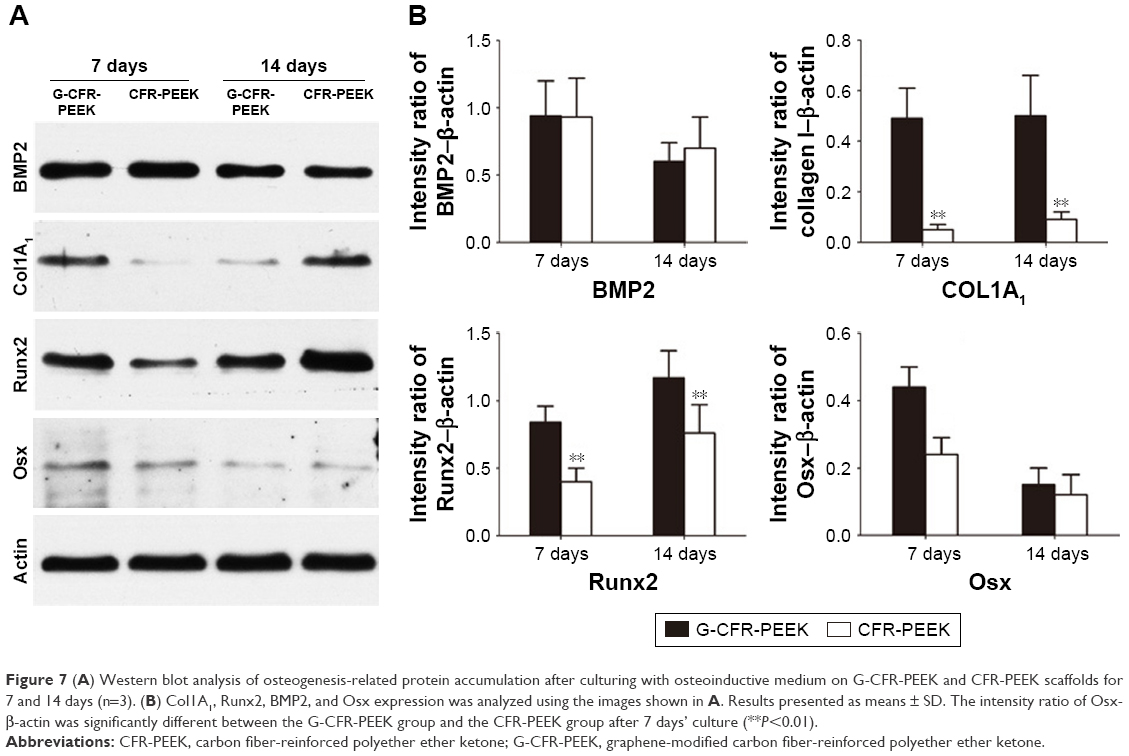 | Figure 7 (A) Western blot analysis of osteogenesis-related protein accumulation after culturing with osteoinductive medium on G-CFR-PEEK and CFR-PEEK scaffolds for 7 and 14 days (n=3). (B) Col1A1, Runx2, BMP2, and Osx expression was analyzed using the images shown in A. Results presented as means ± SD. The intensity ratio of Osx-β-actin was significantly different between the G-CFR-PEEK group and the CFR-PEEK group after 7 days’ culture (**P<0.01). |
Microcomputed tomography analysis of implanted scaffolds
The implants (white; Figure 8) and newly formed bone tissue (yellow) in identically sized regions of interest were reconstructed using 3D stereoscopic images. At all time points after implantation, there was more bone trabecula around implanted G-CFR-PEEK scaffolds than CFR-PEEK scaffolds. The microstructural parameters are summarized in Figure 8. At 4 weeks after implantation, G-CFR-PEEK implants had higher BV/TV and TbTh values (0.32±0.01 and 0.17±0.05, respectively) than the CFR-PEEK implants (0.22±0.02 and 0.11±0.03, respectively; P<0.05). BS/BV was lower for G-CFR-PEEK implants (12.21%±3.16%) than CFR-PEEK implants (18.85%±5.59%, P<0.05). BV/TV values of G-CFR-PEEK implants (0.34±0.02) were significantly higher than CFR-PEEK implants (0.26±0.01, P<0.05) at 8 weeks after implantation. However, BV/TV, BS/BV, TbTh, TbSp, and TbN were not significantly different between G-CFR-PEEK implants and CFR-PEEK implants at 12 weeks after implantation.
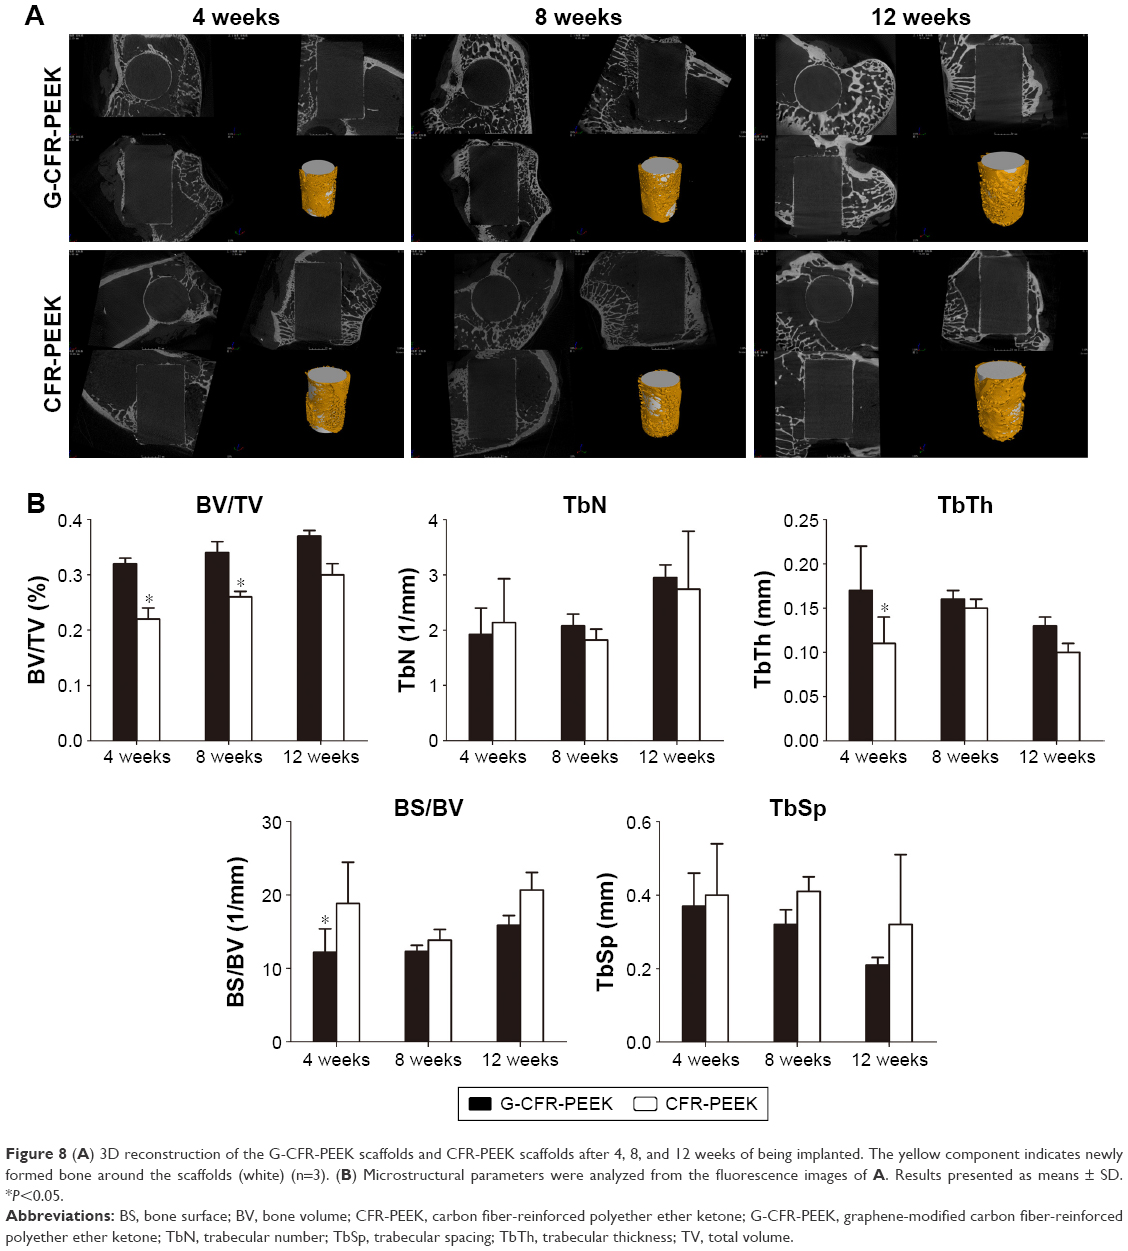 | Figure 8 (A) 3D reconstruction of the G-CFR-PEEK scaffolds and CFR-PEEK scaffolds after 4, 8, and 12 weeks of being implanted. The yellow component indicates newly formed bone around the scaffolds (white) (n=3). (B) Microstructural parameters were analyzed from the fluorescence images of A. Results presented as means ± SD. *P<0.05. |
Biomechanical testing
As shown in Figure 9, the maximum failure load for both G-CFR-PEEK and G-CFR-PEEK scaffold implants increased from implantation. Moreover, the maximum failure load of G-CFR-PEEK implants was greater than that of CFR-PEEK implants at 4 weeks (3.37±0.11 vs 2.33±0.10 MPa; P<0.05) and 8 weeks (3.92±0.18 vs 3.25±0.09 MPa; P<0.05), and although the strength of the G-CFR-PEEK implants was greater than CFR-PEEK implants at 12 weeks, this difference was not significant (P>0.05).
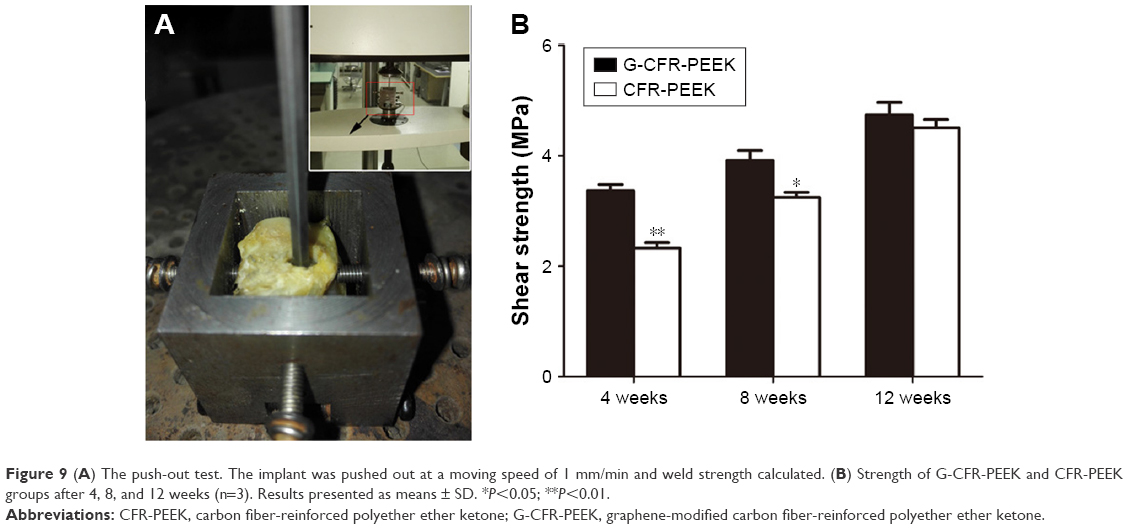 | Figure 9 (A) The push-out test. The implant was pushed out at a moving speed of 1 mm/min and weld strength calculated. (B) Strength of G-CFR-PEEK and CFR-PEEK groups after 4, 8, and 12 weeks (n=3). Results presented as means ± SD. *P<0.05; **P<0.01. |
Histological analysis
Fluorescence staining using tetracycline labeling (yellow bands) and calcein labeling (green bands) and stereomicroscopy were used to assess new bone formation around the implants at 4 weeks after implantation (Figure 10). MAR determined from the distance between the centers of the yellow and green bands was significantly greater for G-CFR-PEEK implants (3.57±0.18 μm/day) than CFR-PEEK implants (2.11±0.11 μm/d; P<0.05). In addition, the newly formed bone was observed to make contact with the implant at the bone–implant interface for G-CFR-PEEK scaffolds but not on CFR-PEEK scaffolds.
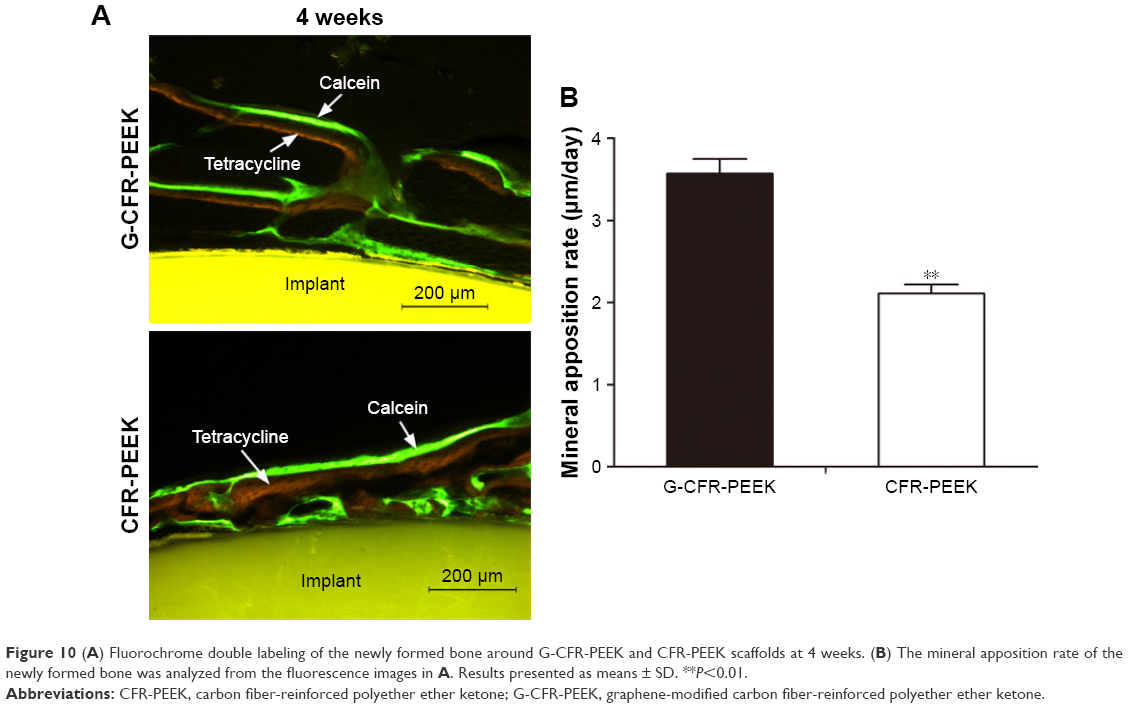 | Figure 10 (A) Fluorochrome double labeling of the newly formed bone around G-CFR-PEEK and CFR-PEEK scaffolds at 4 weeks. (B) The mineral apposition rate of the newly formed bone was analyzed from the fluorescence images in A. Results presented as means ± SD. **P<0.01. |
van Gieson staining of hard tissue sections was used to assess osseointegration of G-CFR-PEEK and CFR-PEEK implants at 4, 8, and 12 weeks after implantation (Figure 11). After 4 weeks, the newly formed bone on G-CFR-PEEK implants was continuous and bonded tightly to the implant surface, whereas new bone was sparsely distributed around CFR-PEEK implants. The new bone area rate and bone:implant contact ratio were significantly higher for G-CFR-PEEK implants (30.1%±1.7% and 74.7%±4.7%, respectively) than CFR-PEEK implants (23.1%±1.9% and 63.3%±6.5%, respectively; P<0.05), indicating graphene promoted early stage bone–implant osseointegration. At 8 weeks postimplantation, larger new bone area and bone–implant contact were observed for G-CFR-PEEK implants (31.9%±2.0% and 83.6%±5.3%, respectively) than CFR-PEEK implants (27.3%±3.3% and 73.8%±7.2%, respectively; P<0.05). Moreover, there was a significantly greater amount of soft tissue between newly formed bone and the CFR-PEEK implants than the G-CFR-PEEK implants. By 12 weeks after implantation, the volume of newly formed bone around the G-CFR-PEEK scaffolds had increased to form a continuous, thick-bone layer, indicating better osseointegration. In contrast, osseointegration was weaker between the CFR-PEEK implants and newly formed bone. However, while the new bone area rate and bone:implant contact ratio were higher for G-CFR-PEEK implants than CFR-PEEK implants at 12 weeks, these differences were not significant (P>0.05). Tissue inflammation and necrosis, which are signs of abnormal metabolism or toxic effects, were not observed for either the G-CFR-PEEK or the CFR-PEEK scaffolds at any time points.
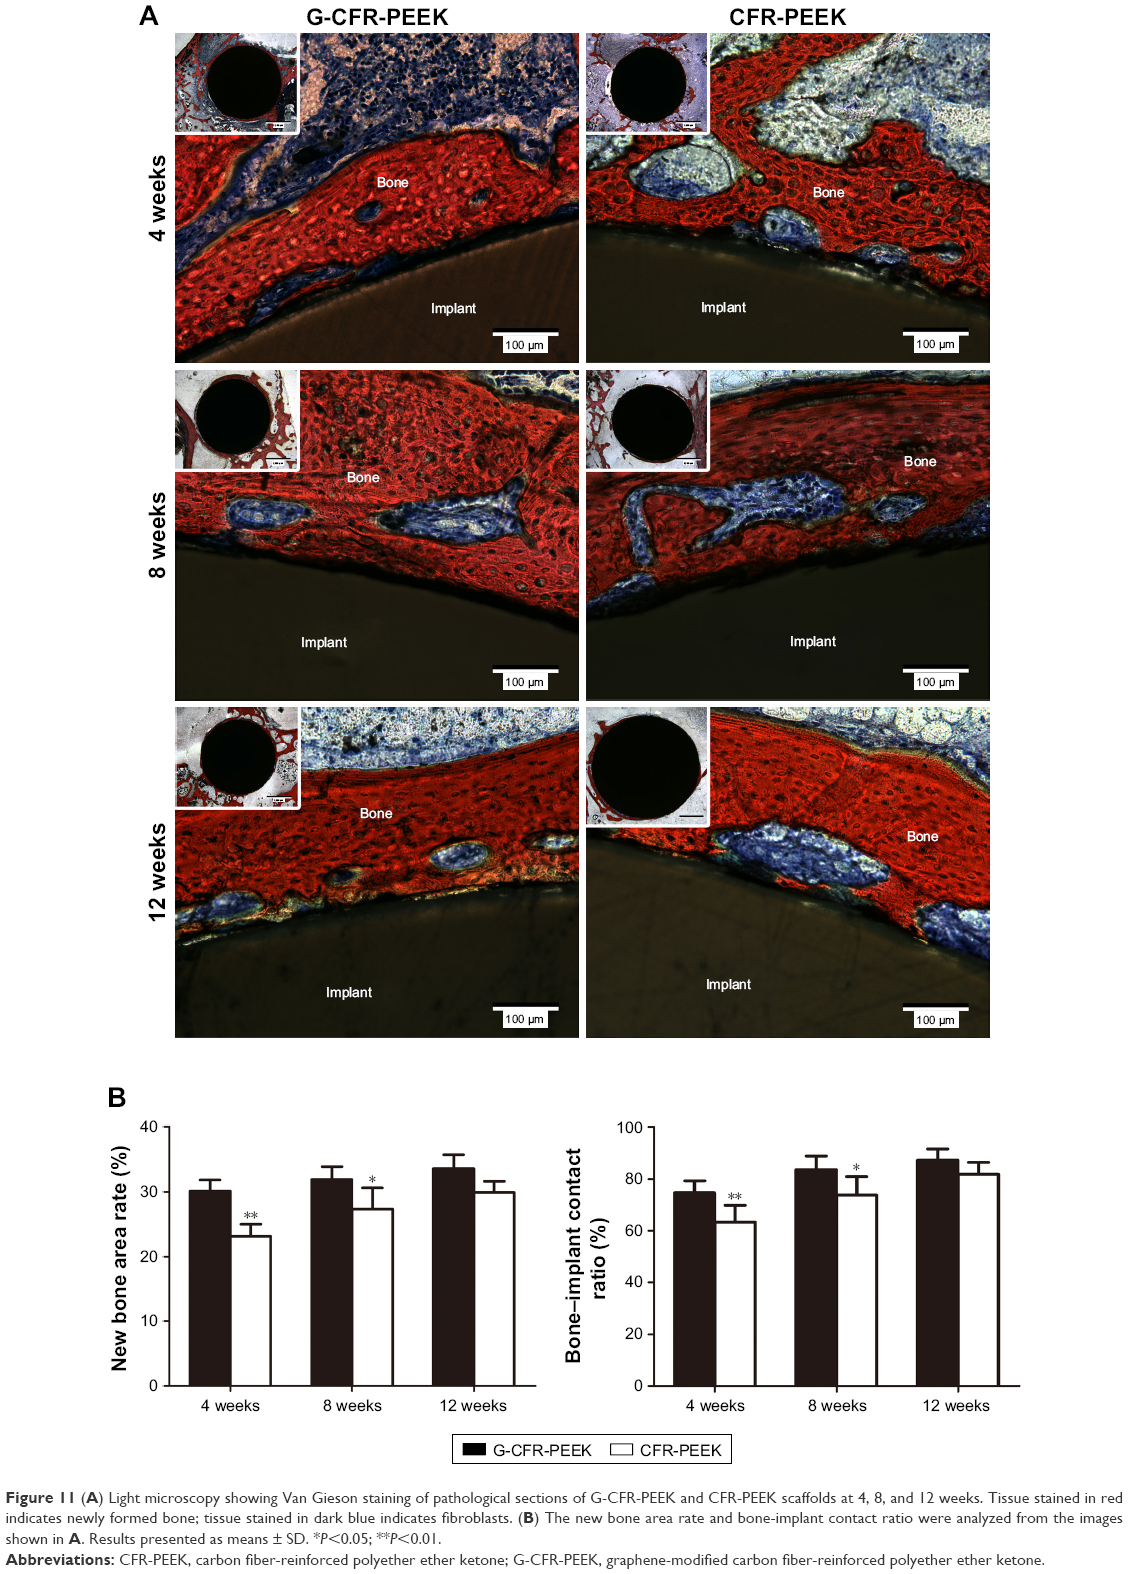 | Figure 11 (A) Light microscopy showing Van Gieson staining of pathological sections of G-CFR-PEEK and CFR-PEEK scaffolds at 4, 8, and 12 weeks. Tissue stained in red indicates newly formed bone; tissue stained in dark blue indicates fibroblasts. (B) The new bone area rate and bone-implant contact ratio were analyzed from the images shown in A. Results presented as means ± SD. *P<0.05; **P<0.01. |
Discussion
CFR-PEEK can be adjusted during manufacture to match the modulus of both cortical and cancellous bone, can be sterilized using γ-rays, and can be visualized using X-rays when implanted. Therefore, CFR-PEEK has the potential to overcome the risks of bone resorption caused by stress shielding as a result of the mismatch in elasticity between traditional metallic implants and human bone.9,19 CFR-PEEK has been used in spinal cages, bone fixation screws, and orthopedic implants and has potential as a new bulk material for total joint replacement.20,21 However, osseointegration between CFR-PEEK scaffolds and adjacent bone tissue is impeded by the bioinert nature and inferior osteogenic properties of CFR-PEEK. Graphene has been shown to exhibit unique physiochemical and structural properties, most notably osteogenic potential toward human mesenchymal stem cells, indicating surface modification of scaffold materials with graphene could be a promising approach to improve bone-tissue engineering.22,23 The objective of this study was to investigate whether surface modification with graphene enhanced the bioactivity and osteogenic activity of CFR-PEEK. We demonstrated graphene could be stably coated onto the surface of CFR-PEEK, and that graphene enhanced the proliferation and osteogenic differentiation of BMSCs in vitro and improved osseointegration in vivo. As far as we know, this article is the first to demonstrate enhanced bioactivity of CFR-PEEK via graphene modification. These novel results demonstrate graphene modification enhances the bioactivity of CFR-PEEK, and we propose G-CFR-PEEK may have potential as an implant material for clinical application.
Graphene films synthesized on a large scale via chemical vapor deposition can be transferred to any foreign substrate, regardless of substrate shape or material.24 In a previous study, we demonstrated graphene could be stably coated onto the surface of an artificial polyethylene terephthalate-based ligament.17 We successfully coated graphene films onto the surface of CFR-PEEK. We subsequently used ultrasound with a wave of frequency of 25 kHz and power of 200 W to demonstrate the graphene films were stably coated on the surface of CFR-PEEK. Graphene has a large interface, which results in larger effective surface areas and load-transfer sites for cell attachment. Gittens et al reported that the increased hydrophilicity directly enhanced initial protein interactions, thus facilitating initial cellular attachment, in addition to cell proliferation and differentiation.25 Also, it has been demonstrated that the nanotopography, ripples, wrinkles, higher surface area, surface roughness, and hydrophilicity increase in graphene are critical parameters in promoting the proliferation and osteogenic differentiation of BMSCs.23 Moreover, we found graphene modification increased hydrophilicity (lower water-contact angle) of the CFR-PEEK scaffolds.
SEM demonstrated BMSCs on G-CFR-PEEK scaffolds had elongated, spindle-like morphology and were well distributed, in contrast to the smoother-edged, more circular undeveloped morphology of cells on CFR-PEEK scaffolds. Immunoassays demonstrated the graphene coating enhanced cytoskeletal development at 1 and 3 days after seeding. Similarly, in previous reports, graphene increased the expression of adherence proteins, such as vinculin, on cells seeded on scaffolds; this effect was attributed to improved cell attachment rates.26 Cell proliferation analysis using the CCK8 assay and FDA and PI staining further confirmed graphene enhanced the biocompatibility of the CFR-PEEK scaffolds. These results are consistent with the enhanced cell proliferation observed on the graphene-modified scaffolds.
Furthermore, increased cell spread and better cell attachment have been suggested to be beneficial for osteogenic differentiation of BMSCs and can result in better osteoconduction and osteoinduction.27 Although cell adhesion and proliferation are required for new bone formation, the osteoinductive capacity of the scaffold is essential to initiate bone formation processes and enhance osteogenic differentiation of BMSCs. BMSC osteogenic differentiation was qualitatively and quantitatively evaluated by measuring ALP expression and activity, ECM mineralization, and osteogenesis-related protein accumulation in vitro. ALP is an early marker of osteogenesis and its activity declines as the matrix matures, whereas ECM mineralization is a late-stage indicator of osteogenesis in BMSCs. Graphene coating significantly enhanced the ALP activity of BMSCs on G-CFR-PEEK scaffolds; this trend became more significant at 7 days after seeding. Western blotting of the osteogenic-related proteins BMP2, Col1A1, Runx2, and Osx further confirmed that graphene modification enhanced osteogenic differentiation. Graphene modification increased Col1A1, Runx2, and Osx expressed by BMSCs on CFR-PEEK after 7 and 14 days’ culture in induction media. Conversely, graphene modification led to lower accumulation of BMP2 at day 14, although this effect was not significant. The lower accumulation of BMP2 on G-CFR-PEEK scaffolds may have occurred because graphene can enhance the differentiation of BMSCs similarly to cells cultured in the presence of BMP2, as previously demonstrated.28 This mechanism may possibly explain the beneficial effects of graphene on the osteogenic differentiation of BMSCs. Additionally, the topography, chemistry, and physical properties of graphene are critical parameters that have been shown to promote the proliferation and osteogenic differentiation of BMSCs.23 Yan et al found graphene–single-walled carbon nanotube hybrids promoted osteogenic differentiation of rat BMSCs by activating the p38-signaling pathway and inhibiting the ERK1/2-signaling pathway.29 However, the precise mechanisms underlying the enhanced osteogenic differentiation of BMSCs on graphene remain unclear and require further study.
Previous studies have suggested nanostructured and microrough topographies of the scaffolds may also mediate osteogenic differentiation.30 The G-CFR-PEEK scaffolds (Figure 1) had numerous micrometer-scale ripples and wrinkles, whereas the surface of the CFR-PEEK samples contained larger valleys. We confirmed that the ripples and wrinkles present in large-scale graphene were able to promote protein adsorption and cell adhesion, proliferation, and differentiation in vitro and further enhance osseointegration in vivo, as previously described.28 In addition, graphene surface modification of the implant interface may enhance osseointegration by better mimicking the hierarchical structure and nanoscale surface features of bone in vivo.14,31 These factors may explain why a larger mass of bone tissue and accelerated osseointegration were observed around the G-CFR-PEEK implants in vivo.
As various factors affect the bone regeneration process in the complex bone microenvironment, a rabbit femur-condyle implantation model was adopted to evaluate the effect of graphene on the osseointegration of CFR-PEEK implants in vivo. Graphene modification increased BV/TV, especially at 4 weeks after implantation, demonstrating graphene enhanced the generation of newly formed bone and osseointegration at the bone–implant interface. The direct contact observed between new bone and G-CFR-PEEK scaffolds via histological analysis indicated graphene coating led to superior osteoinduction and osseointegration. In contrast, fibrous tissue formation was obvious around the uncoated CRF-PEEK implants. Quantitative data confirmed the graphene surface modification positively increased bone apposition and ingrowth response.14 At 4 and 8 weeks after implantation, the graphene coating led to significantly higher shear strength, indicating graphene modification had potentially increased the stability of the bone–implant interface. Furthermore, MAR values indicated graphene significantly increased new bone growth around the CFR-PEEK scaffolds. The ability of graphene to promote faster, stabler osseointegration of CFR-PEEK scaffolds may contribute to better long-term performance and thus extend the lifetime of bone implants.25
Conclusion
Graphene was stably coated onto the surface of CFR-PEEK. In vitro and in vivo experiments indicated G-CFR-PEEK exhibited satisfactory cytocompatibility and promoted osteogenesis. G-CFR-PEEK was obtained from catalytic metal films in this study. With further improvements in graphene synthesis, future studies should investigate the feasibility of growing graphene directly on the surface of CFR-PEEK. In addition, additional studies are required to elucidate the precise mechanisms underlying the ability of graphene modification to improve the surface bioactivity and osteogenic potential of CFR-PEEK implants.
Acknowledgments
We thank Dr Fei Pang from Renmin University, Beijing, China for assistance with preparation of the G-CFR-PEEK scaffolds. This project was funded by the State Key Project of Research and Development (2016YFC1100300) and the National Natural Science Foundation of China (81371932 and 81672189).
Disclosure
The authors report no conflicts of interest in this work.
References
Gentleman E, Swain RJ, Evans ND, et al. Comparative materials differences revealed in engineered bone as a function of cell-specific differentiation. Nat Mater. 2009;8:763–770. | ||
Aziz-Kerrzo M, Conroy KG, Fenelon AM, Farrell ST, Breslin CB. Electrochemical studies on the stability and corrosion resistance of titanium-based implant materials. Biomaterials. 2001;22:1531–1539. | ||
Wang XJ, Xu SQ, Zhou SW, et al. Topological design and additive manufacturing of porous metals for bone scaffolds and orthopaedic implants: a review. Biomaterials. 2016;83:127–141. | ||
Huiskes R, Weinans H, van Rietbergen B. The relationship between stress shielding and bone resorption around total hip stems and the effects of flexible materials. Clin Orthop Relat Res. 1992;274:124–134. | ||
Colquhoun R, Tanner KE. Mechanical behaviour of degradable phosphate glass fibres and composites: a review. Biomed Mater. 2015;11:014105. | ||
Ramakrishna S, Mayer J, Wintermantel E, Leong KW. Biomedical applications of polymer-composite materials: a review. Compos Sci Technol. 2001;61:1189–1224. | ||
Toth JM, Wang M, Estes BT, Scifert JL, Seim HB, Turner AS. Polyetheretherketone as a biomaterial for spinal applications. Biomaterials. 2006;27:324–334. | ||
Godara A, Raabe D, Green S. The influence of sterilization processes on the micromechanical properties of carbon fiber-reinforced PEEK composites for bone implant applications. Acta Biomater. 2007;3:209–220. | ||
Invibio Ltd. PEEK-OPTIMA™ Natural. Available from: https://invibio.com/materials/peek-optima-natural. Accessed May 23, 2018. | ||
Ma R, Tang T. Current strategies to improve the bioactivity of PEEK. Int J Mol Sci. 2014;15:5426–5445. | ||
Wu X, Liu X, Wei J, Ma J, Deng F, Wei S. Nano-TiO2/PEEK bioactive composite as a bone substitute material: in vitro and in vivo studies. Int J Nanomedicine. 2012;7:1215–1225. | ||
Wang Q, Xue Q, Shen W, Zhang J. The friction and wear properties of nanometer ZrO2-filled polyetheretherketone. J Appl Polym Sci. 1998;69:135–141. | ||
Deng Y, Liu X, Xu A, et al. Effect of surface roughness on osteogenesis in vitro and osseointegration in vivo of carbon fiber-reinforced polyetheretherketone-nanohydroxyapatite composite. Int J Nanomedicine. 2015;10:1425–1447. | ||
Lu T, Wen J, Qian S, et al. Enhanced osteointegration on tantalum-implanted polyetheretherketone surface with bone-like elastic modulus. Biomaterials. 2015;51:173–183. | ||
Geim AK. Graphene: status and prospects. Science. 2009;324:1530–1534. | ||
Kalbacova M, Broz A, Kong J, Kalbac M. Graphene substrates promote adherence of human osteoblasts and mesenchymal stromal cells. Carbon N Y. 2010;48:4323–4329. | ||
Wang CH, Guo ZS, Pang F, et al. Effects of graphene modification on the bioactivation of polyethylene-terephthalate-based artificial ligaments. ACS Appl Mater Interfaces. 2015;7:15263–15276. | ||
Li X, Cai W, An J, et al. Large-area synthesis of high-quality and uniform graphene films on copper foils. Science. 2009;324:1312–1314. | ||
Kurtz SM, Devine JN. PEEK biomaterials in trauma orthopedic and spinal implants. Biomaterials. 2007;28:4845–4869. | ||
Li CS, Vannabouathong C, Sprague S, Bhandari M. The use of carbon-fiber-reinforced (CFR) PEEK Material in orthopedic implants: a systematic review. Clin Med Insights Arthritis Musculoskelet Disord. 2015;8:33–45. | ||
Sonntag R, Reinders J, Kretzer JP. What’s next? Alternative materials for articulation in total joint replacement. Acta Biomater. 2012;8:2434–2441. | ||
Wei W, Qu X. Extraordinary physical properties of functionalized graphene. Small. 2012;8:2138–2151. | ||
Gu M, Liu Y, Chen T, et al. Is graphene a promising nano-material for promoting surface modification of implants or scaffold materials in bone tissue engineering? Tissue Eng Part B Rev. 2014;20:477–491. | ||
Reina A, Jia X, Ho J, et al. Large area few-layer graphene films on arbitrary substrates by chemical vapor deposition. Nano Lett. 2009;9:30–35. | ||
Gittens RA, Scheideler L, Rupp F, et al. A review on the wettability of dental implant surfaces II: biological and clinical aspects. Acta Biomater. 2014;10:2907–2918. | ||
Shi X, Chang H, Chen S, Lai C, Khademhosseini A, Wu H. Regulating cellular behavior on few-layer reduced graphene oxide films with well-controlled reduction states. Adv Funct Mater. 2012;22:751–759. | ||
Civitelli R. Cell-cell communication in the osteoblast/osteocyte lineage. Arch Biochem Biophys. 2008;473:188–192. | ||
Nayak TR, Andersen H, Makam VS, et al. Graphene for controlled and accelerated osteogenic differentiation of human mesenchymal stem cells. ACS Nano. 2011;5:4670–4678. | ||
Yan X, Wen Y, Shao Z, et al. Graphene/single-walled carbon nanotube hybrids promoting osteogenic differentiation of mesenchymal stem cells by activating p38 signaling pathway. Int J Nanomedicine. 2016;11:5473–5484. | ||
Oh S, Brammer KS, Li YS, et al. Stem cell fate dictated solely by altered nanotube dimension. Proc Natl Acad Sci U S A. 2009;106:2130–2135. | ||
Xu A, Liu X, Gao X, Deng F, Deng Y, Wei S. Enhancement of osteogenesis on micro/nano-topographical carbon fiber-reinforced polyetheretherketone-nanohydroxyapatite biocomposite. Mater Sci Eng C Mater Biol Appl. 2015;48:592–598. |
 © 2018 The Author(s). This work is published and licensed by Dove Medical Press Limited. The
full terms of this license are available at https://www.dovepress.com/terms
and incorporate the Creative Commons Attribution
- Non Commercial (unported, 3.0) License.
By accessing the work you hereby accept the Terms. Non-commercial uses of the work are permitted
without any further permission from Dove Medical Press Limited, provided the work is properly
attributed. For permission for commercial use of this work, please see paragraphs 4.2 and 5 of our Terms.
© 2018 The Author(s). This work is published and licensed by Dove Medical Press Limited. The
full terms of this license are available at https://www.dovepress.com/terms
and incorporate the Creative Commons Attribution
- Non Commercial (unported, 3.0) License.
By accessing the work you hereby accept the Terms. Non-commercial uses of the work are permitted
without any further permission from Dove Medical Press Limited, provided the work is properly
attributed. For permission for commercial use of this work, please see paragraphs 4.2 and 5 of our Terms.