")
Back to Journals » International Journal of Nanomedicine » Volume 9 » Issue 1
Enhanced uptake and transport of (+)-catechin and (-)-epigallocatechin gallate in niosomal formulation by human intestinal Caco-2 cells
Authors Song Q, Li D, Zhou Y, Yang J, Yang W, Zhou G, Wen J
Received 17 December 2013
Accepted for publication 15 February 2014
Published 8 May 2014 Volume 2014:9(1) Pages 2157—2165
DOI https://doi.org/10.2147/IJN.S59331
Checked for plagiarism Yes
Review by Single anonymous peer review
Peer reviewer comments 2
Qinxin Song,1–3 Danhui Li,3 Yongzhi Zhou,3 Jie Yang,1 Wanqi Yang,1 Guohua Zhou,2 Jingyuan Wen3
1Key Laboratory of Drug Quality Control and Pharmacovigilance, Ministry of Education, School of Pharmacy, China Pharmaceutical University, 2Department of Pharmacology, Jinling Hospital, Nanjing University School of Medicine, Nanjing, People’s Republic of China; 3School of Pharmacy, Faculty of Medical and Health Sciences, University of Auckland, Auckland, New Zealand
Abstract: The aim of this study was to evaluate (+)-catechin and (−)-epigallocatechin gallate (EGCG) cellular uptake and transport across human intestinal Caco-2 cell monolayer in both the absence and presence of niosomal carrier in variable conditions. The effect of free drugs and drug-loaded niosomes on the growth of Caco-2 cells was studied. The effects of time, temperature, and concentration on drug cellular uptake in the absence or presence of its niosomal delivery systems were investigated. The intestinal epithelial membrane transport of the drug-loaded niosomes was examined using the monolayer of the human Caco-2 cells. The kinetics of transport, and the effect of temperature, adenosine triphosphate inhibitor, permeability glycoprotein inhibitor, multidrug resistance-associated protein 2 inhibitor, and the absorption enhancer on transport mechanism were investigated. It was found that the uptake of catechin, EGCG, and their niosomes by Caco-2 cells was 1.22±0.16, 0.90±0.14, 3.25±0.37, and 1.92±0.22 µg/mg protein, respectively (n=3). The apparent permeability coefficient values of catechin, EGCG, and their niosomes were 1.68±0.16, 0.88±0.09, 2.39±0.31, and 1.42±0.24 cm/second (n=3) at 37°C, respectively. The transport was temperature- and energy-dependent. The inhibitors of permeability glycoprotein and multidrug resistance-associated protein 2 and the absorption enhancer significantly enhanced the uptake amount. Compared with the free drugs, niosomal formulation significantly enhanced drug absorption. Additionally, drug-loaded niosomes exhibited stronger stability and lower toxicity. These findings showed that the oral absorption of tea flavonoids could be improved by using the novel drug delivery systems.
Keywords: niosomes, formulation, bioavailability, stability
Introduction
(+)-Catechin and (−)-epigallocatechin gallate (EGCG) (Figure 1) are two main kinds of tea flavonoids that are suggested to have demonstrated various health-beneficial activities, including antioxidant, antitumor, and anti-inflammatory, in vitro and in vivo.1–4 As a result, catechin and EGCG have attracted the interest of researchers and manufacturers, and these natural molecules are considered to be promising drug candidates in the pharmaceutical, cosmetic, and nutritional fields. They have already been used in the food industry as natural additives and have been applied in cosmetic products as antiaging components. However, both derivatives have poor stability and poor oral bioavailability.5 The octanol/buffer partition coefficients P of catechin and EGCG are 2.92±0.35 and 0.86±0.03, respectively. Both of them have high hydrophilicity and have difficulty penetrating the cell membrane. Maximum catechin plasma concentration was shown to be achieved 2 hours after consumption, and this was followed by rapid clearance.6,7 Two factors considered to be contributing to the limited oral bioavailability are sensitivity of catechin to the digestive system and absorption barriers in the human gastrointestinal tract; both are factors in the overall very poor intrinsic permeability of catechin and EGCG across intestinal epithelium.8 Using formulation strategy to encapsulate these sensitive compounds is considered one feasible approach to combat both the sensitivity and barrier issues, as encapsulation is found to be effective in improving oral bioavailability and prolonging shelf-life.9,10
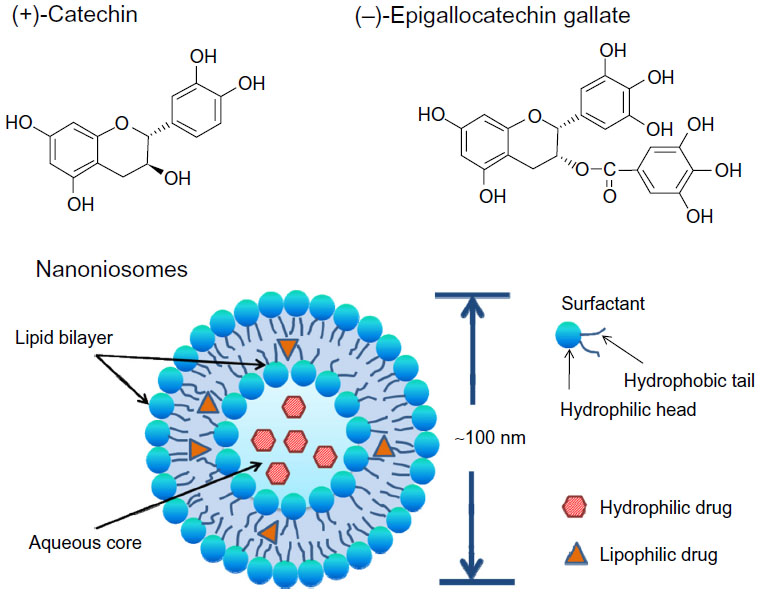 | Figure 1 Chemical structures of two kinds of tea flavonoid drugs: (+)-catechin and (−)-epigallocatechin gallate, and a typical structure of niosomes. |
In order to overcome both enzymatic degradation and membrane permeation problems, the formulation of catechin and EGCG in oral delivery systems has been approached from various angles to enhance its oral bioavailability, including the use of absorption enhancers, enzymatic inhibitors, and advanced drug carrier systems.
A niosome (Figure 1) is a kind of novel vesicular system with a bilayer containing nonionic surfactants and cholesterol (CH). Nonionic surfactants are comprised of polar and nonpolar segments. Surfactant molecules possess high interfacial activity, which upon hydration form a bilayer structure and hence entrap both hydrophilic and hydrophobic drugs. The advantages of niosomes include biodegradability, biocompatibility, and they are nontoxic; they exhibit good stability and niosomal carriers deliver drugs to the target site in a controlled or sustained manner that enhances bioavailability.11
In this paper, the Caco-2 cell monolayer model, a well-accepted model of human intestinal absorption,12 was used to study the transport mechanism of the drug-loaded niosomes of catechin and EGCG. The stability, cytotoxicity, uptake, and the effects of factors such as time, drug concentration, temperature, inhibitor, and enhancer on transport were also investigated. The results may give a better understanding of the mechanism of cellular uptake and epithelial transport of the drug-loaded niosomes.
Materials and methods
Chemicals and reagents
Catechin, EGCG, sorbitan monostearate (Span 60), CH, dihexadecyl phosphate, fluorescein isothiocyanate (FITC), sulforhodamine B (SRB), fluorescein sodium salt, ascorbic acid (AA), sodium azide, verapamil, 5-(3-(2-(7-chloroquinolin-2-yl)ethenyl)phenyl)-8-dimethylcarbamyl-4,6-dithiaoctanoic acid sodium salt hydrate (MK-571), and ethylenediaminetetraacetic acid (EDTA) were purchased from Sigma-Aldrich (St Louis, MO, USA). Methanol of analytical reagent grade was purchased from Merck (Merck KGaA, Darmstadt, Germany). Trifluoroacetic acid was purchased from Fluka (Fluka, Milwaukee, WI, USA). Dulbecco’s Modified Eagles’s Medium (DMEM), fetal calf serum, penicillin-streptomycin-glutamine, nonessential amino acids, trypsin-EDTA, and Hank’s balanced salt solution (HBSS) buffer (pH 7.4) were purchased from Life Technologies (Carlsbad, CA, USA). Milli-Q® water (Millipore Corp, Billerica, MA, USA) was available from the Pharmaceutics Laboratory at University of Auckland (Auckland, New Zealand).
High-performance liquid chromatography
An HP 1200 series high-performance liquid chromatography (HPLC) system equipped with a diode array detector was used (Agilent Technologies, Santa Clara, CA, USA). Chromatography was performed on a Jupiter C18 column (250 × 4.6 mm, 5 μm; Phenomenex, Torrance, CA, USA) fitted with a C18 guard column (10 × 3.0 mm) by using a mobile phase containing 0.1% trifluoroacetic acid in Milli-Q water (pH 2.0), mixed with methanol at the volume ratio of 75:25, at a flow rate of 1.0 mL/minute, according to our previous research.11 All samples were analyzed at the UV wavelength of 280 nm using an injection volume of 20 μL at 25°C.13
Encapsulation of catechin and EGCG in niosomes
Catechin-/EGCG-niosomes were prepared by the thin film hydration method reported by Li et al.13 Predetermined amounts of Span 60 and CH were dissolved in organic solvent in a round bottom flask. Organic solvent was evaporated (Buchi Rotavapor R-215; Flawil, Switzerland) to form a thin film.14 Medium containing drug was added to hydrate the film. The obtained catechin-/EGCG-niosomes were used in the following uptake and transport studies.
Characterization of drug-loaded niosomes
The size and morphology of niosomes were also determined by negative staining-transmission electron microscopy. After niosomes were negatively stained, their size and morphology were observed using a TecnaiTM G2 Spirit Twin transmission electron microscope (FEI, Hillsboro, OR, USA). Ultracentrifugation was adopted for the separation of free and entrapped drug. The niosomal suspension was ultracentrifuged at 20,000 rpm at 4°C for 1 hour in an ultracentrifuge (Sorvall WX Ultra 80; Thermo Fisher Scientific, Waltham, MA, USA) in order to separate the incorporated drug from the free form. The precipitate of niosomes was dissolved in 20% Triton X-100 in methanol. The drugs in the supernatant and precipitate were analyzed by HPLC to determine the encapsulation percentage. The entrapment capacity of niosomes were calculated as,

where T is the total amount of drug that is detected both in the supernatant and sediment, and C is the amount of drug detected only in the supernatant.
Cell culture
The Caco-2 cell line was obtained from the American Type Culture Collection (Manassas, VA, USA). Cells were routinely maintained in complete DMEM medium in T-75 tissue culture flasks at 37°C in an atmosphere of 5% CO2 and 95% relative humidity. Complete DMEM medium was prepared by adding 10% fetal calf serum, 1% penicillin-streptomycin-glutamine, and 1% nonessential amino acids to sterile DMEM. Culture medium was changed every 2 days until cells grew to 90% confluence.
Stability of catechin and EGCG in HBSS and Caco-2 cells
According to the literature, the chemical stability of both catechin and EGCG is pH-dependent.15 The two catechin derivatives underwent extensive degradation when subjected to the basic conditions and around 30% degradation after 1 hour exposure while they were quite stable under acidic condition when only 10% of the drug was decomposed, respectively, after 7 days. Thus, in this experiment, many reducing agents, such as AA, dithiothreitol, and Tris (2-carboxyethyl) phosphine, were used to provide protection. Aliquots of the incubated solution containing different concentrations of AA were periodically sampled and assayed for catechin or EGCG using the validated stability in pH 7.4 HBSS buffer and in Caco-2 cells by HPLC assay.9
Effect of drug and drug-loaded niosomes on cellular uptake
In the uptake studies, Caco-2 cells were seeded onto 60 mm plastic dishes (Corning, Corning, NY, USA) and fed fresh complete DMEM every 2 days. To determine the drug uptake behavior of the cells, catechin and EGCG were conjugated with FITC, and the marked drugs were analyzed by fluorescein spectrophotometer.16 The conjugated catechin (FITC-C) and EGCG (FITC-EGCG) were encapsulated in the niosomal formulation prepared by the above method. The cells were treated with FITC-C, FITC-EGCG, and their niosomes for 6 hours. At the indicated times, the medium was aspirated, and the dishes were rapidly rinsed five times with 5 mL of ice-cold HBSS. The cells were scraped off into 1.0 mL lysis medium (20% Triton X-100 in methanol) and were digested for 1 hour at room temperature. Twenty μL of the cell lysates were used to determine the total cell protein content using bicinchoninic acid (BCA) method with a Pierce BCA protein assay kit (Thermo Fisher Scientific).17 The final wash medium was determined to contain no residual catechin or EGCG, and the remainder of the cell lysates was subjected to quantitative measurement by using a fluorescein spectrophotometer (PerkinElmer, Waltham, MA, USA) (excitation wavelength 495, emission wavelength 525 nm). The amount of catechin and EGCG was calculated from the calibration curve. The extent of uptake was expressed as the amount of catechin and EGCG (μg) taken up per mg cell protein (μg/mg protein).18
Time-, concentration-, and temperature-dependent uptake studies were carried out with FITC-C, FITC-EGCG, and their niosomes. Time-dependent uptake experiments were performed with 100 μg/mL of various drugs at 37°C for 6 hours. For concentration-dependent studies, cells were incubated with the drug suspensions at specified concentrations (0–150 μg/mL) at 37°C for 6 hours. To determine the effect of temperature, cells were incubated with the drugs at a concentration of 100 μg/mL at 4°C and 37°C for 6 hours. All experiments were repeated three times.19
Drug transport studies in the absence or presence of niosomal delivery system
Preparation of Caco-2 monolayers
Caco-2 cells were grown as epithelial monolayers by seeding cells onto the transwell inserts (4.2 cm2) with a pore size of 400 nm at a density of 1.0 × 10⁵ cells/insert and incubated at 37°C in an atmosphere of 5% CO2 and 95% relative humidity in complete DMEM. The medium was replaced every 2 days with 1.5 mL medium in the apical (AP) side and 2.5 mL in the basolateral (BL) side. The integrity of the cell monolayer was assessed by testing both transepithelial electrical resistance (TEER) and passage of the fluorescein sodium salt.
To measure TEER, the chopstick-like electrodes were sterilized by immersion in 70% ethanol for 15 minutes and air-dried for 15 seconds. The sterile electrodes were then immersed in sterile phosphate buffered saline (PBS) to equilibrate for 15 minutes. The Millicell-ERS system (Millipore Corp) was adjusted by setting the voltage meter to 0. When measuring the TEER values of monolayers, the electrodes were carefully immersed in the culture medium of the transwell system, with the short electrode in the AP side and the long one in the BL side. The resistance values were recorded for each monolayer. The TEER values for each monolayer were monitored every 2 days until the TEER values exceeded 350 Ω · cm2. TEER (Ω · cm2) = (measured resistance value − the resistance value of the blank transwell) × the membrane surface area of transwell. To ensure the integrity of Caco-2 monolayers, TEER values were monitored before and after the experiments.
The monolayers with TEER values >350 Ω · cm2 were randomly chosen to assess the permeability of the paracellular route by transport marker, fluorescein sodium salt, (C20H10Na2O5, excitation wavelength 460 nm, emission wavelength 515 nm) in the AP to BL direction. Fluorescein sodium salt (1 μg/mL) in 1.5 mL HBSS buffer was added to the AP side, with 2.5 mL HBSS buffer dispensed into the BL side. After each incubation time of 0, 0.25, 0.5, 0.75, 1, 1.5, 2, 2.5, 3, 3.5, 4, and 6 hours at 37°C, an aliquot (0.2 mL) was collected from the BL side. The passage of the fluorescein sodium salt was determined by measuring the fluorescence signals of the BL medium. The inserts were then removed to new wells containing 2.5 mL fresh HBSS. A series of standard solutions for the calibration curve was prepared by dilution of the fluorescein sodium salt stock solution, and the fluorescence signals were determined by using a Spectra Max M2 (Bio-strategy Instruments, Auckland, NZ). The apparent permeability coefficient (Papp) was calculated, and a leakage <1% per hour, corresponding to a Papp value of <4.8 × 10⁻⁷ cm/second, was thought to be appropriate for transport studies.
Cytotoxicity study
The cytotoxicity of drugs and drug-loaded niosomes to the Caco-2 cell was examined by SRB assays. Caco-2 cells were seeded onto 96-well microtiter plates (0.2 mL/well, containing 5,000–10,000 cells/well) and incubated for 24 hours at 37°C before they were washed with PBS, followed by incubation with catechin, EGCG, and their niosomes for 24 hours. After 24-hour exposure to tested materials, cells were then fixed by incubating with 0.2 mL ice-cold 10% trichloroacetic acid at 4°C for 1 hour, and cellular proteins were dyed with 0.1 mL 0.4% (w/v) SRB in 1% acetic acid. Cell-bound dye was extracted with 0.2 mL 10 mM unbuffered Tris base (pH 10.5) to solubilize the dye, and absorbance was determined in a plate reader at 596 nm. Inhibition of growth was expressed as relative viability (% of control) and the half maximal inhibitory concentration (IC50) was calculated from concentration-response curves after log/probit transformation. Concentrations within the safety range were applied in the following transport experiments.
Transport experiments
Before initiating the transport experiments, the monolayers were washed twice with warm (37°C) HBSS. The incubation buffer on both sides of the monolayers was then removed by aspiration. To avoid cell batch variations, the transport experiments for the determination of kinetics or inhibition by various compounds were always conducted on the same day using the same batch of cells. Catechin, EGCG, and their niosomes in 1.5 mL HBSS was added to the AP side, and 2.5 mL of HBSS was added to the BL side. After each incubation time of 0.25, 0.5, 0.75, 1, 1.5, 2, 2.5, 3, 3.5, 4, and 6 hours at 37°C, an aliquot (0.2 mL) was collected from the BL side for HPLC analysis. The inserts were then removed to new wells containing 2.5 mL fresh HBSS. The effect of temperature (4°C and 37°C), adenosine triphosphate (ATP) inhibitor (10 mM sodium azide), permeability glycoprotein (P-gp) inhibitor (100 μM verapamil), multidrug resistance-associated protein 2 (MRP2) inhibitor (100 μM MK-571), and absorption enhancer (10 mM EDTA) on transport were investigated in this experiment. All inhibitors or enhancers were freshly prepared prior to experiment and added to the AP side with 100 μg/mL of different drugs and niosomes. The biotransformation of catechin, EGCG, and their niosomes was checked by analysis of the BL receiving chamber samples using HPLC after 6 hours. All incubations were performed in triplicate.20
HPLC and data analysis
All data were expressed as mean ± standard deviation (SD). The transport characteristics of catechin, EGCG, and their niosomes through Caco-2 cell monolayers were expressed as transport rate and Papp. The transport rate was expressed in μg/minute/cm2 and was calculated by,

where R is transport rate, ΔQ is the amount of catechin or EGCG appearing in the receiver side (μg), Δt is the duration (minutes), and A is the surface area of the membrane (cm2). The Papp was expressed in cm/second and was calculated by,

where C0 is the initial drug concentration.
Results and discussion
Characterization of drug-loaded niosomes
Transmission electron microscopy revealed that the niosomes were generally spherical, around 100 nm, with a uniform distribution as is shown in Figure 2. The particle size of catechin- and EGCG-niosomes was determined to be around 100 nm, with above 40% of added drug encapsulated.
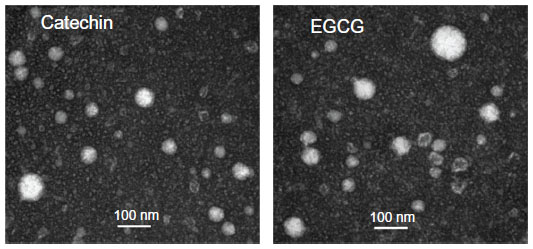 | Figure 2 Transmission electron micrograph of catechin niosomes and EGCG niosomes. |
Stability of catechin and EGCG in HBSS and Caco-2 cells
The instability of catechin and EGCG has been previously described. Briefly, catechin and EGCG (100 μg/mL) were incubated in pH 7.4 HBSS buffer containing different concentrations of ascorbic acid (0.1, 1, and 10 mM) at 37°C for 6 hours. As shown in Figure 3, no significant degradation was observed at 10 mM ascorbic acid; 97.3% catechin and 86.2% EGCG were present and unchanged. Therefore, we selected 10 mM ascorbic acid as the reducing agent to study the metabolism of catechin, EGCG, and their niosomes in the culture medium with Caco-2 cells. There were no detectable metabolites within the medium of Caco-2 cells. The catechin and EGCG in niosome formulation remained unchanged within 6 hours, with only 5.4% and 6.3% decrease, respectively, while the free catechin and the free EGCG decreased 10.8% and 13.0%, respectively (Figure 4). It appeared that the catechin and EGCG in niosomes were more stable than the free drug in Caco-2 cells.
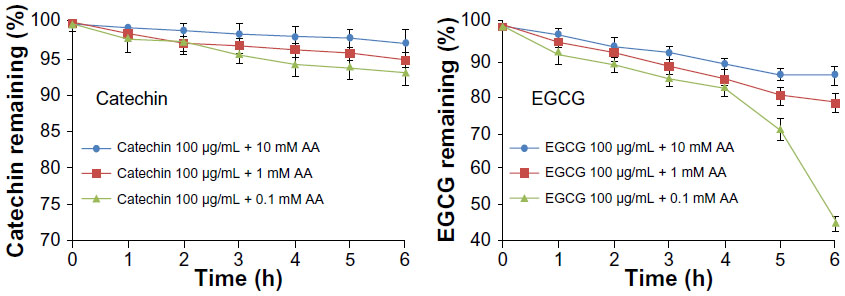 | Figure 3 Stability profiles of 100 μg/mL catechin and EGCG in pH 7.4 HBSS buffer (37°C), in the presence of 0.1 mM, 1 mM, and 10 mM ascorbic acid. |
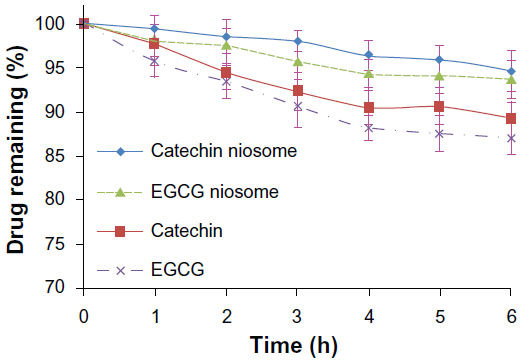 | Figure 4 Stability profiles of 100 μg/mL catechin, EGCG, and their niosomes incubated with Caco-2 cells in pH 7.4 HBSS buffer (37°C), in the presence of 10 mM ascorbic acid. |
Uptake of catechin, EGCG, and their niosomes by Caco-2 cells
The cellular uptake results of FITC-C, FITC-EGCG, and conjugate-loaded niosomes by Caco-2 cells in HBSS over 6 hours are shown in Figure 5. The uptake of 100 μg/mL of different drugs at 37°C increased in a time-dependent manner (Figure 5A). The uptake reached a maximum level at 6 hours, and the uptake values of FITC-C and FITC-EGCG niosomes were 2.66- and 2.13-fold higher than those of the free drugs, respectively. The uptake results are shown in Table 1, and uptake of FITC-C, FITC-EGCG, and their niosomes by Caco-2 cells was 0.67±0.04, 0.46±0.03, 1.72±0.11, and 1.01%±0.09%, respectively, (n=3) of the total added amounts. The enhanced drug uptake may be attributed to the vesicle structure, with the nonionic surfactant as a component which serves as penetration enhancer.21 The uptake also increased in a concentration-dependent manner when the cells were incubated with different drugs and their niosomes within the concentration range of 10–150 μg/mL (Figure 5B); uptake increased in a temperature-dependent manner as well (Figure 5C). This finding reveals that active transport occurred during the uptake process. The enhanced increase in uptake of FITC-C and FITC-EGCG observed when cells were incubated with conjugate-niosomes at 37°C compared to 4°C also suggest that the uptake process was energy-dependent. These findings prompted us to speculate that the main mechanism involved in niosome cellular internalization is an endocytotic process.22 The uptake results can be used to explain the transport mechanism described below.
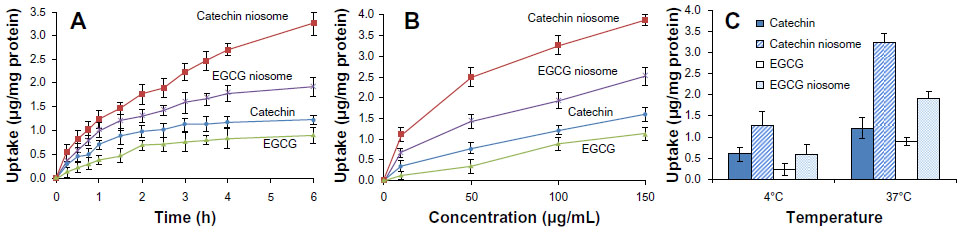 | Figure 5 Time-, concentration-, and temperature-dependent uptake of catechin, EGCG, and their niosomes by Caco-2 cells in HBSS buffer. |
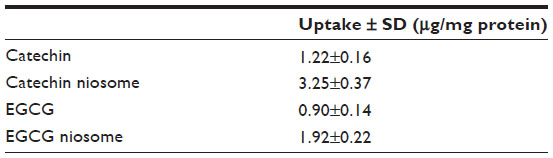 | Table 1 Uptake of catechin, EGCG, and their niosomes at a dose of 100 μg/mL at 37°C after 6 hours incubation in Caco-2 cells |
Transport assay
The result of the SRB assay showed that the IC50 values of catechin and EGCG were 146.7±5.1 and 124.6±3.3 μg/mL, respectively, while those of catechin and EGCG in niosomes were 387.1±8.9 and 304.0±8.2 μg/mL (n=3), respectively. The IC50 values of drug-loaded niosomes were calculated by the IC50 values of niosomes multiplied by the encapsulation efficiency.
The intestinal transport mechanism of catechin, EGCG, and drug-loaded niosomes was investigated in the current study. A schematic diagram of transcellular transport and different transporters in Caco-2 cells is depicted in Figure 6A. When catechin, EGCG, and their niosomes at 0, 10, 20, 50, and 100 μg/mL were loaded on the apical side, their AP to BL flux through the Caco-2 monolayer was essentially linear for up to 6 hours in a concentration-dependent manner, with no apparent saturation (Figure 6B). There appeared to be a faster flux of catechin and EGCG niosomes than the free drugs (Table 2). At the concentration of 100 μg/mL, the flux (μg/minute/cm2) of catechin-niosomes and EGCG-niosomes was 1.8-fold and 1.4-fold faster, respectively, than the corresponding values of catechin and EGCG after 6 hours at 37°C. The Papp values indicated that both catechin and EGCG showed limited transepithelial absorption with relatively small Papp values, which may be associated with their low oral bioavailability. The absorption of niosomes was better than that of free drugs, which may indicate that a different mechanism was involved in the transport of drug-loaded niosomes. Vaidyanathan et al have reported that no major tea catechin was transported via passive diffusion, which indicated that active transport was the major mechanism of free catechin and EGCG.23 Our study suggests that the transport of drug-loaded niosomes may be attributed to the endocytotic pathway which is supported by the uptake results. The TEER values of the monolayers did not change significantly (P>0.05) during the experimental period (up to 6 hours), ensuring the integrity of the monolayers.
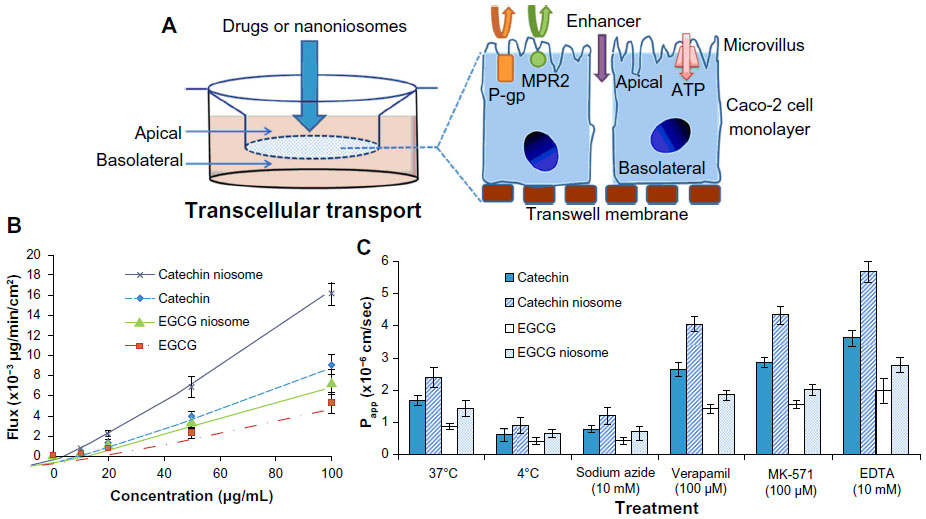 | Figure 6 Transport of catechin, EGCG, and their niosomes by human intestinal Caco-2 cells. |
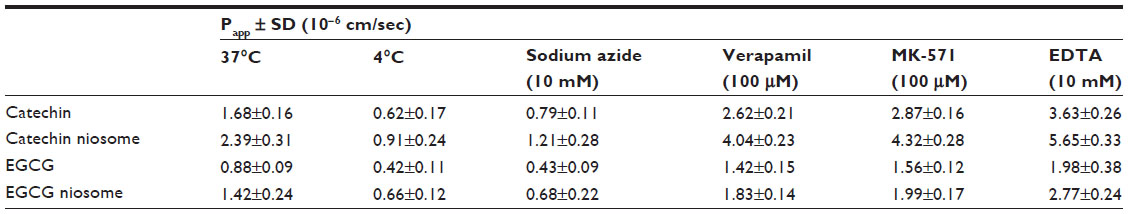 | Table 2 Papp values of catechin, EGCG, and their niosomes (100 μg/mL) from the apical to the basolateral chamber with the treatment of different temperatures, ATP inhibitor (sodium azide), P-gp inhibitor (verapamil), MRP2 inhibitor (MK-571), and absorption enhancer (EDTA) |
The effect of temperature on transport is shown in Figure 6C; the Papp values of all groups (shown in Table 2) were lower at 4°C than at 37°C. The same situation occurred when the ATP inhibitor (10 mM sodium azide) was added. The Papp values were decreased to 47.9%–53.0% of the values when ATP inhibitor was absent from the apical chamber. These results indicated that the flux across Caco-2 monolayer was energy-dependent, and an active mechanism was involved.
The effect P-gp inhibitor (100 μM verapamil), MRP2 inhibitor (100 μM MK-571), and absorption enhancer (10 mM EDTA) on the transport was assessed. P-gp and MRP2 are transporters that are known to restrict drug absorption in the intestinal mucosa.24 These two proteins are mainly located in the apical membranes of the epithelia, and they pump out the drugs. Addition of 100 μM verapamil and 100 μM MK-571 caused a significant increase (28.9%–69.0% and 40.1%–80.8%, respectively) in the transport of catechin, EGCG, and their niosomes. The results suggest that there were functional interactions of catechin, EGCG, and their niosomes with the efflux transport on the cell membrane, and they might function as the substrate of both P-gp and MRP2. When the inhibitors were added, the efflux pumps were deactivated, which led to increased absorption of drug and drug-loaded niosomes.
EDTA is a commonly used penetration enhancer. The main mechanism of absorption enhancers is the paracellular expansion of the tight junction between cells. The membrane lipids may be extracted in the presence of EDTA, and this reduces the barrier properties of the biological membranes, resulting in enhanced drug permeability.25 In this study, the role of absorption enhancer (10 mM EDTA) in the cellular permeability was even stronger, with an increase of 95.1%–136.4%.
Conclusion
Catechin and EGCG found in green tea have received considerable attention due to their favorable biological properties, which include cardioprotective, neuroprotective, and anticancer effects. However, their therapeutic potential is limited by their low oral bioavailability, attributed to poor stability and intestinal absorption. In this study, a niosomal carrier was developed for the purpose of enhancing drug oral bioavailability. The developed drug-loaded niosomes had satisfactory size and entrapment. Compared with the free drugs, the niosome formulations significantly enhanced drug absorption. The transport mechanism of drug-loaded niosomes was found to be temperature- and energy-dependent, which indicated an active mechanism. With the results of uptake studies, it was inferred that endocytosis was involved in the transport process. The inhibitor of P-gp and MRP2 significantly enhanced the uptake amount of catechin, EGCG, and their niosomes. It was also found that the penetration enhancer, EDTA, remarkably improved the transport of drug and niosomes. These findings are relevant to the oral administration of tea flavonoids and to the development of an efficient oral delivery system.
Acknowledgments
This research is supported by Jiangsu Province Social Development Project of scientific and technical supporting programs (No BE2012744); General Financial Grant from the China Postdoctoral Science Foundation (No 2012M512179, No 2013T60962); the Open Project Program of MOE Key Laboratory of Drug Quality Control and Pharmacovigilance (No MKLDP2013MS01); College Students Innovation Project for the R&D of Novel Drugs (No J1030830); New Zealand Pharmacy Education Research Fund (NZPERF); and sponsored by Qing Lan Project.
Disclosure
The authors report no conflicts of interest in this work.
References
Fujiki H, Suganuma M. Green tea: an effective synergist with anticancer drugs for tertiary cancer prevention. Cancer Lett. 2012;324(2):119–125. | |
Grassi D, Desideri G, Di Giosia P, et al. Tea, flavonoids, and cardiovascular health: endothelial protection. Am J Clin Nutr. 2013;98(Suppl 6):1660S–1666S. | |
Gu JW, Makey KL, Tucker KB, et al. EGCG, a major green tea catechin suppresses breast tumor angiogenesis and growth via inhibiting the activation of HIF-1α and NFκB, and VEGF expression. Vasc Cell. 2013;5(1):9. | |
Yu Y, Deng Y, Lu BM, Liu YX, Li J, Bao JK. Green tea catechins: a fresh flavor to anticancer therapy. Apoptosis. 2014;19(1):1–18. | |
Baba S, Osakabe N, Natsume M, Muto Y, Takizawa T, Terao J. In vivo comparison of the bioavailability of (+)-catechin, (−)-epicatechin and their mixture in orally administered rats. J Nutr. 2001;131(11):2885–2891. | |
Henning SM, Choo JJ, Heber D. Nongallated compared with gallated flavan-3-ols in green and black tea are more bioavailable. J Nutr. 2008;138(8):1529S–1534S. | |
Chow HH, Hakim IA, Vining DR, et al. Effects of dosing condition on the oral bioavailability of green tea catechins after single-dose administration of Polyphenon E in healthy individuals. Clin Cancer Res. 2005; 11(12):4627–4633. | |
Peters CM, Green RJ, Janle EM, Ferruzzi MG. Formulation with ascorbic acid and sucrose modulates catechin bioavailability from green tea. Food Res Int. 2010;43(1):95–102. | |
Dube A, Ng K, Nicolazzo JA, Larson I. Effective use of reducing agents and nanoparticle encapsulation in stabilizing catechins in alkaline solution. Food Chem. 2010;122(3):662–667. | |
Caddeo C, Teskac K, Sinico C, Kristl J. Effect of resveratrol incorporated in liposomes on proliferation and UV-B protection of cells. Int J Pharm. 2008;363(1–2):183–191. | |
Mahale NB, Thakkar PD, Mali RG, Walunj DR, Chaudhari SR. Niosomes: novel sustained release nonionic stable vesicular systems – an overview. Adv Colloid Interface Sci. 2012;183–184:46–54. | |
Sambuy Y, De Angelis I, Ranaldi G, Scarino ML, Stammati A, Zucco F. The Caco-2 cell line as a model of the intestinal barrier: influence of cell and culture-related factors on Caco-2 cell functional characteristics. Cell Biol Toxicol. 2005;21(1):1–26. | |
Li D, Martini N, Wu Z, Wen J. Development of an isocratic HPLC method for catechin quantification and its application to formulation studies. Fitoterapia. 2012;83(7):1267–1274. | |
Junyaprasert VB, Singhsa P, Suksiriworapong J, Chantasart D. Physicochemical properties and skin permeation of Span 60/Tween 60 niosomes of ellagic acid. Int J Pharm. 2012;423(2):303–311. | |
Lun Su Y, Leung LK, Huang Y, Chen ZY. Stability of tea theaflavins and catechins. Food Chem. 2003;83:189–195. | |
Han DW, Matsumura K, Kim B, Hyon SH. Time-dependent intracellular trafficking of FITC-conjugated epigallocatechin-3-O-gallate in L-929 cells. Bioorg Med Chem. 2008;16(22):9652–9659. | |
Smith PK, Krohn RI, Hermanson GT, et al. Measurement of protein using bicinchoninic acid. Anal Biochem. 1985;150(1):76–85. | |
Vaidyanathan JB, Walle T. Transport and metabolism of the tea flavonoid (−)-epicatechin by the human intestinal cell line Caco-2. Pharm Res. 2001;18(10):1420–1425. | |
Hong J, Lu H, Meng X, Ryu JH, Hara Y, Yang CS. Stability, cellular uptake, biotransformation, and efflux of tea polyphenol (−)-epigallocatechin-3-gallate in HT-29 human colon adenocarcinoma cells. Cancer Res. 2002;62(24):7241–7246. | |
Zhou S, Feng X, Kestell P, Paxton JW, Baguley BC, Chan E. Transport of the investigational anti-cancer drug 5,6-dimethylxanthenone-4-acetic acid and its acyl glucuronide by human intestinal Caco-2 cells. Eur J Pharm Sci. 2005;24(5):513–524. | |
Marianecci C, Paolino D, Celia C, Fresta M, Carafa M, Alhaique F. Non-ionic surfactant vesicles in pulmonary glucocorticoid delivery: characterization and interaction with human lung fibroblasts. J Control Release. 2010;147(1):127–135. | |
Di Marzio L, Marianecci C, Cinque B, et al. pH-sensitive non-phospholipid vesicle and macrophage-like cells: binding, uptake and endocytotic pathway. Biochim Biophys Acta. 2008;1778(12):2749–2756. | |
Vaidyanathan JB, Walle T. Cellular uptake and efflux of the tea flavonoid (−)epicatechin-3-gallate in the human intestinal cell line Caco-2. J Pharmacol Exp Ther. 2003;307(2):745–752. | |
Collett A, Higgs NB, Sims E, Rowland M, Warhurst G. Modulation of the permeability of H2 receptor antagonists cimetidine and ranitidine by P-glycoprotein in rat intestine and the human colonic cell line Caco-2. J Pharmacol Exp Ther. 1999;288:171–178. | |
Rojanasakul Y, Liaw J, Robinson JR. Mechanisms of action of some penetration enhancers in the cornea: laser scanning confocal microscopic and electrophysiology studies. Int J Pharm. 1990;66(1–3):131–142. |
 © 2014 The Author(s). This work is published and licensed by Dove Medical Press Limited. The
full terms of this license are available at https://www.dovepress.com/terms.php
and incorporate the Creative Commons Attribution
- Non Commercial (unported, v3.0) License.
By accessing the work you hereby accept the Terms. Non-commercial uses of the work are permitted
without any further permission from Dove Medical Press Limited, provided the work is properly
attributed. For permission for commercial use of this work, please see paragraphs 4.2 and 5 of our Terms.
© 2014 The Author(s). This work is published and licensed by Dove Medical Press Limited. The
full terms of this license are available at https://www.dovepress.com/terms.php
and incorporate the Creative Commons Attribution
- Non Commercial (unported, v3.0) License.
By accessing the work you hereby accept the Terms. Non-commercial uses of the work are permitted
without any further permission from Dove Medical Press Limited, provided the work is properly
attributed. For permission for commercial use of this work, please see paragraphs 4.2 and 5 of our Terms.