Back to Archived Journals » Advances and Applications in Bioinformatics and Chemistry » Volume 14
Enhanced Understanding of Molecular Interactions and Function Underlying Pain Processes Through Networks of Transcript Isoforms, Genes, and Gene Families
Authors Zhang P, Southey BR ![]() , Sweedler JV
, Sweedler JV ![]() , Pradhan A, Rodriguez-Zas SL
, Pradhan A, Rodriguez-Zas SL ![]()
Received 5 October 2020
Accepted for publication 5 January 2021
Published 18 February 2021 Volume 2021:14 Pages 49—69
DOI https://doi.org/10.2147/AABC.S284986
Checked for plagiarism Yes
Review by Single anonymous peer review
Peer reviewer comments 2
Editor who approved publication: Dr Juan Fernandez-Recio
Pan Zhang,1 Bruce R Southey,2 Jonathan V Sweedler,3 Amynah Pradhan,4 Sandra L Rodriguez-Zas1,2,5
1Illinois Informatics Institute, University of Illinois at Urbana-Champaign, Urbana, IL, USA; 2Department of Animal Sciences, University of Illinois at Urbana-Champaign, Urbana, IL, USA; 3Department of Chemistry and the Beckman Institute, University of Illinois at Urbana-Champaign, Urbana, IL, USA; 4Department of Psychiatry, University of Illinois at Chicago, Chicago, IL, USA; 5Department of Statistics, University of Illinois at Urbana-Champaign, Urbana, IL, USA
Correspondence: Sandra L Rodriguez-Zas
University of Illinois at Urbana-Champaign, 1207 W Gregory Dr., Urbana, Illinois 61801, USA
Tel +1 217 333 8810
Fax +1 217 333 8286
Email [email protected]
Introduction: Molecular networks based on the abundance of mRNA at the gene level and pathway networks that relate families or groups of paralog genes have supported the understanding of interactions between molecules. However, multiple molecular mechanisms underlying health and behavior, such as pain signal processing, are modulated by the abundances of the transcript isoforms that originate from alternative splicing, in addition to gene abundances. Alternative splice variants of growth factors, ion channels, and G-protein-coupled receptors can code for proteoforms that can have different effects on pain and nociception. Therefore, networks inferred using abundance from more agglomerative molecular units (eg, gene family, or gene) have limitations in capturing interactions at a more granular level (eg, gene, or transcript isoform, respectively) do not account for changes in the abundance at the transcript isoform level.
Objective: The objective of this study was to evaluate the relative benefits of network inference using abundance patterns at various aggregate levels.
Methods: Sparse networks were inferred using Gaussian Markov random fields and a novel aggregation criterion was used to aggregate network edges. The relative advantages of network aggregation were evaluated on two molecular systems that have different dimensions and connectivity, circadian rhythm and Toll-like receptor pathways, using RNA-sequencing data from mice representing two pain level groups, opioid-induced hyperalgesia and control, and two central nervous system regions, the nucleus accumbens and the trigeminal ganglia.
Results: The inferred networks were benchmarked against the Kyoto Encyclopedia of Genes and Genomes reference pathways using multiple criteria. Networks inferred using more granular information performed better than networks inferred using more aggregate information. The advantage of granular inference varied with the pathway and data set used.
Discussion: The differences in inferred network structure between data sets highlight the differences in OIH effect between central nervous system regions. Our findings suggest that inference of networks using alternative splicing variants can offer complementary insights into the relationship between genes and gene paralog groups.
Keywords: Gaussian Markov random fields, pain, alternative splicing, pathway, RNA-seq, transcript isoform network
Introduction
The study of gene co-expression networks has advanced the detection of interaction between molecules such as regulatory associations.1 Gene network reconstruction has also been critical in accelerating gene annotation,2 and the understanding of the function or role of a gene within a pathway.3 In these networks, the genes are the nodes and the edges connecting the nodes are a function of the covariation (eg, correlation) or conversely, inverse of covariation (eg, dispersion) of the expression levels between genes.4
RNA-sequencing (RNA-seq) platforms enable the measurement of the levels of transcript abundance in a sample. The basis of this technology is the sequencing of short nucleotide stretches. These reads are aligned to a reference sequence and inference of the gene segments that are transcribed. Typically, the reads that map to the same gene are combined into a single value of global gene expression that can be used to infer gene networks. However, the reads can be mapped to the distinct transcript isoforms, resulting from alternative splicing, thereby enabling the quantification of individual transcript isoforms.
The same approaches available to infer networks using global gene expression profiles can be applied to infer networks using alternative splicing variant profiles. The use of profiles at the gene level does not allow to uncover the connectivity and network topology that is transcript isoform dependent.5 The inference of transcript isoform networks based on the abundance of alternative splice products advanced the understanding of the interplay among transcript isoforms.6,7 However, the granularity of transcript isoform networks may not be necessary when interactions between genes are similar across all isoforms. Also, the use of profiles at the transcript isoform level may not be adequately informative to establish connectivity between network nodes.
The consideration of the level of profile granularity when inferring a molecular network is also applicable to the pathways presented in reference databases such as the Kyoto Encyclopedia of Genes and Genomes (KEGG) or Biogrid.8,9 These pathways can include connections between families or groups of paralog gene products in addition to individual genes. The nodes in the KEGG database pathways can be individual genes or groups of paralog genes that arose from gene duplication and maintained similar functions. The considerations of accuracy and precision in network inference, when considering transcript isoform relative to gene profiles, are applicable to pathways of individual genes relative to gene paralog families or clusters.
Research on the inference of transcript isoform network has either focused on transcript isoform profiles alone,5 or has simultaneously considered gene and transcript isoform levels with the goal of characterizing the regulation of splicing and transcription.10 These studies have tested the performance of the approach on simulated profiles or were applied to real data to discover mechanisms.10 A systematic assessment of relative advantages of networks reconstructed based on gene-level, transcript isoform-level, or gene-transcript isoform-level information is needed. Moreover, a comparison of the performance of these network types using real data sets against known molecular relationships will provide conclusive evidence on the suitability to elucidate gene interactions.
The experimental motivation for this bioinformatics study is the known role of alternative splicing variants on multiple molecular mechanisms underlying health and behavior, and in particular, in pain signal processing. Alternative splice variants of growth factors, ion channels, and G-protein-coupled receptors code for proteoforms can have different effects on pain and nociception.11–16 Failure to study molecular interactions at multiple levels, from transcript isoform to paralog gene cluster, hinders the development of effective pharmacological agents.11
The present study evaluates the advantages of network reconstructions using alternative inputs across a range of outputs. The evaluated network inputs included different levels of granularity, including profiles from transcript isoforms, genes, and combination of transcript isoforms and genes. A novel approach to agglomerate the information from lower levels into coarser higher levels of molecular information is presented. The evaluated network outputs included different levels of agglomeration, ranging from transcript isoforms to genes and groups of gene paralogs. Following benchmarking using complementary network sensitivity and precision indicators, the approach can be applied to improve the discovery of network modules and hubs across the genome.
The comparison of the relative advantage of various levels of network inference was applied to RNA-seq profiles from a study of the effects of opioid-induced hyperalgesia (OIH) relative to control mice.17 Results from the analysis of gene expression profiles identified 187 genes differentially expressed between treatments and supported the enrichment of the KEGG Circadian Rhythm (CR) and Toll-like receptor (TL) pathways.18 The relationship between molecules in the circadian rhythm and Toll-like receptor pathways at various granularity levels were reconstructed using profiles at the transcript isoform and gene levels. Lastly, the accuracy and precision of the inferred networks were benchmarked against the KEGG pathways.
Materials and Methods
The relationships between the transcript isoform, gene, and paralog gene group nodes in the network were captured by the Gaussian Markov random field sparse precision matrix.19 In this framework, non-zero off-diagonal entries in the sparse precision matrix corresponded to nodes are that are correlated,20 and an edge was used to denote the connection between these nodes. On the other hand, zero off-diagonal entries in the precision matrix resulted in the absence of an edge between these nodes.21,22
The sparse precision matrix (θ) was estimated from the relationship among the inputs as a function of the empirical covariance matrix (S) between log-transformed and standardized input abundances and of a penalty ( ) weighting the L1 norm:23

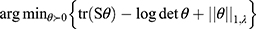
In the previous equation, the penalty λ is a regularization or smoothing parameter that enables the estimation of a sparse precision matrix from the observed covariance matrix. The isoform and gene networks were generated from the relationship of the isoform and gene inputs to the outputs using the QUIC R package (version 1.1) to compute θ.23
The optimal penalty parameter was empirically estimated as the value that maximized the alignment between the inferred network and the known pathway in the KEGG database. Different penalty values ranging from 0 to 1.5 by 0.01 squared abundance level units were tested within profile input type, node output type, data set and pathway. The minimum percentage of input edges (eg, transcript isoforms) out of all possible edges required to detect an edge between output nodes (eg, genes) studied were 40%, 45%, 50%, 55%, 60%, 65% and 70%. Therefore, a grid of 150 x 6 = 900 combinations of parameter values was evaluated per network.
Network Reconstruction
Table 1 summarizes the six scenarios of input granularity and output agglomeration that were studied. Molecular networks were constructed for the different output levels (ie, transcript isoform, gene, or gene group) using the covariance matrix based on the distinct inputs. The input profiles studied, in terms of decreasing granularity, were the mRNA abundance at the transcript isoform level, gene level, and combination of transcript isoform and gene levels. The output nodes studied, in terms of decreasing granularity, were transcript isoforms, genes, and paralog gene groups. Paralog gene group encompasses gene families including members that have a similar or partially overlapping function.
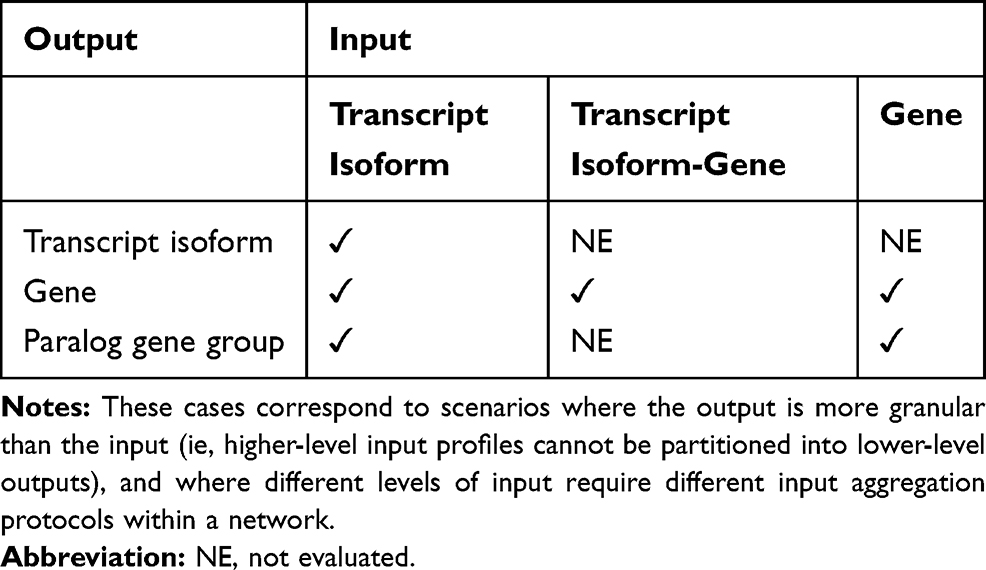 |
Table 1 Scenarios of Input Granularity and Output Agglomeration Levels Studied Across Four Data Sets and Two Pathways |
Three levels of transcript abundance were used as input to infer networks: transcript isoform, gene, and gene-transcript isoform levels. In the first two input scenarios, the covariances were calculated between transcript isoforms or between gene abundances. For the gene-transcript isoform input, the gene abundances were appended to the transcript isoform and the covariance across all abundances. Only the components corresponding to the covariances between gene abundances and transcript isoform abundances were kept.
Output nodes of three types were inferred, including transcript isoform, gene, paralog gene group. Only connections between genes and isoforms were considered as edges in the different output networks. Serving as baseline networks, networks of transcript isoform nodes based on transcript isoform abundance and networks of gene nodes based on gene abundance profiles were inferred directing from the sparse precision matrix. Networks between inputs with higher granularity than the output were obtained by a simple ensemble method to reduce the sparse precision matrix obtained from higher granularity inputs to the less granular outputs.21,22 The relationship between nodes of the low granularity outputs was determined by the ratio of edges between the high granularity inputs and the low granularity outputs. The threshold of the magnitude of the ratio was determined by comparing the network with the expected network output.
Transcript and Gene Identification and Data Sets
The approach to infer transcript isoform, gene and gene group networks was applied to RNA-seq data from a mouse experiment designed to uncover the genes associated with pain sensitivity triggered by opioid use. Supervised short-term opioid-based therapies can help ameliorate chronic pain reported by more than 30% of the population in the occident. However, repeated opioids utilization can elicit opioid-induced hyperalgesia (OIH) of heightening sensitivity to pain. Thus, opioid use can engender a more fierce sense of pain instead of alleviating the pain and, in turn, may lead to higher opioid consumption.24,25
The mRNA profiles used in the present study to infer networks were measured in an experiment encompassing C57BL/6J (Jackson Laboratories, Bar Harbor, ME) mice receiving one of two treatments, and samples were collected from two central nervous systems regions.17 Male mice, between 9 and 12 weeks old were studied. Mice were group-housed in a 12–12 light-dark cycle, and the food was available ad libitum. Animals were weighed daily during treatment, and no adverse effects of treatment were observed on body weight or visibly healthy performance. The University of Illinois at Chicago Office of Animal Care and Institutional Biosafety Committee approved the animal experiments in accordance with AALAC guidelines, the Animal Care Policies of the University of Illinois at Chicago and the European Union directive on the subject of animal rights.
The two treatments evaluated were administration of chronic morphine used to elicit OIH and a matching vehicle (Veh) that served as a control. Mice in the OIH group received an injection of morphine dissolved in 0.9% saline solution while mice in the Veh group were injected with saline vehicle at 10 mL/kg volume. Mice were injected morphine or vehicle twice daily and the dose was 20 mg/kg on the first 3 days and 40 mg/kg on the fourth day.17 On the fifth day, mice were anesthetized with pentobarbital (Somnosol), euthanized, and an intracardiac perfusion using ice-cold saline was applied.17 Brains were extracted, and two central nervous system regions, the trigeminal ganglia (TG) and the nucleus accumbens (NA) were dissected, snap-frozen, and stored at −80 °C. Each region from individual mice was homogenized using ceramic beads (MO BIO, Carlsbad, CA) and TRIzol (Invitrogen, Carlsbad, CA), and the Omega Biotek RNA kit (Norcross, GA) was used to isolate the RNA.17
The RNA-seq data consisted of 100nt paired-end reads obtained using HiSeq 4000 (Illumina, San Diego, CA) are available in the National Center for Biotechnology Information Gene Expression Omnibus (GEO) database, accession identifier GSE126662.
The average Phred quality score of the reads assessed using FastQC26 was >30 across all read positions, and therefore no read trimmed was applied. The paired-end reads from the individual samples were aligned to the C57BL/6J mouse genome (version GRCm38 p6) using the STAR aligner (V2.5.3a) software.27 The recorded expression levels were mapped to protein-coding genes and transcript isoforms using the GENCODE VM18 annotation.28 The levels of transcript isoform and gene expression were quantified as raw reads count and Transcripts Per Kilobase Million (TPM) using RSEM (V1.3.1).29 Transcript isoforms and genes with at least five reads and one TPM per treatment–region combination were used as inputs for each pathway. The input TPM abundance levels were log-transformed and standardized across all samples for transcript isoforms and genes, respectively. The trimmed mean M-values normalized gene expression values were described using a generalized linear model and the software edgeR v. 3.14.0 in the R v. 3.3.1 environment was used to test for differential gene expression between treatments and regions was assessed.17 The Gene Set Enrichment Analysis (GSEA) available in the software GSEA-P 2.0 [35] was used to identify enriched pathways among the genes over- and under-expressed between sample groups.17
From the analysis of abundance at the gene level, we identified that the circadian rhythm (CR) pathway was enriched among the genes over-expressed, and Toll-like receptor signaling (TL) pathway was enriched among the genes under-expressed in OIH relative to Veh, irrespectively of central nervous system region.17 The genes and their corresponding transcript isoforms were identified and extracted for each pathway. The annotation of the genes to the paralog gene group of each pathway genes is presented in Supplementary Table S1. Examples of paralog genes in the circadian rhythm pathway the cryptochromes (Cry) genes Cry1 and Cry2 or the period circadian protein (Per) genes Per1, Per2, and Per3 and Toll-like receptor pathway; the mitogen-activated protein kinase (Mapk) genes Mapk8, Mapk9, and Mapk10, and the thymoma viral proto-oncogene (Atk) genes Atk1, Atk2, and Atk3.
Differential splicing analysis was performed using the LeafCutter annotation-free algorithm5 for the genes in each pathway. The package was implemented with the parameter settings of at least three samples per intron and at least 50 split reads must support the cluster with introns up to 500 kb. Clusters that presented a differential splicing with P-value <0.05 were considered for further analysis. The variation in intron splicing between treatment groups was considered biologically significant when the Percentage Spliced Index (PSI) differed by more than 5%. Differential splicing events were then mapped to gene names using the Gencode VM18 version with the goal of annotating the splicing events of interest.
Network Construction
Each network input–output scenario (Table 1) was applied to the CR and TL pathways. These two pathways differed in network size and connectivity thus enabled the test of the effects of the network features on the relative advantages of the network scenario evaluated (Table 2). The divergent characteristics of both pathways enabled us to disentangle the effect of pathway size and connectivity on network reconstruction. The CR pathway has fewer nodes (ie, genes, gene clusters and transcript isoforms) and higher connectivity (ie, the proportion of connected nodes) than the TL pathway. The resulting networks were visualized using Cytoscape.30
 |
Table 2 Connectivity of the Circadian Rhythm and Toll-Like Receptor Pathways Studied by Output Type |
Network Evaluation
The optimal penalty parameter to aggregate granular edges, and the properties of the reconstructed network (eg, accuracy) for each network scenario were identified in four data sets supported by the experimental design. These four data sets encompassed the mRNA abundance of 1) all OIH samples across regions (OIH data set), 2) all Veh samples across regions (Veh data set), 3) all NA samples across both treatments (NA data set), and 4) all TG samples across both treatments (TG data set). The two tissue data sets encompass distinct samples and the two treatment data sets encompass distinct samples. The prior analysis at the gene level indicated that the number of genes differentially expressed between regions was higher than between treatments.17 Therefore, the data sets that encompassed transcriptome abundance information across both treatments (the region NA and TG data sets) were expected to encompass more variability in mRNA abundance than the remaining two data sets across regions. The network inferred from one data set cannot be inferred from the other data sets. Each data set included the same number of samples and highlighted the level of gene heterogeneity in expression within four data sets.
The performance of each network scenario (six input–output scenarios), for each pathway (CR and TL pathways), and in each data set (OIH, Veh, TG, and NA data sets) was determined based on the inferred edges. Positive (P) and negative (N) edges are the connections between nodes present (non-zero entry in the sparse precision matrix θ) or absent (zero entry in the sparse precision matrix θ), respectively, in each pathway. True positives (TP) and false positives (FP) correspond to the edges detected by the network reconstruction algorithm that were present or absent, respectively, in the corresponding KEGG pathway. Likewise, true negatives (TN) and false negatives (FN) correspond to edges not detected by the network reconstruction algorithm that was not present or absent, respectively, in the KEGG pathway.
Using TP, FP, FN, and TN edge results, the inferred networks for each scenario were assessed using complementary indicators including 1) sensitivity or true positive rate (TPR=TP/(TP+FN)); 2) specificity or true negative rate (TNR=TN/(TN+FP)); 3) precision or positive predictive value (PPV=TP/(TP+FP)); 4) negative predictive value (NPV=TN/(TN+FN)); 5) accuracy (ACC = (TP+TN)/(P+N)); 6) markedness (MK = PPV+NPV – 1); 7) balanced accuracy (BA=(TPR+TNR)/2); 8) harmonic mean of sensitivity and specificity (F1=2xTP/(2xTP+FP+FN)); 9) Matthews correlation coefficient (MCC=(TPxTN-FPxFN/sqrt((TP+FP)x(TP+FN)x(TN+FP)x(TN+FN))); 10) bookmaker informedness (BM=TPR+TNR-1); and 11) negative predictive value (NPV=TN/(TN+FN)).
The network performance of the input–output scenarios was compared across pathways and data sets. The performance of the input–output scenarios encompassing different granularity levels was compared relative to the standard scenarios that use the same granularity level for the input and output such as gene input and gene output. The performance of these standard baseline networks was compared relative to that of networks of agglomerative output inferred using granular input profiles such as the network of paralog gene groups using transcript isoform- or gene-level abundance as input, or the network of genes using transcript isoform or transcript isoform-gene level abundance as input. The comprehensive evaluation of the network performance across data sets representing different profile variability and pathways representing different dimensions and connectivity enabled us to understand the approach strengths and optimal parameter designations. This information can guide the reconstruction of a broader network exhibiting higher abundance variability across samples.
Results and Discussion
Profiles and Alternative Splicing Variants
The present study evaluated the performance of network reconstructions for alternative inputs and output scenarios. A systematic study of the optimal network parameters (penalty and minimum percentage of input edges supporting output connections) was undertaken to evaluate the impact of input–output scenarios, data sets, and pathway characteristics on the performance of the reconstructed network relative to the node connections in the KEGG repository. One of the objectives of this study was to compare the performance of networks across different levels of input granularity akin to levels of detailed abundance profiling. This objective also encompassed the comparison of the network performance across different levels of output agglomeration akin to the level of abundance grouping. Three levels of input granularity (transcript isoform, gene, and transcript isoform-gene), and the three levels of output agglomeration (paralog gene group, gene, and transcript isoform) were studied (in Table 1).
Unsupervised clustering of the expression level of the genes in the CR and TL pathways aided in the characterization of the data sets and pathway genes. Figures 1 and 2 depict the heatmap of expression levels among the four data sets characterized by the treatment–region combination (ie, OIH-NA, OIH-TG, Veh-NA and Veh-TG) for the CR and TL pathways, respectively. The CR and TL pathways were enriched among the genes differentially expressed between treatment groups.17 However, the expression pattern of some genes does not present a substantial variation between the OIH and Veh data sets. The reduced variability in the profiles across treatments could limit the capacity of the Gaussian Markov Random field algorithm to identify node connections from NA and TG data sets. Figures 1 and 2 show that the difference in expression level between regions is more significant than treatment.
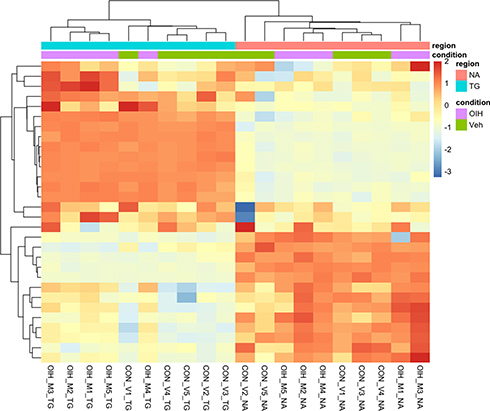 |
Figure 1 Unsupervised clustering of expression level from genes in the circadian rhythm pathway. |
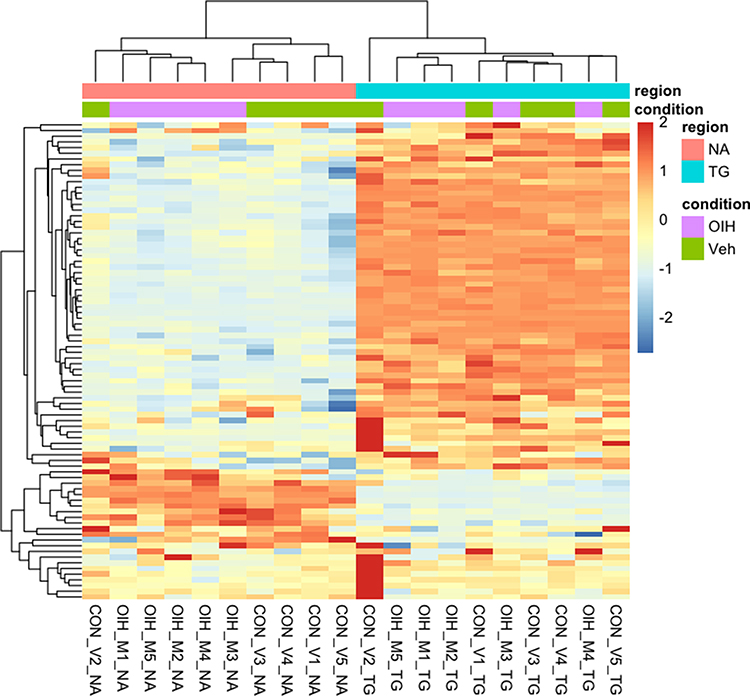 |
Figure 2 Unsupervised clustering of expression level from genes in the Toll-like receptor pathway. |
Differential splicing events between the OIH and Veh treatment groups were identified using LeafCutter. For NA, 44 intron clusters were identified in the CR pathway, and 83 intron clusters were identified in the TL pathway. For TG, 43 clusters were identified in the CR pathway, and 86 intron clusters were identified in the TL pathway. Figures 3 and 4 depict the intron clusters in CR and TL pathway genes, respectively, that exhibited the highest differential splicing between the OIH and Veh treatments (P-value <0.05). Circadian rhythm genes in Figures 3 and 4 include Per3, Aryl hydrocarbon receptor nuclear translocator-like protein 1 (Arntl), 5ʹ AMP-activated protein kinase catalytic subunit alpha 1 (Prkaa1), and F box/LRR repeat protein 3 (Fbxl3). Toll-like receptor signaling genes in Figures 3 and 4 include conserved helix-loop-helix ubiquitous kinase (Chuk), TNF receptor-associated factor 6 (Traf6), RAC alpha serine/threonine-protein kinase (Akt1), RAC gamma serine/threonine-protein kinase (Akt3), interferon regulatory factor 3 (Irf3), interferon alpha/beta receptor 2 (Ifnar2), nuclear factor kappa B p105 subunit (Nfkb1), and dual-specificity mitogen-activated protein kinase kinase 4 (Map2k4).
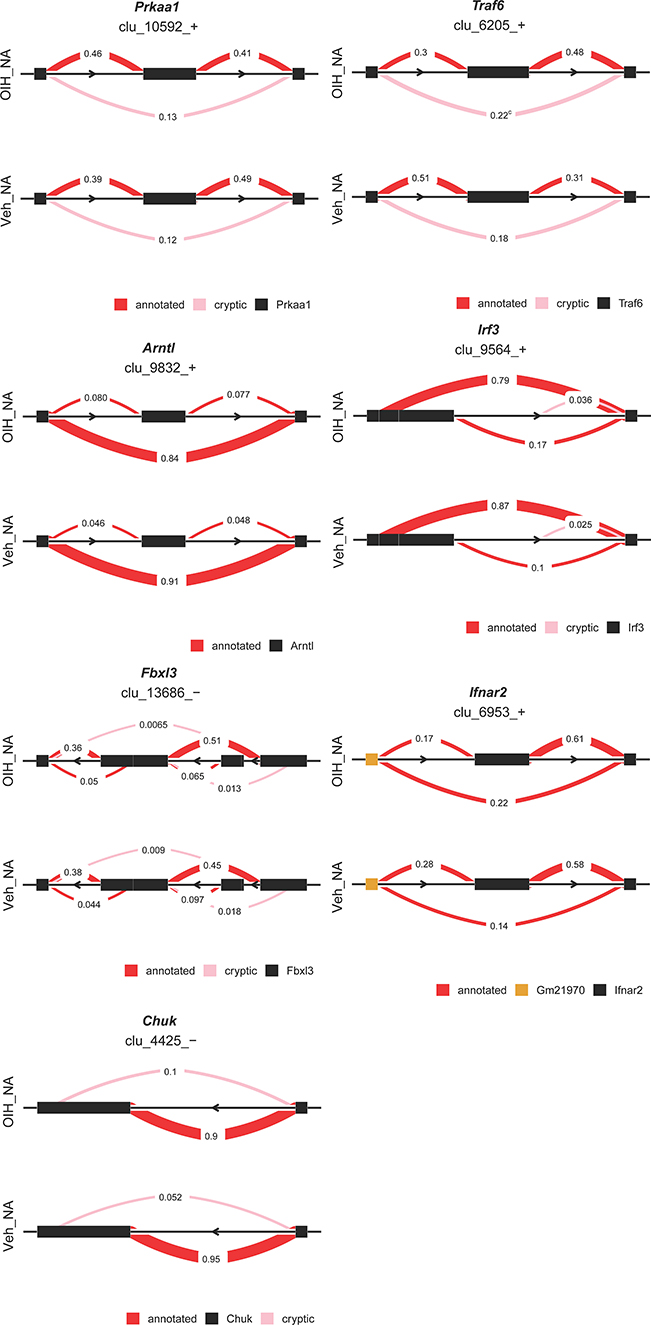 |
Figure 3 Genes exhibiting differential alternative splicing (P-value < 0.05 and delta PSI > 5%) between opioid-induced hyperalgesia and control mice in the nucleus accumbens. Clu followed by a sign denotes the strand of the intron cluster; red and pink semicircles denote alternative splicing variants that have annotated or novel, respectively. |
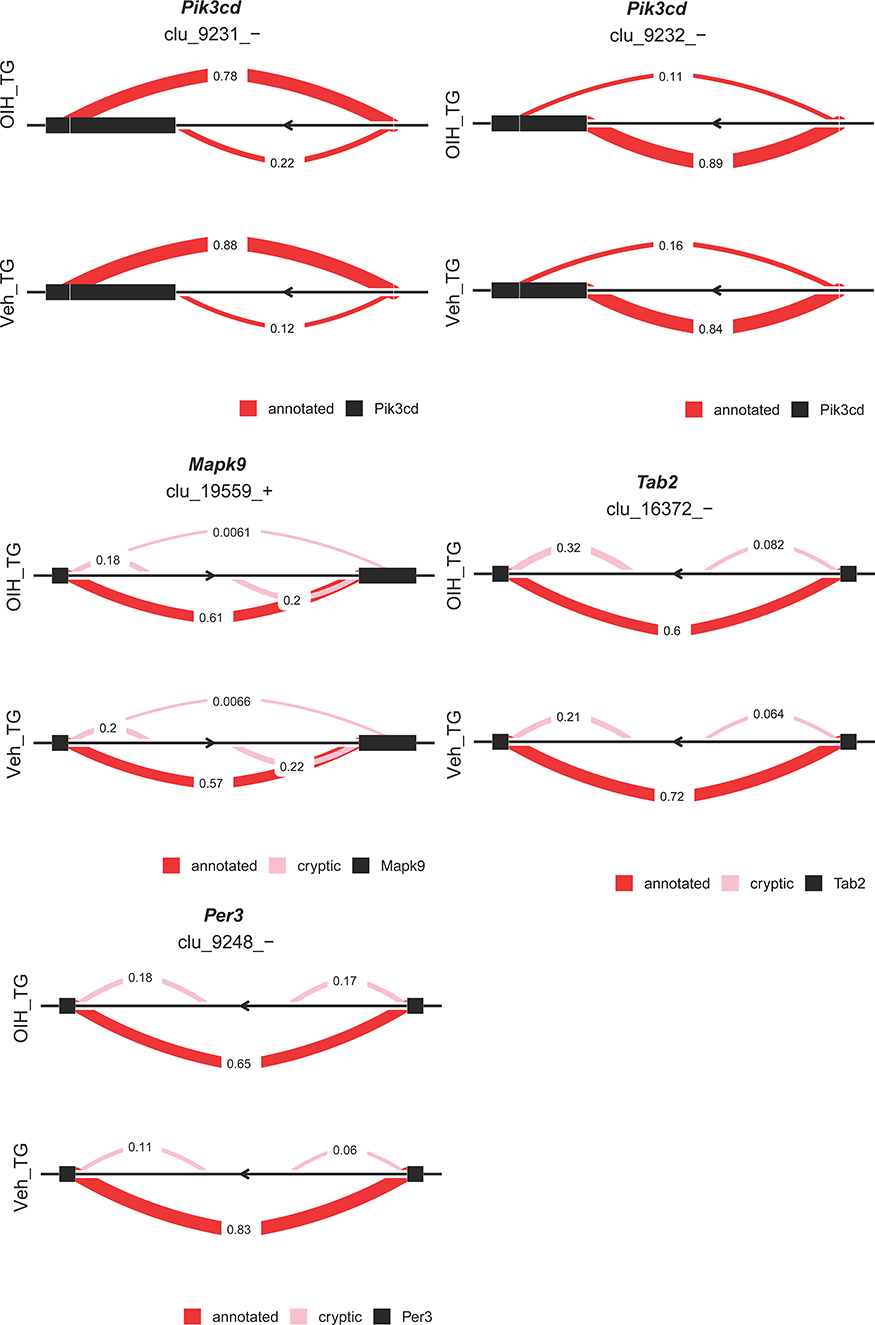 |
Figure 4 Genes exhibiting differential alternative splicing (P-value < 0.05 and delta PSI > 5%) between opioid-induced hyperalgesia and control mice in the trigeminal ganglia. Clu followed by a sign denotes the strand of the intron cluster; red and pink semicircles denote alternative splicing variants that have annotated or novel, respectively. |
Among the CR genes in the NA that exhibited significant alternative splicing between OIH and Veh treatment, Fbxl3 codes for a core component of SCF E3 ubiquitin ligase complex and promotes CRY ubiquitination and degradation.31,32 Among the TL genes in the NA that exhibited significant alternative splicing Traf6 is another E3 ubiquitin ligase that promotes AKT ubiquitination and phosphorylation and contributes to the activation of Nfkb1.33,34 Interestingly, Akt1, Akt3 and Nfkb1 were differentially spliced in OIH relative to Veh as well, suggesting that these independent differential splicing episodes may lead to a common loss of function, potentially due to the loss of binding domain that impacts ubiquitination.
In the TG, six genes across the CR and TL pathways presented significant differential splicing between OIH and Veh including Per3, phosphatidylinositol 4.5-bisphosphate 3-kinase catalytic subunit delta isoform (Pik3cd), TGF beta activated kinase 1 and MAP3K7-binding protein 2 (Tab2), dual specificity mitogen-activated protein kinase kinase 7 (Map2k7), NF kappa B essential modulator (Ikbkg), mitogen-activated protein kinase 9 (Mapk9) (Figure 3). Two distinct intron clusters that combined can produce multiple transcript isoforms were detected in Pik3cd. The previous findings support the need to explore the interaction between molecules at the transcript isoform level, in addition to the gene or paralog gene group levels to understand the molecular mechanisms underlying OIH.
Network Inference
Overall, 56 networks encompassing 7 input–output scenarios across two pathways and four data sets were inferred. The systematic evaluation of network performance across conditions enabled us to understand the impact of the type of input and output, and algorithmic criteria that support high performance among the inferred networks. The inference of networks including nodes that represent aggregations of the granular input required the identification of a novel criteria to identify output node connections (edges) under partial consistency of inferred edges among granular inputs. This criterion was necessary when, for example, the relationship between two gene nodes was inferred based on the relationship between multiple transcript isoforms within the node (gene), and at least one inferred transcript isoform edge or relationship differed from the rest. A similar scenario occurs detecting edges based on gene profiles, but the output is a network of edges connecting paralog gene groups.
The criterion used to identify edges among agglomerative output nodes was based on the minimum percentage of input granular relationships that supported a connection between two agglomerative nodes. The optimal criterion was the threshold that offered the highest network performance assessed by TPR, TNR, ACC, and BA. Table 3 lists the network performance across input–output scenarios, data sets and pathways using minimum edge detection thresholds between 40% and 60% of the possible edges among granular inputs. The penalty parameter values are approximately the same for both pathways within the data set but differed between data sets. Within region or treatment data sets, the penalty estimates overlapped across scenarios but differed between the treatment and region data sets. The estimate of the penalty parameter decreased with the threshold percentage but was generally stable between 50% and 65% thresholds. However, similar network performance was observed, indicating that the penalty parameter did not have a major impact on the final network. The threshold criteria with a minimum of 50% of possible granular edges supporting the aggregate edge provided the best performing networks (highest BA) across data sets and pathways. Therefore, the threshold of a minimum of 50% of possible edges from granular inputs was used in all subsequent analysis to identify edges among agglomerative output nodes.
 |
Table 3 Comparison of Threshold Criterion to Identify Network Edges Between Agglomerative Gene Nodes Based on Granular Transcript Isoform Input Across Data Sets for the Circadian Rhythm and Toll-Like Receptor Pathways |
The optimal penalty parameter values were identified using the network performance criteria also used to determine the optimal threshold values (TPR, TNR, ACC, and BA) for the six input–output scenarios, four data sets and two pathways (Table 4 and Supplementary Figure S1). The penalty values are a proxy for the moderation of the standardized abundance covariances of the granular input used to detect connections among the agglomerative outputs. Higher penalty values indicate that high co-expression signals among granular inputs need to be moderated to minimize false positives among output nodes. The penalty values were approximately the same for both pathways within a data set, reflecting that network characteristics had a minor impact on the optimal penalty values (Table 4). This finding indicates that the approach used to infer molecular relationships was unbiased by the size or connectivity of the network. The application of these findings to more extreme network features necessitates further exploration.
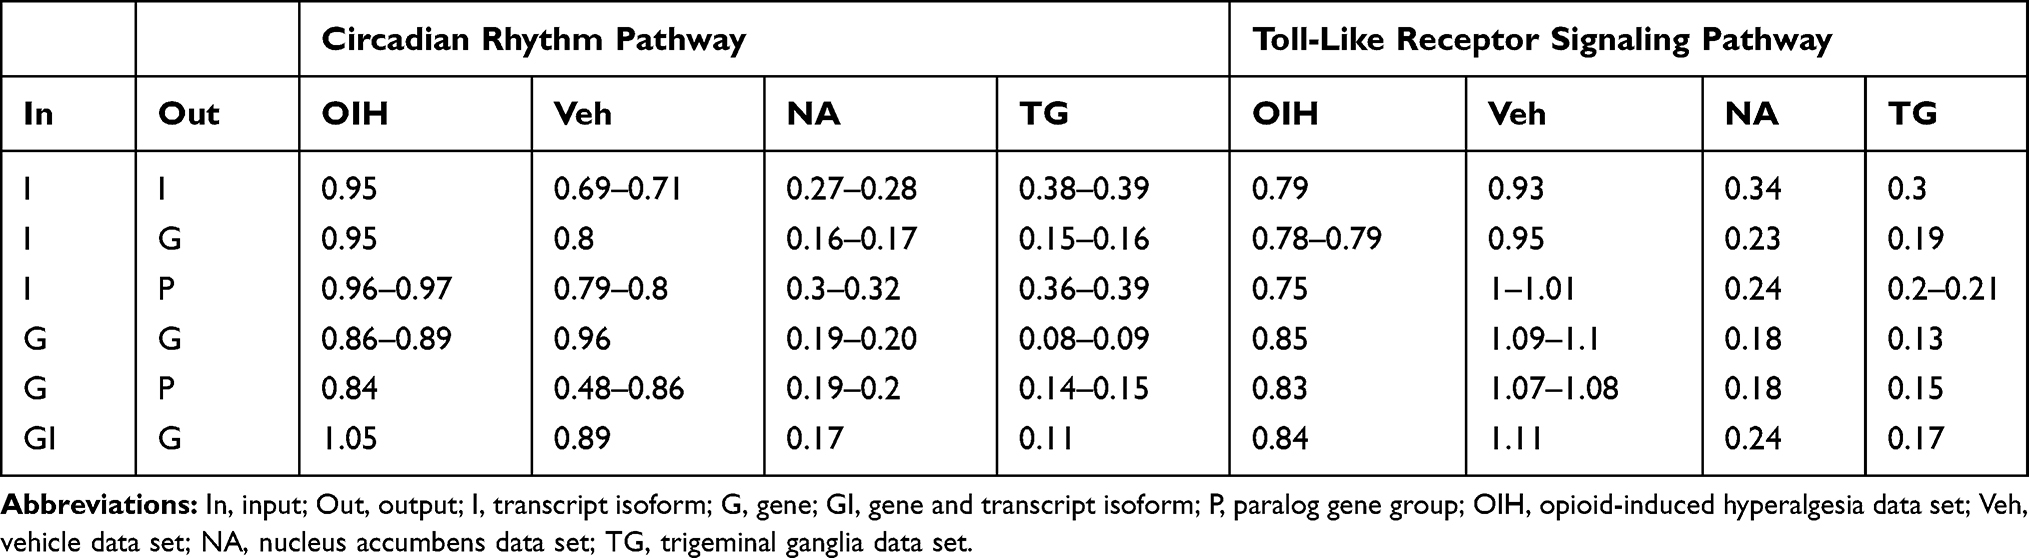 |
Table 4 Optimal Penalty Values Corresponding to the Best Performing Networks According to the Input and Output Scenarios by Pathway and Data Set Studied |
The study of estimated optimal penalty values across network input–output scenarios (Table 4) confirmed expectations that optimal network parameters were impacted by the information used to infer the network and the type of inferred network nodes. Among the input types considered, higher granularity levels (ie, transcript isoform) necessitated higher penalty values than lower granularity levels, suggesting a higher propensity to support edges not annotated in the reference KEGG pathway. Consistent with this finding, higher agglomeration levels (ie, paralog gene group) among the network outputs required lower penalty values to maximize the network performance.
The pattern of the estimated penalty values across data sets and pathways was more consistent between the transcript isoform and gene input for gene than for paralog gene group output scenarios (Table 4). The similarity of the penalty patterns between inputs for gene outputs relative to paralog gene group output may be related to the input–output ratios across pathways. The transcript isoform input to gene output ratio in the CR and TL pathways was similar and approximately 2.7:1. On the other hand, the gene input to paralog gene group output was 2.3:1 and 1.5:1 in the CR and TL pathways, respectively. The similarity between the transcript isoform input to gene output and gene input to paralog gene group output ratio in the CR pathway supported comparable penalty patterns across input–output scenarios, whereas the distinct ratios obscured the identification of clear patterns across scenarios in the TL pathway.
The effect of input type on the estimated optimal penalty values varied with the data set studied (Table 4). The estimated penalties within the region data set were lower than within the treatment data set. This trend can be related to the significant effect of treatment on the expression pattern of the genes in the pathways studied.17 The pronounced abundance covariation between inputs across treatments within a region data set was consistent with the high pathway node connectivity, and therefore lower penalties were needed to minimize false edge assignments. On the other hand, a lower consistency was detected between the abundance covariation between inputs across regions within a treatment data set and the pathway node connectivity, and higher penalties minimized false edge assignments.
For the treatment (OIH and Veh) data sets, the effect of the type of input on the estimated penalties was less definite than for the region data sets. This observation is consistent with the higher estimated penalty levels for the region data sets that approached the lower penalty limit of zero. For the region (TG and NA) data sets, the lower estimated penalty levels corresponded to weaker covariances. The estimated penalties for gene input were lower than for transcript isoform input scenarios and the penalties for transcript isoform and gene input were intermediate to the other inputs. This pattern follows the strength of the profile covariances to support edge assignment, and suggests that transcript isoform input could offer stronger edge inference than gene input information.
The effect of output type on the estimated penalty values varied with the data set studied (Table 4). For the treatments data sets that present high penalty values due to the more variable abundances across regions within a treatment data set, the output agglomeration (eg, gene output from transcript isoform input, or paralog gene group from gene input) had a minor impact on the estimated penalties because of the similar strength of the inputs. For the region data sets that present low penalty values, penalties from outputs that agglomerate inputs (eg, gene output from transcript isoform input) were lower than from non-agglomerating outputs (eg, transcript isoform output from transcript isoform input) suggesting that agglomeration provides more robust edge assignments, therefore requiring lower penalty values. Also, the agglomeration of paralog gene group output from gene input has similar penalties as non-agglomeration gene output from gene input, likely because the networks included few gene clusters, and the paralog gene group were made mostly of two to three genes, whereas the transcript isoform input to gene output ratio was higher.
The magnitude of the estimated penalty values was a function of the magnitude of the covariances between input abundance profiles and of the magnitude of the profile variability to support the edges in the KEGG database. More extreme (positive or negative) abundance covariances and higher abundance variances in a data set required higher penalty parameter values to control false edge assignments. Table 5 summarizes the distribution of correlation values across each pathway, data set and input granularity. Extreme co-expression patterns and high abundance variance were observed in the treatment data sets and input types for both pathways. The treatment data sets in the CR pathway using the transcript isoform input had the lowest node correlation first quartile of all combinations of data sets and pathways. The treatment data sets also tended to have a higher correlation third quartile relative to the region data sets regardless of the input type.
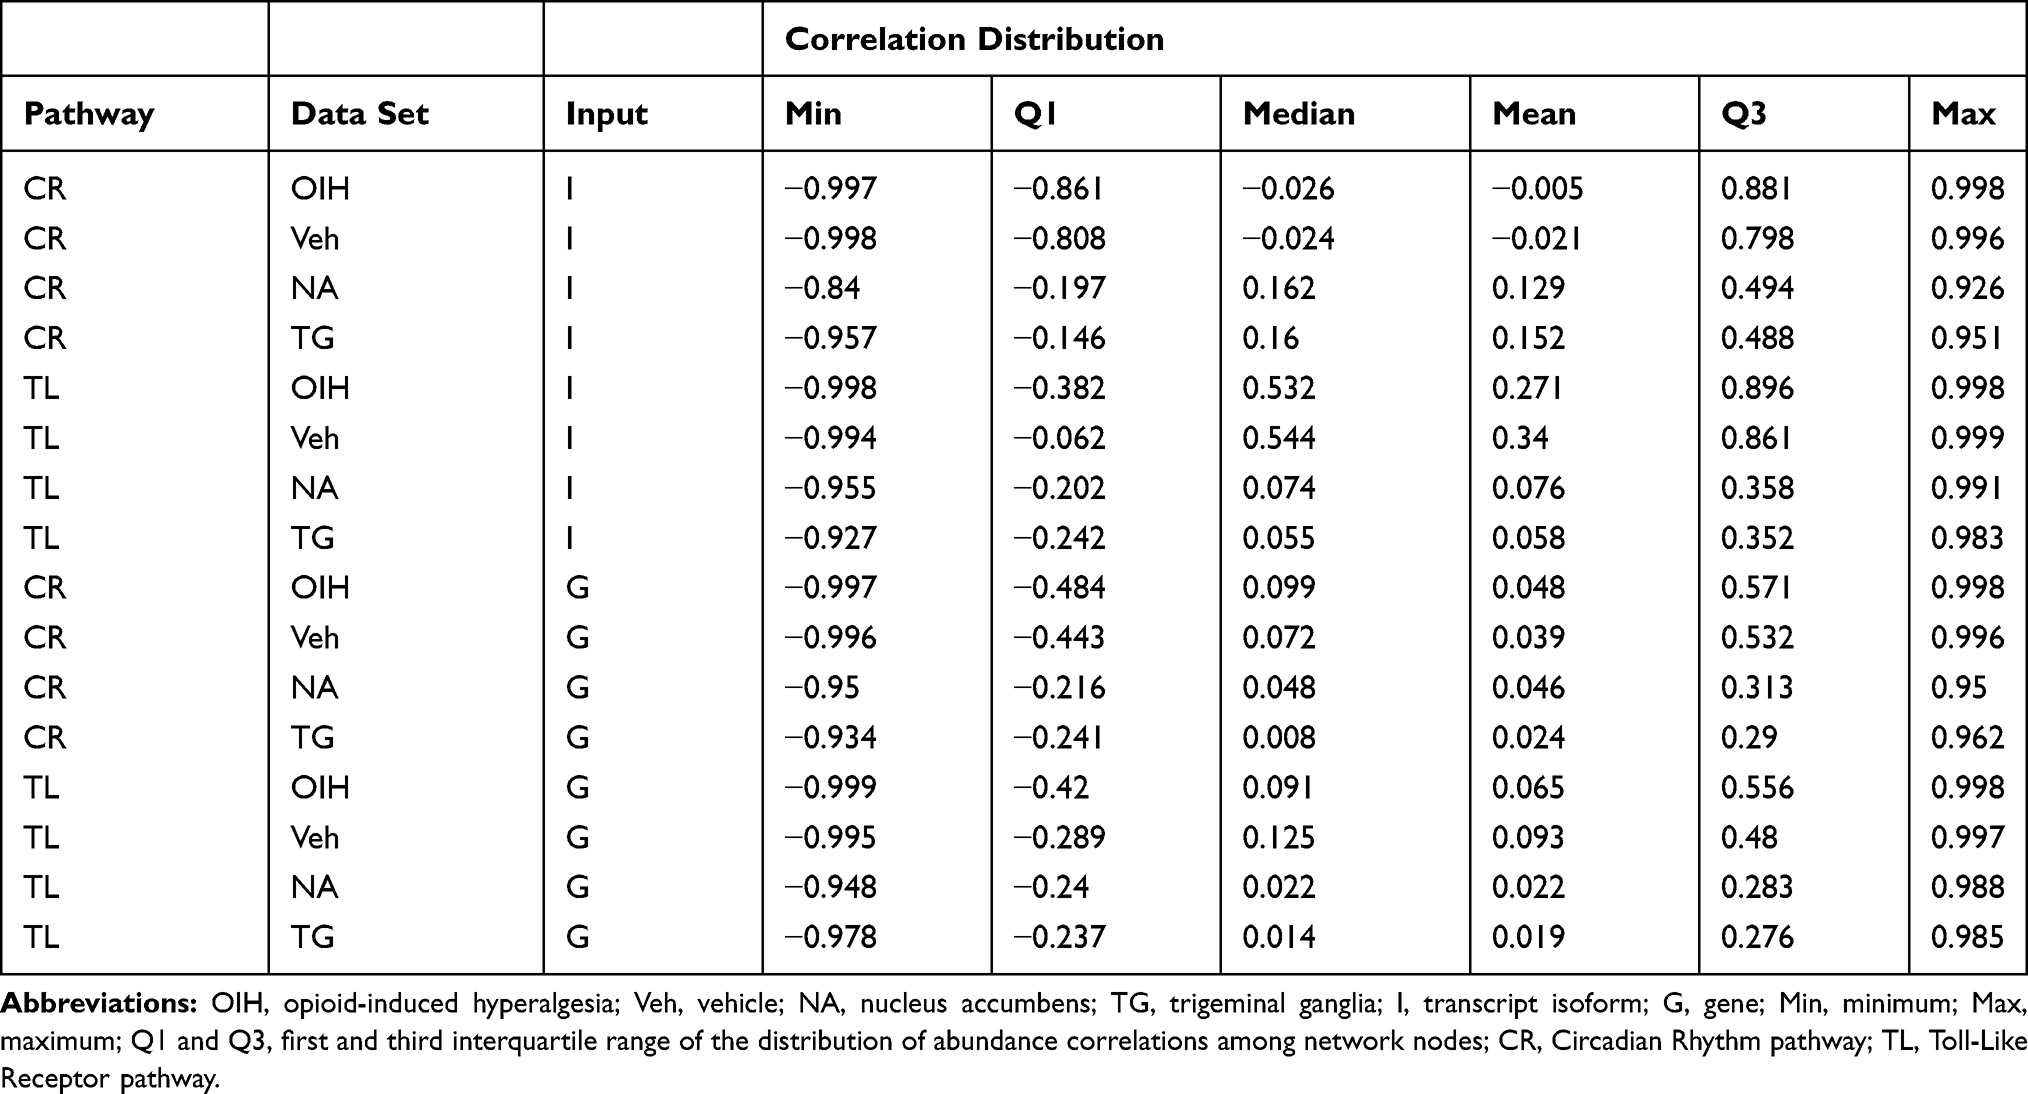 |
Table 5 Distribution of Correlation Value in the Circadian Rhythm and Toll-Like Receptor Pathways with Different Input Types Across the Treatment and the Central Nervous System Region Data Sets |
The more extreme co-expression patterns were evidenced by thicker tails on the abundance correlation distribution (more extreme correlation values). In the CR pathway, the stronger correlations within the treatment data set were evidenced in the more extreme quartile values (Table 5). In the TL pathway, the stronger co-expression patterns that occurred within the treatment data set were evidenced by a more extreme median correlation values. Conversely, weaker co-expression patterns occurred within region data sets as evidenced by the less extreme quartiles of correlation values.
The distribution of the abundance correlations for different levels of input granularity also offered insights into the impact of the input scenarios on the penalty values. The lower abundance variability between treatments within the region data set was associated with lower lambda penalty estimated within region data sets than within treatment data sets. Moreover, the abundance interquartile range was lower when using gene than transcript isoform inputs. These results reflect that the estimated sparse precision matrix is a function of the lambda estimate, the empirical covariance matrix, and therefore of the distribution of the input correlations.
Networks of genes from transcript isoforms inputs in CR were visualized in Figures 5–8. The CR pathway includes 30 genes from 13 paralog gene groups: Cry1 and Cry2 belong to cryptochromes (CRY) gene group; Per1, Per2, and Per3 are in period (Per) gene group; Clock and Npas2 are of Clock gene group; Rbx1, Cul1 and Skp1a are three core subunits of Skp, Cullin, F-box containing complex (SCF) gene group; Btrc and Fbxw11 belong to beta-TrCP gene group. Overall, the network inference approach was capable of detecting edges between genes, but these edges did not translate into edges between the corresponding gene groups. For example, the transcript isoform-level network of genes inferred from the NA and TG data sets included all the connections between the SCF gene group and the period gene group. The function of both CRY proteins is to slow down the clock,24 and Cry1 and Cry2 share all edges except in Figure 5. The edges between Cry1 and related gene groups were identified in the network inferred using the OIH data set. All connections with Per gene group involved were discovered only with Per2 and no connections with Per1 and Per3 in the OIH data set. The CR network visualized in Figure 6 is consistent with a better performance of the network of gene group output in the OIH data set. Among the genes in the AMPK paralog gene group, the abundance of Prkag3 was substantially lower than Prkag1 across all the samples. This difference in abundance level could impact the inference of edges connecting both genes in the group, despite the normalization of gene abundances that was implemented.
 |
Figure 5 Circadian rhythm network of gene output nodes, using (A) gene (left), or (B) transcript isoform (right) input granularity using profiles from the opioid-induced hyperalgesia data set. Red edges denote false negative connections based on the relationship from the pathway; grey edges represent true-positive connections based on the relationship from the pathway. |
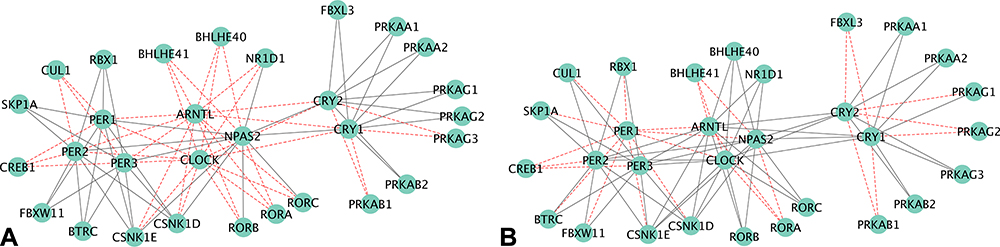 |
Figure 6 Circadian rhythm network of gene output nodes, using (A) gene (left), or (B) transcript isoform (right) input granularity using profiles from the vehicle control data set. Red edges denote false negative connections based on the relationship from the pathway; grey edges represent true-positive connections based on the relationship from the pathway. |
 |
Figure 7 Circadian rhythm network of gene output nodes, using (A) gene (left), or (B) transcript isoform (right) input granularity using profiles from the nucleus accumbens data set. Red edges denote false negative connections based on the relationship from the pathway; grey edges represent true-positive connections based on the relationship from the pathway. |
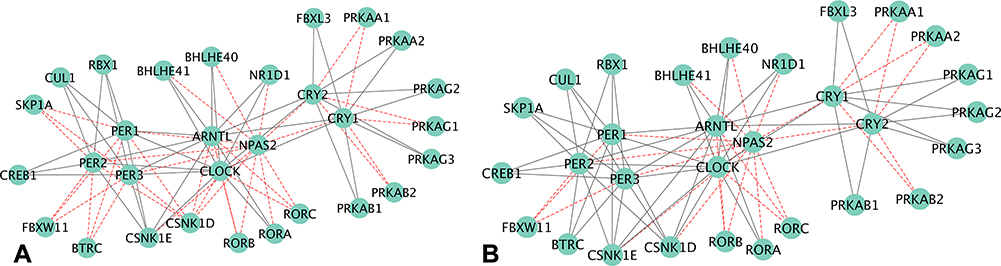 |
Figure 8 Circadian rhythm network of gene output nodes, using (A) gene (left), or (B) transcript isoform (right) input granularity using profiles from the trigeminal ganglia data set. Red edges denote false negative connections based on the relationship from the pathway; grey edges represent true-positive connections based on the relationship from the pathway. |
The performance of networks based on transcript isoform input was superior to that based on gene input profiles across all four data sets. The gene edge or connectivity using gene relative to isoform input increased by 12.7% (41 versus 47 edges detected), 16.5% (44 versus 53 edges detected), 10.1% (36 versus 40 edges detected), and 13.9% (46 versus 53 edges detected), in the OIH, Veh, NA, TG data sets, respectively. Among the genes that presented significant differential splicing (P-value <0.05 and deltaPSI >0.05) between the OIH and Veh treatments, the identification of edges connecting Arntl to other nodes improved from 0% (0 connection detected out of 13 connections in KEGG) to 92.31% (12 detected connections out of 13 connections in KEGG) when transcript isoform input profiles were used in the NA data set (Figure 7). The edge TPR for Per3 increased from 54.55% (6 detected connections out of 11 KEGG connections) to 81.82% (9 detected connections out of 11 KEGG connections) when using transcript isoform input information was used instead of gene input information in TG data set.
The comparison of the gene output network of the TL pathway using gene or transcript isoform input profiles based on the NA and TG data sets is visualized in Figure 10. Only 9 of the 50 known gene connections (18%) in the TL pathway were not detected when using transcript isoform input profiles from the NA data (Figure 9B), while 15 connections (30%) were not detected using gene input information (Figure 9A). At the individual node level, 75% and 80% of the KEGG connections with Pik3cd and Chuk undetected when using gene input information, were instead recovered when transcript isoform input information was used. This finding is in agreement with the 5% higher exon skipping detected in OIH relative to Veh in the NA region. These findings confirm the advantage of using transcript isoform input information in the inference of networks of gene nodes. The better network inference performance resulting from the use of transcript isoform input profiles is particularly impactful for experimental conditions, such as pain processing, known to be associated with splice variants.11–16
 |
Figure 9 Toll-like receptor network of gene output nodes, using (A) gene (left), or (B) transcript isoform (right) input granularity using profiles from the nucleus accumbens data set. Red edges denote false negative connections based on the relationship from the pathway; grey edges represent true positive connections based on the relationship from the pathway. |
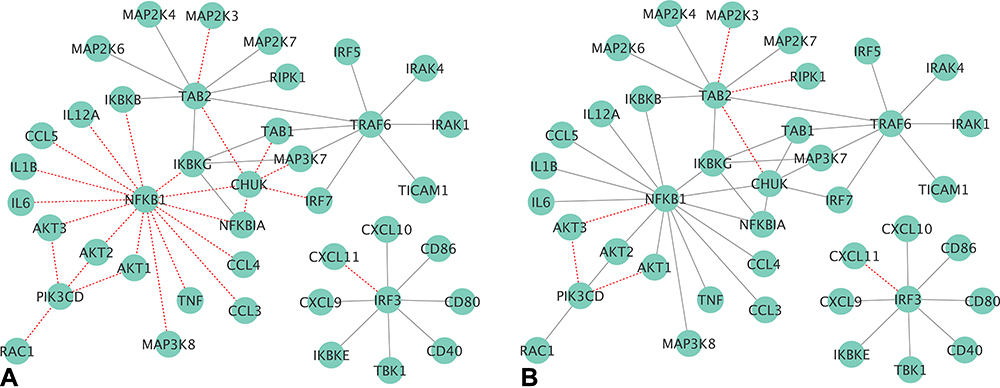 |
Figure 10 Toll-like receptor network of gene output nodes, using (A) gene (left), or (B) transcript isoform (right) input granularity using profiles from the trigeminal ganglia data set. Red edges denote false negative connections based on the relationship from the pathway; grey edges represent true positive connections based on the relationship from the pathway. |
In addition to improved detection of known connections between genes, the use of transcript isoform input information to infer gene networks lowered the false-negative rate. Among the gene networks inferred using profiles from the TG data set, 14% of the undetected connections (ie, 1- NPV, Table 6) when using transcript isoform input were false negatives while the false-negative rate (ie, 1-TPR, Table 6) was 52% when gene inputs were used. The improved performance of the network inferred from transcript isoform input was mostly attributable to the better recovery of edges connecting the genes Nfkb1, Pik3cd and Chuk. The true-positive rates for the networks inferred using OIH and Veh data were consistent across input types. Our results demonstrate that network inference using transcript isoform input is more accurate in detecting both edges and lack of connectivity among gene nodes than using gene information as input, and that the superiority of the more granular input is particularly advantageous when genes encompass alternative splicing events.
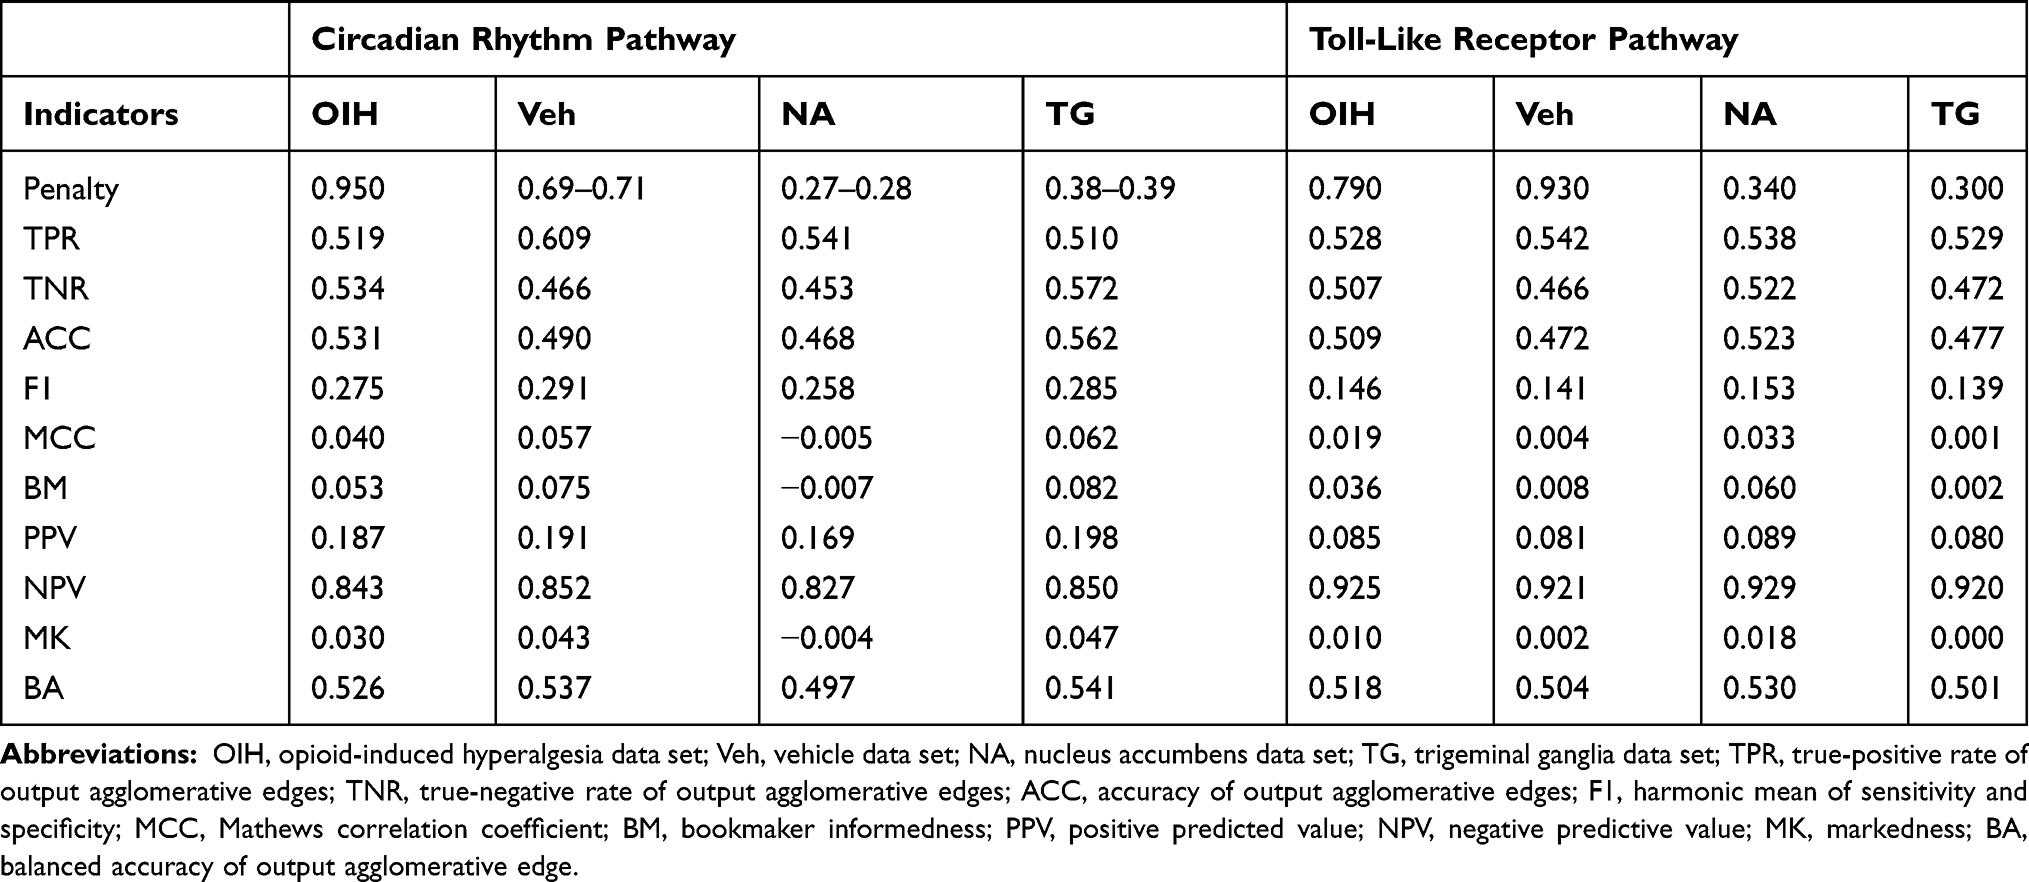 |
Table 6 Performance Indicators for the Network of Transcript Isoform Output Nodes Using Transcript Isoform Input Abundance Across the Circadian Rhythm (CR) and Toll-Like Receptor (TL) Pathways and Across the Treatment Data Sets (Opioid-Induced Hyperalgesia, and Vehicle), and the Central Nervous System Region (Nucleus Accumbens and Trigeminal Ganglia) |
A comprehensive evaluation of the network performance, comparing networks that have the same agglomerative output across input types, was undertaken. The network performance was calculated for the output-input scenarios summarized in Table 1 including, transcript isoform output from transcript isoform input (Table 6); gene output from transcript isoform input (Table 7), gene output from gene input (Table 8), gene output from combined transcript isoform and gene inputs (Table 9); paralog gene group from transcript isoform input (Table 10), and paralog gene group from gene input (Table 11).
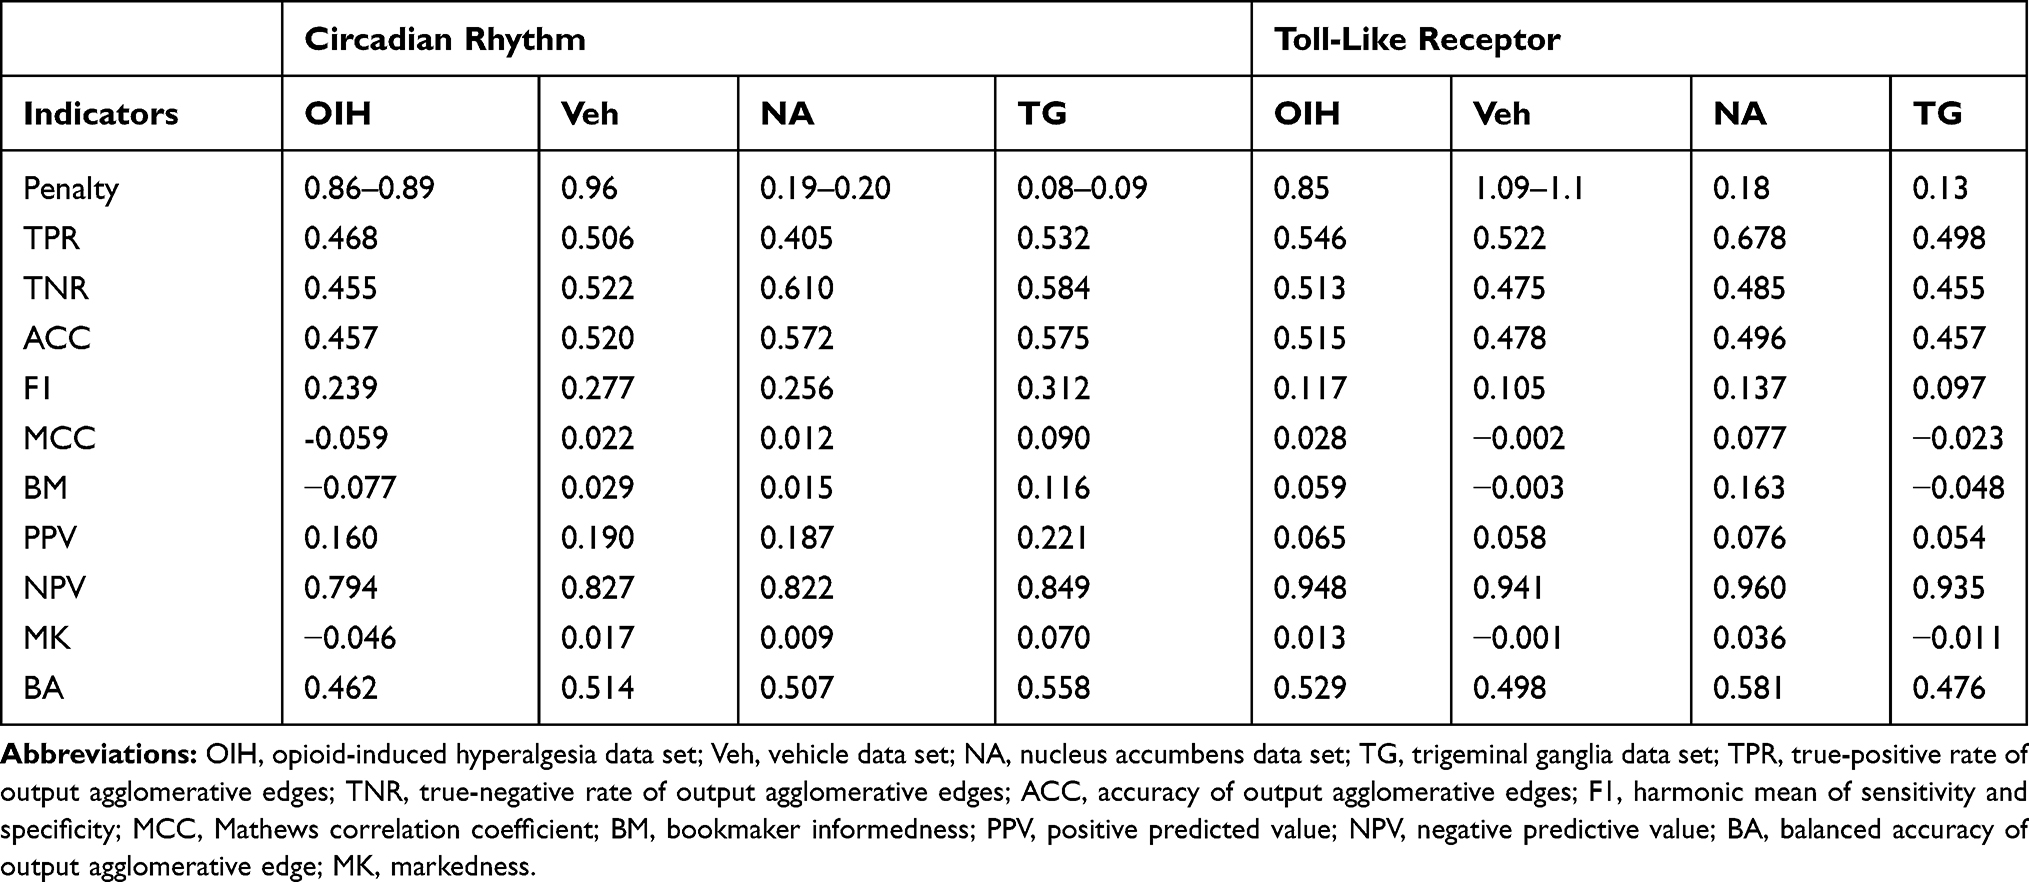 |
Table 7 Performance Indicators for the Network of Gene Output Nodes Using Gene Input Abundance Across the Circadian Rhythm (CR) and Toll-Like Receptor (TL) Pathways and Across the Treatment Data Sets (Opioid Induced Hyperalgesia, and Vehicle), and the Central Nervous System Region (Nucleus Accumbens and Trigeminal Ganglia) |
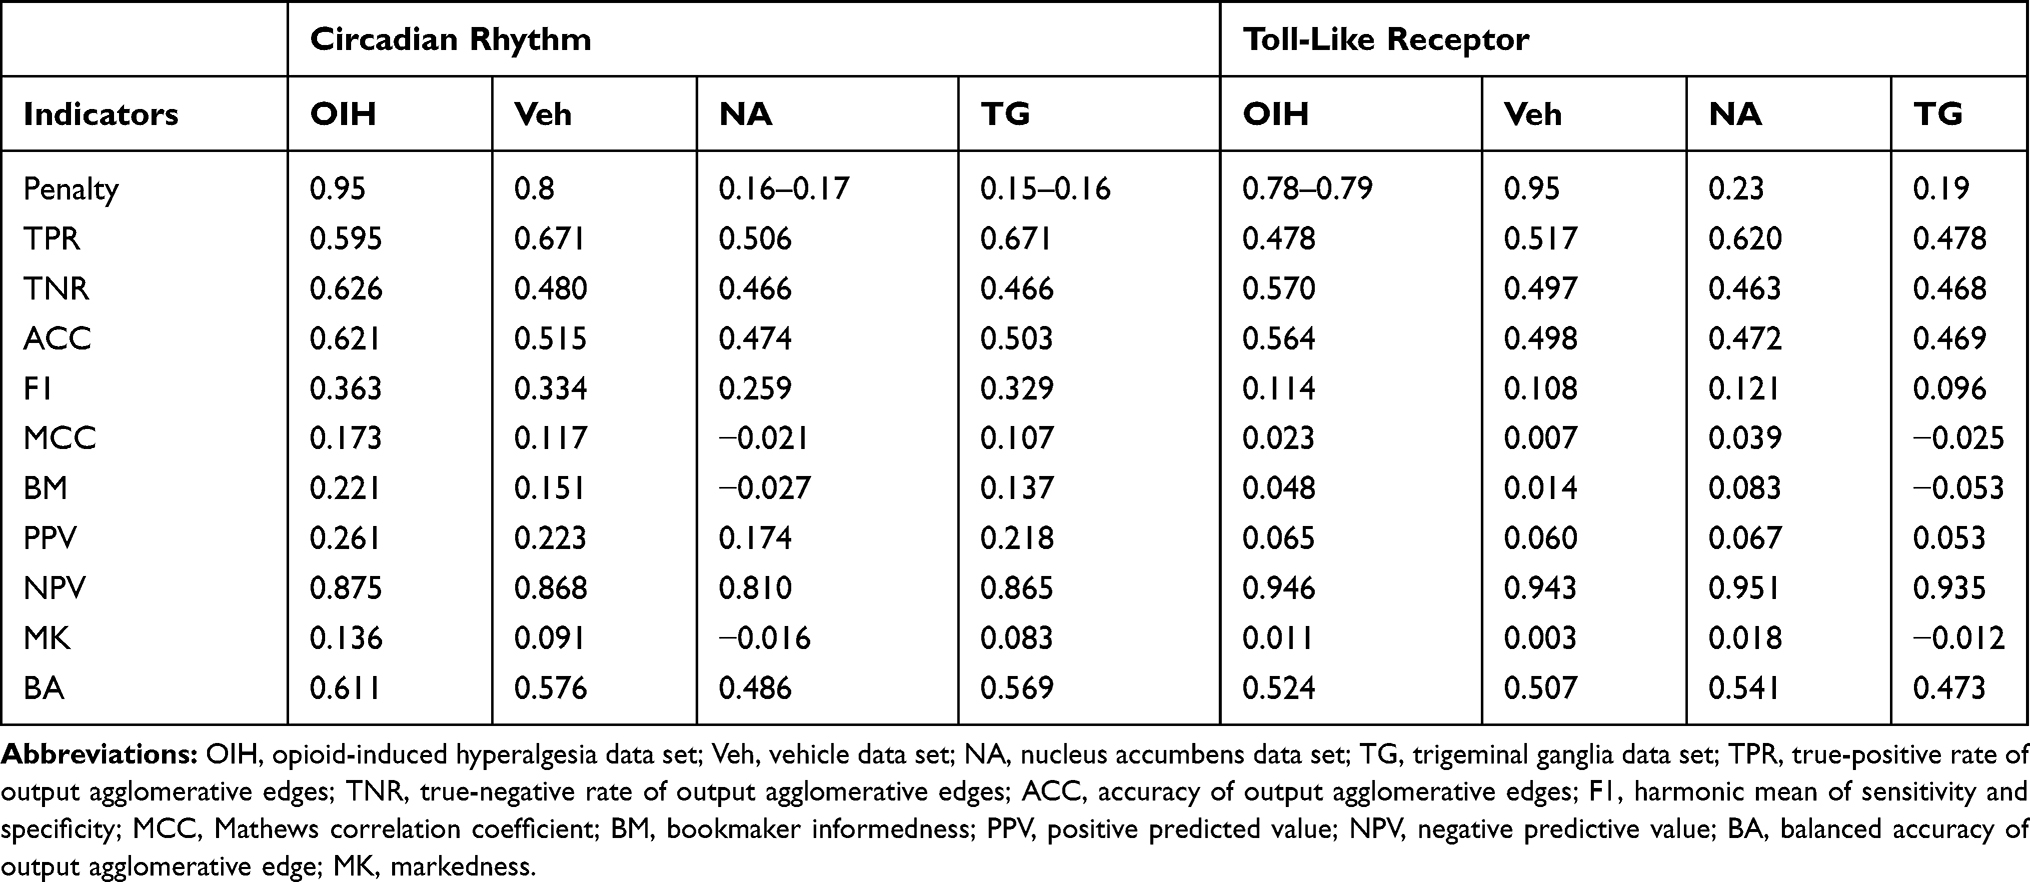 |
Table 8 Performance Indicators for the Network of Gene Output Nodes Using Combined Transcript Isoform and Gene Input Abundances Across the Circadian Rhythm (CR) and Toll-Like Receptor (TL) Pathways and Across the Treatment Data Sets (Opioid-Induced Hyperalgesia, and Vehicle), and the Central Nervous System Region (Nucleus Accumbens and Trigeminal Ganglia) |
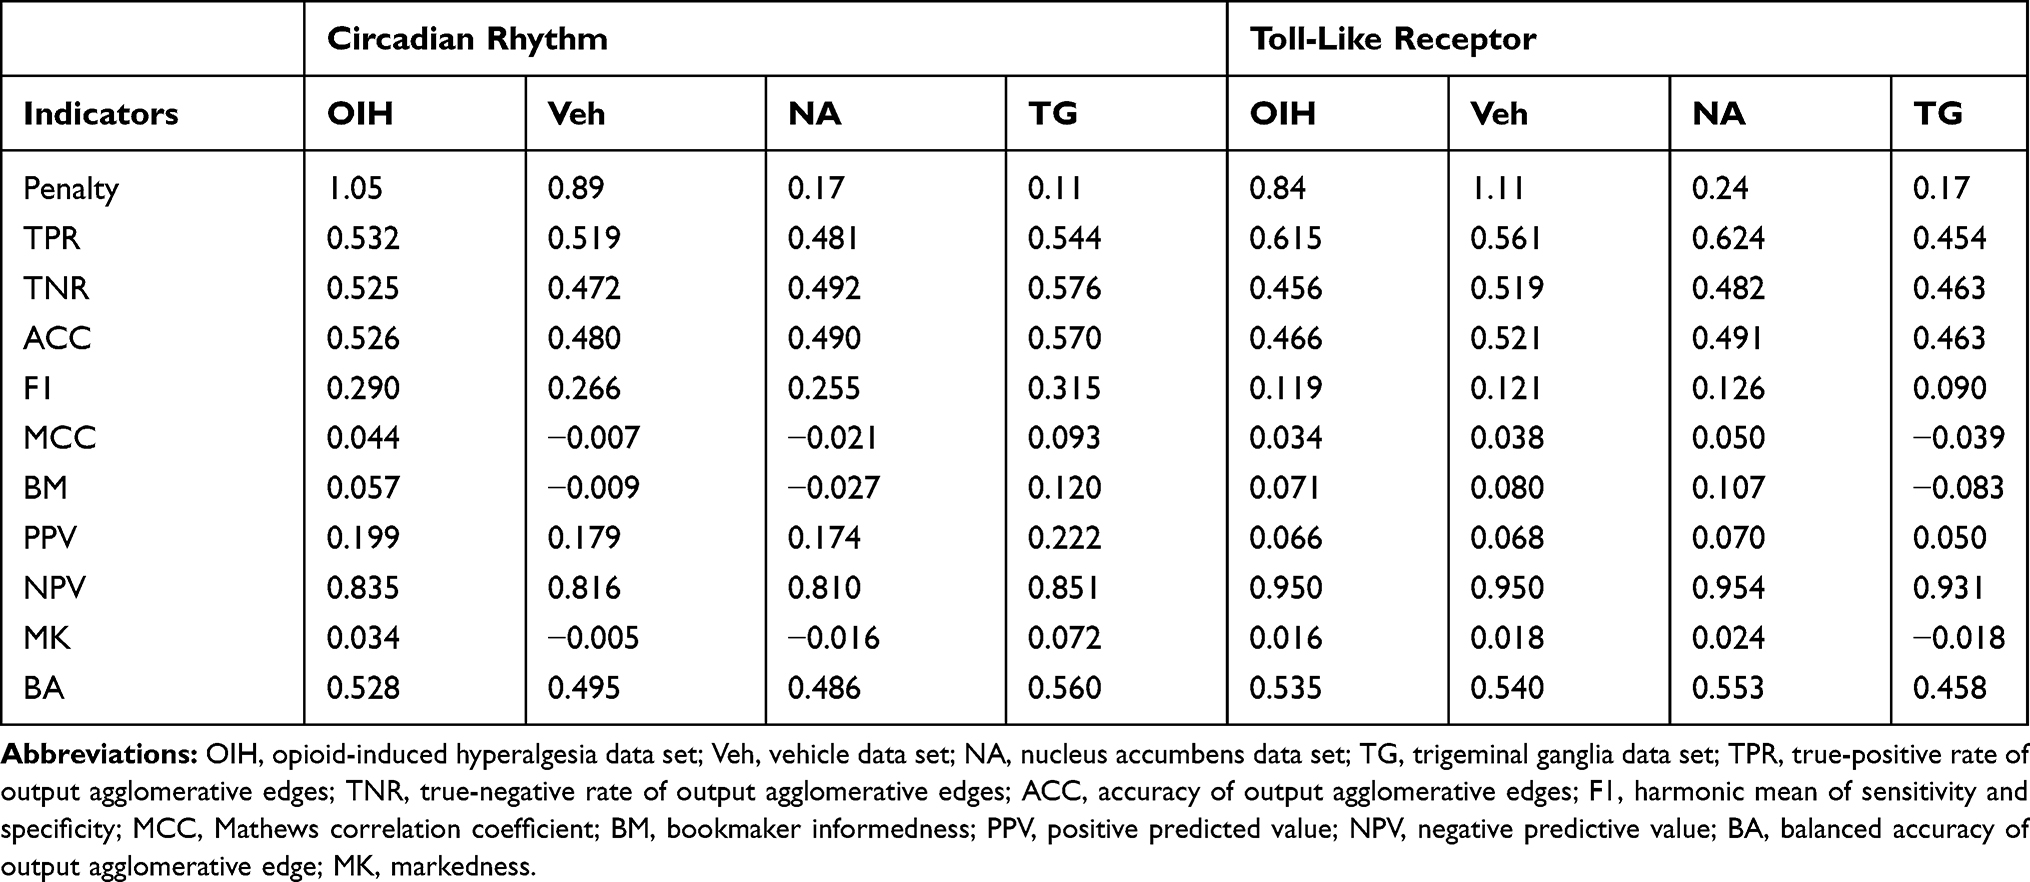 |
Table 9 Performance Indicators for the Network of Gene Output Nodes Using Transcript Isoform-Gene Input Abundance Across the Circadian Rhythm (CR) and Toll-Like Receptor (TL) Pathways and Across the Treatment (Opioid-Induced Hyperalgesia, and Vehicle), and the Central Nervous System Region (Nucleus Accumbens and Trigeminal Ganglia) Data Sets |
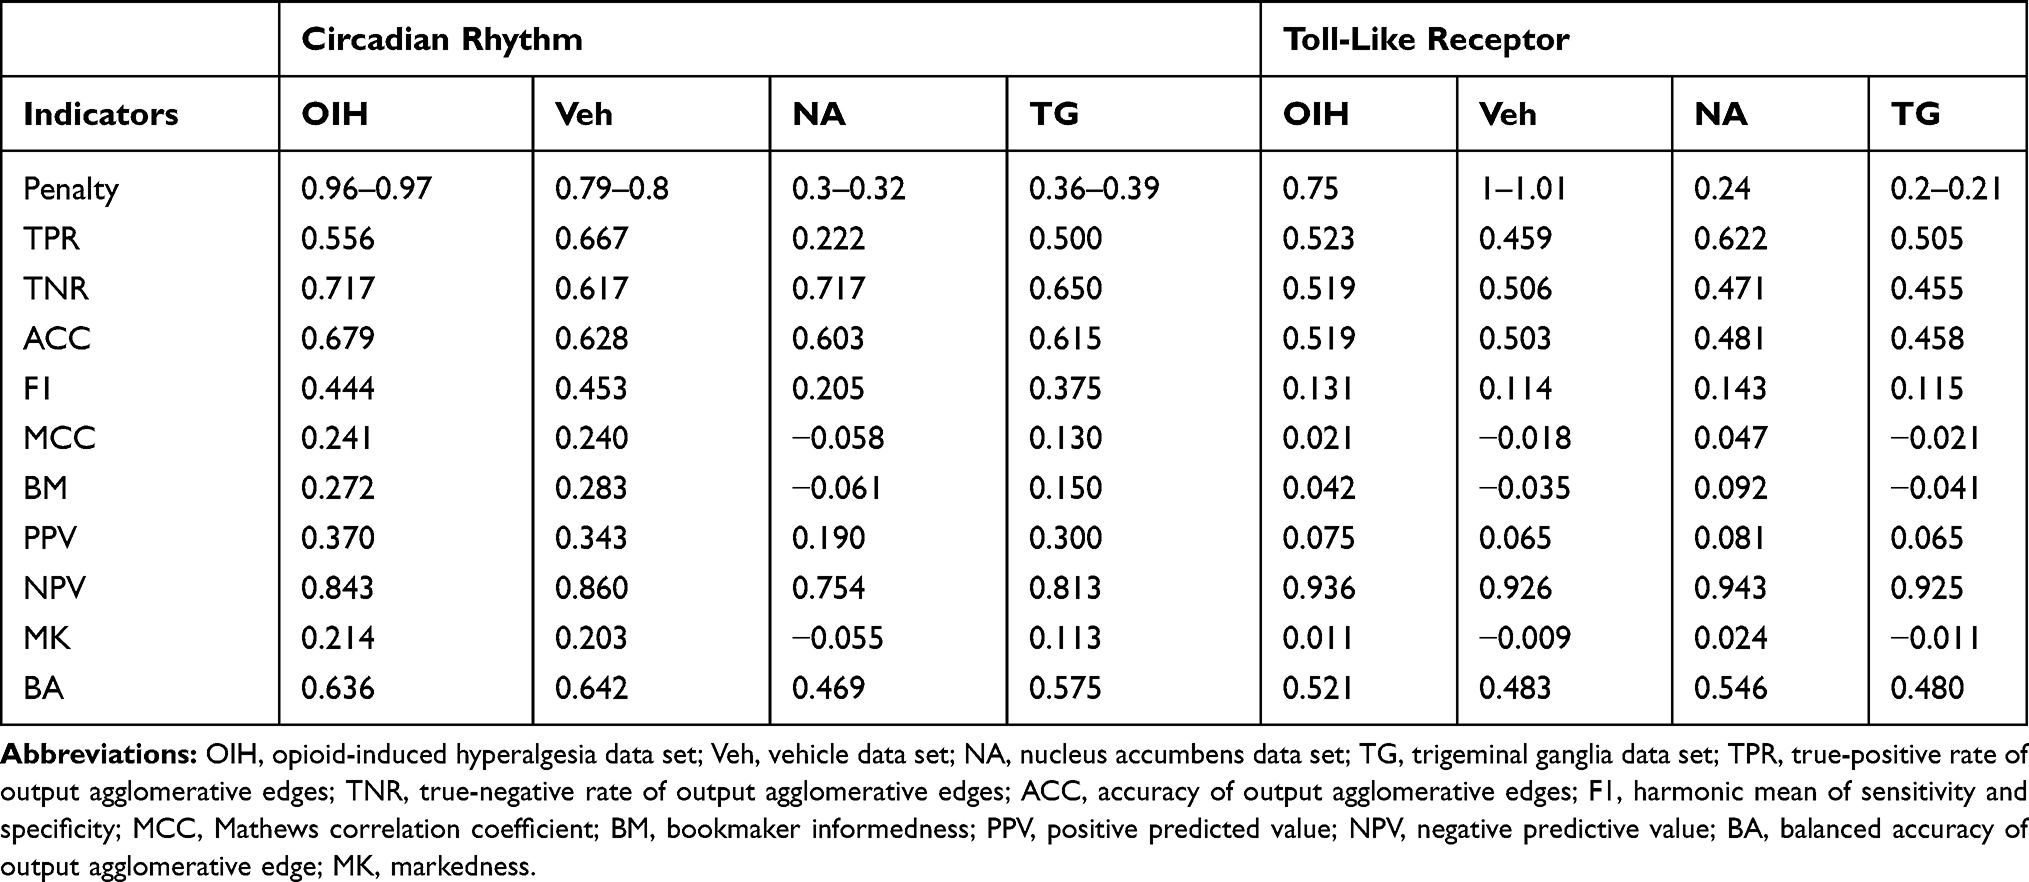 |
Table 10 Performance Indicators for the Network of Paralog Gene Group Output Nodes Using Transcript Isoform Input Abundance Across the Circadian Rhythm (CR) and Toll-Like Receptor (TL) Pathways and Across the Treatment (Opioid-Induced Hyperalgesia, and Vehicle), and the Central Nervous System Region (Nucleus Accumbens and Trigeminal Ganglia) Data Sets |
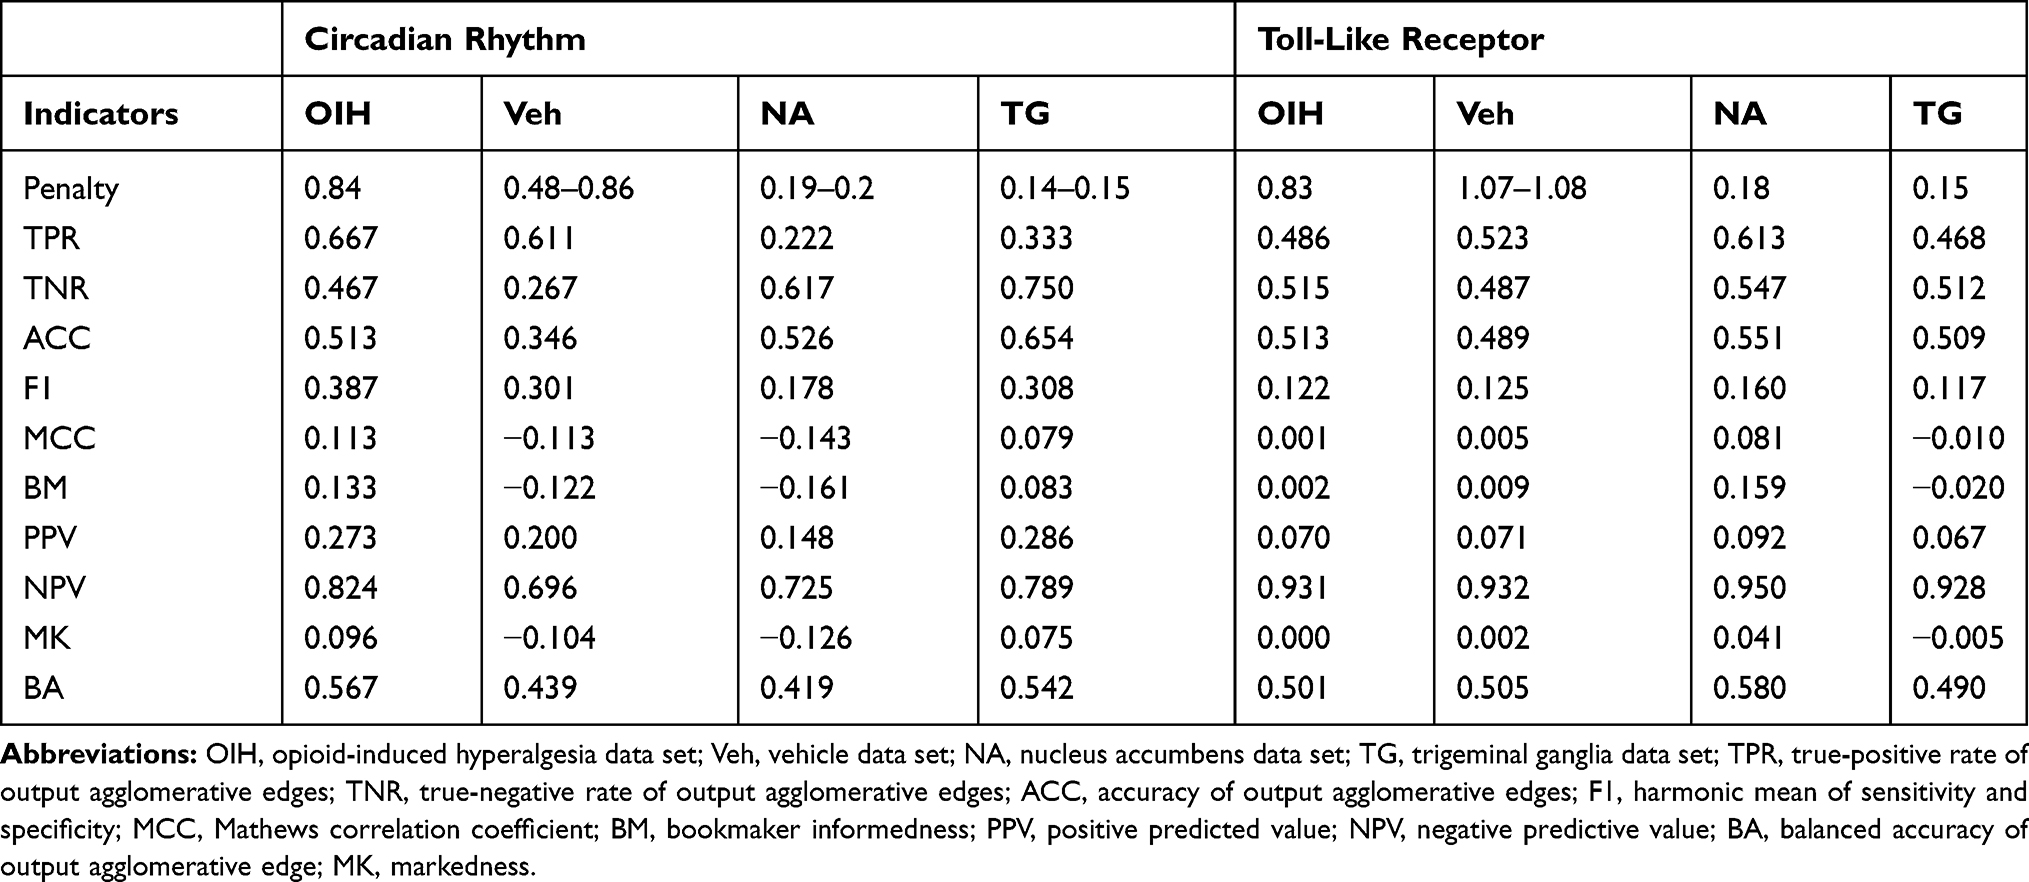 |
Table 11 Performance Indicators for a Network of Paralog Gene Group Output Nodes Using Gene Input Abundance Across the Circadian Rhythm (CR) and Toll-Like Receptor (TL) Pathways and Across the Treatment (Opioid-Induced Hyperalgesia, and Vehicle), and the Central Nervous System Region (Nucleus Accumbens and Trigeminal Ganglia) Data Sets |
The network of paralog gene group output based on transcript isoform and gene inputs provided the highest accuracy across the highest number of data sets (Tables 10 and 11). The networks of paralog gene group or gene outputs from gene input had the highest number of data sets with high specificity or TNR. The networks of gene group output from transcript isoform input provided had high TPR across most data sets.
Network modules, including genes that have significantly alternative splicing, benefited from the consideration of transcript isoform input because of the potential loss of information by accumulating individual transcript isoform abundance into a gene. The combined transcript isoform and gene input provided the highest balanced accuracy that averages TPR and TNR. The differences between the performance measures across data sets indicated that the loss of granularity in the outputs generally decreased the number of false-positive matches, albeit sometimes at the expense of true-positive matches.
An interesting finding is that the performance of the CR network when inferred from the TG data set was superior to the performance of the network inferred from the NA data set. On the other hand, the performance of the TL pathway network inferred from the NA data set outperformed the network performance from the TG data set. This result is in agreement with the unsupervised cluster patterns of gene profiles across samples in the CR pathway (Figure 1) and the TL pathway (Figure 2) in the region data sets. Also, the expression differences between OIH and Veh treatment samples for the CR genes are more significant in NA than in TG.17
The comparison of network features between data sets (OIH, Veh, NA, TG) within input–output scenario offered insights into the potential impact of OIH on two pathways and the distinct response of two central nervous system regions. The networks of gene group output closely resemble the KEGG pathway structure that connects genes and gene groups and among these, the transcript isoform input offered higher TPR (Table 11). The similar TPR that the treatment networks present relative to the region networks suggests that the combination of OIH and Veh profiles in the region networks may hinder the detection of CR and TLR relationships that the KEGG pathways rely. Furthermore, assuming that the profiles from the Veh samples are more likely to be similar to information considered in the construction of KEGG pathways, our network results suggest that the representation of some molecular interactions under OIH conditions is partly represented among the molecular connections in KEGG. This is expected in consideration that few OIH studies relative to other conditions are likely to have informed the KEGG pathways.
Additional inspection of the networks of gene groups inferred across data sets (Table 11) suggests that the TPR is more variable among the region data sets than among the treatment data sets for both KEGG pathways. Since both region data sets include even number of OIH and Veh samples, the broader range of TPRs across region data sets may support the consideration that both central nervous system regions studied are differentially impacted by OIH.17 This differential impact of OIH in both regions (Figures 7 and 8) leads to differential alignment of the resulting networks against the reference KEGG pathway.
The overall summary of the comparison of input–output scenarios to infer networks are summarized in Table 12. In this table, a “+” denotes scenarios when the granular input outperformed the agglomerative input, “-” denotes scenarios when the agglomerative input outperformed the granular input, and “=” denotes scenarios that have comparable network performance within a 2% difference. For example, the first three rows of results in Table 11 indicate the superiority (+), comparable (=), or inferiority (-) of using the more granular transcript isoform input relative to the more aggregated gene input to infer networks of paralog gene group, for three performance indicators, PPV, NPV, and BA.
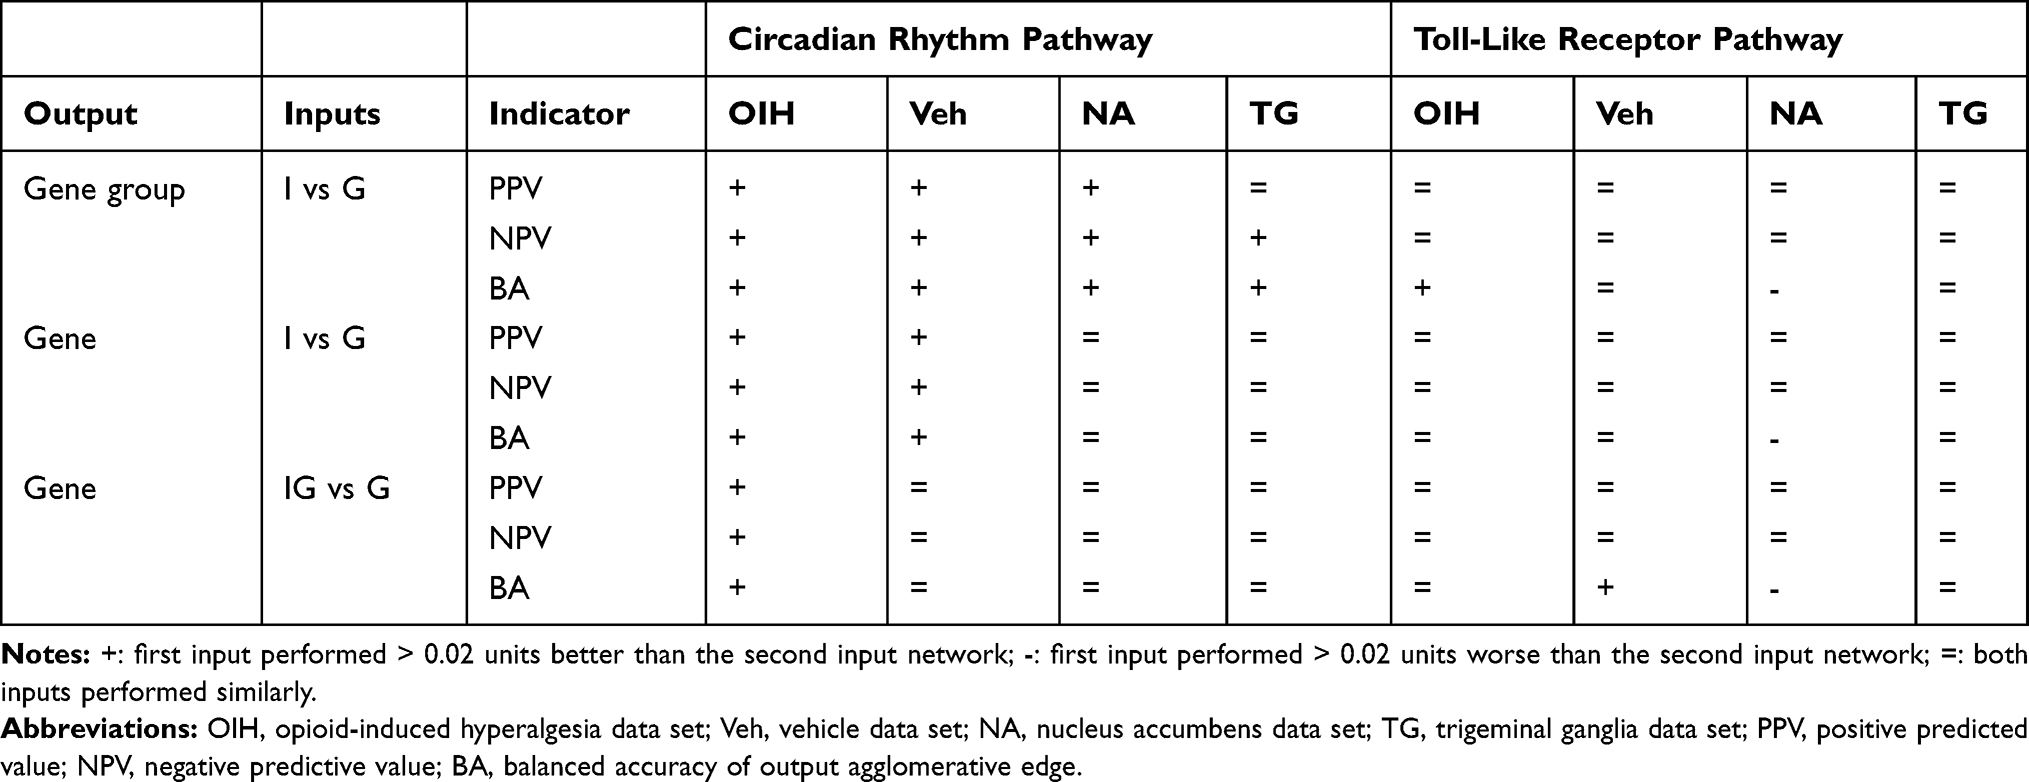 |
Table 12 The Relative Performance of the Network Inferred Using Different Inputs Including Transcript Isoform (I), Isoform-Gene (IG) and Gene (G) Abundance to Infer Networks with Different Node Outputs, Including Paralog Gene Group (GG) and Gene, Across the Circadian Rhythm (CR) and Toll-Like Receptor (TL) Pathways and Across the Treatment (Opioid-Induced Hyperalgesia, and Vehicle), and the Central Nervous System Region (Nucleus Accumbens and Trigeminal Ganglia) Data Sets |
Table 12 demonstrates that for a majority of cases, networks of agglomerative outputs (eg, gene or paralog gene group nodes) inferred using more granular information (eg, transcript isoform input) performed better than networks inferred using more aggregate information (eg, gene input). The typically higher penalty estimates from isoform inputs (Table 4) and the more spread distribution of the abundance correlations (Table 5) did not compromise the advantage of the granular input to support the inference of high-performing networks. The trends in Table 12 also confirm that the individual granular transcript isoform (or gene) correlations are less extreme in magnitude than the gene (or paralog gene group) correlations (Table 4), the agglomeration of granular correlation information using a minimum % threshold compensated the lower individual correlation levels. The consideration of a minimum percentage of weaker granular input correlations provided better performing networks than the consideration of stronger correlations at a more agglomerative level.
Conclusions
A framework to infer networks using different levels of input granularity and levels of node output agglomeration was developed. The framework included criteria to agglomerate edges reconstructed at the more granular input level and a penalization parameter to optimize edge detection. The performance of a grid of network input and output scenarios was evaluated against two reference KEGG pathways that represent different dimensionality and connectivity. The CR and TL pathways were also enriched among genes differentially expressed between samples from two treatments and across two CNS regions. Supporting the motivation to evaluate the advantage of using transcript isoform input profiles to infer networks, differential splicing events between the OIH and Veh control treatment were detected in the genes of both pathways.
Networks were estimated from transcript isoform, gene and transcript isoform combined with gene-level input profiles. The evaluated output nodes included transcript isoform, gene, and paralog gene groups. The comprehensive list of network performance indicators, including sensitivity, specificity, precision, NPV, FDR, accuracy, markedness and balanced accuracy, were considered. For the KEGG pathways and data sets studied, the best-supported edge agglomeration threshold was >50%, while the penalty estimates varied with the scenario considered. Therefore, in the absence of known molecular interactions, an evaluation of the sensitivity of the output network to the parameter specifications is granted.
A noteworthy finding is that agglomerative networks (eg, networks of gene or paralog gene node output) inferred using more granular information (eg, transcript isoform level) outperformed networks inferred using more aggregate information (eg, gene level) across the majority of the data sets and KEGG pathways studied. This improvement was traced back mainly to the edges that connected genes presenting differential alternative splicing, including Per3, Chuk, Nfkb1, and Pik3cd. Differences in the inferred network structure between data sets highlight the differences in OIH effect between central nervous system regions. Altogether, the comprehensive study of a wide range of scenarios and conditions, innovative strategy to agglomerate edges, and systemic benchmarking against a reference database enabled us to gather evidence supporting network inference based on granular information, especially when high splicing variation is involved.
Funding
This research was supported by the National Institute of Health [grant numbers P30 DA018310-14 (SRZ, BS, JS), and DA031243 (AP)], the Department of Defense [grant number PR100085 (AP)], and US Department of Agriculture NIFA [ILLU-538-909 (SR)].
Disclosure
The authors report no conflicts of interest in this work.
References
1. Yang Y, Han L, Yuan Y, Li J, Hei N, Liang H. Gene co-expression network analysis reveals common system-level properties of prognostic genes across cancer types. Nat Commun. 2014;5:3231. doi:10.1038/ncomms4231
2. Xiao X, Moreno-Moral A, Rotival M, Bottolo L, Petretto E. Multi-tissue analysis of co-expression networks by higher-order generalized singular value decomposition identifies functionally coherent transcriptional modules. PLoS Genet. 2014;10(1):e1004006. doi:10.1371/journal.pgen.1004006
3. Piro RM, Ala U, Molineris I, et al. An atlas of tissue-specific conserved coexpression for functional annotation and disease gene prediction. Eur J Hum Genet. 2011;19(11):1173–1180. doi:10.1038/ejhg.2011.96
4. Stuart JM, Segal E, Koller D, Kim SK. A gene-coexpression network for global discovery of conserved genetic modules. Science. 2003;302(5643):249–255. doi:10.1126/science.1087447
5. Iancu OD, Colville A, Oberbeck D, Darakjian P, McWeeney SK, Hitzemann R. Cosplicing network analysis of mammalian brain RNA-Seq data utilizing WGCNA and Mantel correlations. Front Genet. 2015;6:174. doi:10.3389/fgene.2015.00174
6. Li HD, Menon R, Eksi R, et al. A network of splice isoforms for the mouse. Sci Rep. 2016;6:24507. doi:10.1038/srep24507
7. Tseng YT, Li W, Chen CH, et al. IIIDB: a database for isoform-isoform interactions and isoform network modules. BMC Genomics. 2015;16(Suppl 2):S10. doi:10.1186/1471-2164-16-S2-S10
8. Kanehisa M, Goto S, Furumichi M, Tanabe M, Hirakawa M. KEGG for representation and analysis of molecular networks involving diseases and drugs. Nucleic Acids Res. 2010;38(Database issue):D355–60. doi:10.1093/nar/gkp896.
9. Stark C, Breitkreutz BJ, Reguly T, Boucher L, Breitkreutz A, Tyers M. BioGRID: a general repository for interaction datasets. Nucleic Acids Res. 2006;34(Database issue):D535–9. doi:10.1093/nar/gkj109
10. Saha A, Kim Y, Gewirtz ADH, et al. Co-expression networks reveal the tissue-specific regulation of transcription and splicing. Genome Res. 2017;27(11):1843–1858. doi:10.1101/gr.216721.116
11. Donaldson LF, Beazley-Long N. Alternative RNA splicing: contribution to pain and potential therapeutic strategy. Drug Discov Today. 2016;21(11):1787–1798. doi:10.1016/j.drudis.2016.06.017.
12. Chakrabarti S, Liu NJ, Gintzler AR. Relevance of mu-opioid receptor splice variants and plasticity of their signaling sequelae to opioid analgesic tolerance. Cell Mol Neurobiol. 2020. doi:10.1007/s10571-020-00934-y
13. Chakrabarti S, Liu NJ, Gintzler AR. Phosphorylation of unique C-terminal sites of the mu-opioid receptor variants 1B2 and 1C1 influences their Gs association following chronic morphine. J Neurochem. 2020;152(4):449–467. doi:10.1111/jnc.14863
14. Tooke K, Girard B, Vizzard MA. Functional effects of blocking VEGF/VEGFR2 signaling in the rat urinary bladder in acute and chronic CYP-induced cystitis. Am J Physiol Renal Physiol. 2019;317(7):F43–F51. doi:10.1152/ajprenal.00083.2019
15. Grubinska B, Chen L, Alsaloum M, et al. Rat NaV1.7 loss-of-function genetic model: deficient nociceptive and neuropathic pain behavior with retained olfactory function and intra-epidermal nerve fibers. Mol Pain. 2019;15:1744806919881846. doi:10.1177/1744806919881846
16. Upadhyay U, Zhuang GZ, Diatchenko L, et al. Profound analgesia is associated with a truncated peptide resulting from tissue specific alternative splicing of DRG CA8-204 regulated by an exon-level cis-eQTL. PLoS Genet. 2019;15(6):e1008226. doi:10.1371/journal.pgen.1008226
17. Zhang P, Moye LS, Southey BR, et al. Opioid-induced hyperalgesia is associated with dysregulation of circadian rhythm and adaptive immune pathways in the mouse trigeminal ganglia and nucleus accumbens. Mol Neurobiol. 2019;56(12):7929–7949. doi:10.1007/s12035-019-01650-5
18. Kanehisa M, Goto S. KEGG: kyoto encyclopedia of genes and genomes. Nucleic Acids Res. 2000;28(1):27–30. doi:10.1093/nar/28.1.27
19. Congdon P. Gaussian Markov random fields: theory and applications. J Royal Statistical Society Series A-Statistics Society. 2007;170:858. doi:10.1111/j.1467-985X.2007.00485_8.x
20. Schafer J, Strimmer K. An empirical Bayes approach to inferring large-scale gene association networks. Bioinformatics. 2005;21(6):754–764. doi:10.1093/bioinformatics/bti062
21. Scheinberg K, Rish I. Learning sparse Gaussian Markov networks using a greedy coordinate ascent approach Machine Learning Knowledge Discovery Databases, Pt III 2010;6323(196–212).
22. Friedman J, Hastie T, Tibshirani R. Sparse inverse covariance estimation with the graphical lasso. Biostatistics. 2008;9(3):432–441. doi:10.1093/biostatistics/kxm045
23. Hsieh CJ, Sustik MA, Dhillon IS, Ravikumar P. QUIC: quadratic approximation for sparse inverse covariance estimation. J Mach Learn Res. 2014;15(2911–47).
24. Patch Iii RK, Eldrige JS, Moeschler SM, Pingree MJ. Dexmedetomidine as part of a multimodal analgesic treatment regimen for opioid induced hyperalgesia in a patient with significant opioid tolerance. Case Rep Anesthesiol. 2017;2017:9876306. doi:10.1155/2017/9876306
25. Hayhurst CJ, Durieux ME. Differential opioid tolerance and opioid-induced hyperalgesia: a clinical reality. Anesthesiology. 2016;124(2):483–488. doi:10.1097/ALN.0000000000000963
26. Andrews S. FastQC: a quality control tool for high throughput sequence data. Available from: http://www.bioinformatics.babraham.ac.uk/projects/fastqc. Accessed January 28, 2021.
27. Dobin A, Davis CA, Schlesinger F, et al. STAR: ultrafast universal RNA-seq aligner. Bioinformatics. 2013;29(1):15–21. doi:10.1093/bioinformatics/bts635
28. Frankish A, Diekhans M, Ferreira AM, et al. GENCODE reference annotation for the human and mouse genomes. Nucleic Acids Res. 2019;47(D1):D766–D73. doi:10.1093/nar/gky955
29. Li B, Dewey CN. RSEM: accurate transcript quantification from RNA-Seq data with or without a reference genome. BMC Bioinform. 2011;12:323. doi:10.1186/1471-2105-12-323
30. Shannon P, Markiel A, Ozier O, et al. Cytoscape: a software environment for integrated models of biomolecular interaction networks. Genome Res. 2003;13(11):2498–2504. doi:10.1101/gr.1239303
31. Xing W, Busino L, Hinds TR, et al. SCF (FBXL3) ubiquitin ligase targets cryptochromes at their cofactor pocket. Nature. 2013;496(7443):64–68. doi:10.1038/nature11964
32. St John PC, Hirota T, Kay SA, Doyle FJ
33. Yang WL, Wang J, Chan CH, et al. The E3 ligase TRAF6 regulates Akt ubiquitination and activation. Science. 2009;325(5944):1134–1138. doi:10.1126/science.1175065
34. Wang Z, Zhang YH, Guo C, et al. Tetrathiomolybdate treatment leads to the suppression of inflammatory responses through the TRAF6/NFkappaB pathway in LPS-stimulated BV-2 microglia. Front Aging Neurosci. 2018;10:9. doi:10.3389/fnagi.2018.00009;.
 © 2021 The Author(s). This work is published and licensed by Dove Medical Press Limited. The
full terms of this license are available at https://www.dovepress.com/terms
and incorporate the Creative Commons Attribution
- Non Commercial (unported, 3.0) License.
By accessing the work you hereby accept the Terms. Non-commercial uses of the work are permitted
without any further permission from Dove Medical Press Limited, provided the work is properly
attributed. For permission for commercial use of this work, please see paragraphs 4.2 and 5 of our Terms.
© 2021 The Author(s). This work is published and licensed by Dove Medical Press Limited. The
full terms of this license are available at https://www.dovepress.com/terms
and incorporate the Creative Commons Attribution
- Non Commercial (unported, 3.0) License.
By accessing the work you hereby accept the Terms. Non-commercial uses of the work are permitted
without any further permission from Dove Medical Press Limited, provided the work is properly
attributed. For permission for commercial use of this work, please see paragraphs 4.2 and 5 of our Terms.