
Back to Journals » International Journal of Nanomedicine » Volume 20
Enhanced Everolimus Delivery: Development and Evaluation of a Nanosuspension Formulation
Authors Zeng Q  , Chen J, Zhang H, Yu W , Xu H, Wang Q , Tang Z
Received 20 August 2025
Accepted for publication 15 December 2025
Published 31 December 2025 Volume 2025:20 Pages 16149—16165
DOI https://doi.org/10.2147/IJN.S562002
Checked for plagiarism Yes
Review by Single anonymous peer review
Peer reviewer comments 2
Editor who approved publication: Dr Kamakhya Misra
Qiao Zeng,1,* Jie Chen,1,* Han Zhang,1,* Wenying Yu,1,2 Haonan Xu,1 Qiao Wang,1,2 Zhan Tang1,2
1School of Pharmacy, Hangzhou Medical College, Hangzhou, Zhejiang, People’s Republic of China; 2Key Laboratory of Neuropsychiatric Drug Research of Zhejiang Province, Hangzhou Medical College, Hangzhou, Zhejiang, People’s Republic of China
*These authors contributed equally to this work
Correspondence: Qiao Wang, School of Pharmacy, Hangzhou Medical College, Hangzhou, Zhejiang, 310013, People’s Republic of China, Email [email protected] Zhan Tang, School of Pharmacy, Hangzhou Medical College, Hangzhou, Zhejiang, 310013, People’s Republic of China, Email [email protected]
Purpose: To develop everolimus-loaded nanosuspensions (EV-sus) for the in vitro and in vivo corneal neovascularization (CNV) treatment.
Results: Everolimus was encapsulated into nanosuspensions using a solvent volatilization technique. The developed nanosuspensions exhibited a drug concentration of 0.96 mg·mL− 1, an average particle size of 141.0 ± 1.0 nm, and a zeta potential of − 12.2 ± 0.4 mV. C6-labeled EV-sus uptake by Human Corneal Epithelial Cells-Transformed (HCE-T) was time-dependent, energy-dependent, and involved multiple endocytic pathways, including caveolae- and lipid raft-mediated endocytosis, clathrin-mediated endocytosis, and caveolae-mediated endocytosis. The nanosuspensions exhibited efficacy in inhibiting VEGF-induced proliferation, migration, and tube formation in Human Umbilical Vein Endothelial Cells (HUVECs). According to RT-qPCR, the in vivo CNV model showed that EV-sus effectively reduced neovascularization, decreased vascular length and area, and diminished the expression of IL-1, IL-6, MMP-9, VEGF, and TNF-α. Additionally, the rabbit eye irritation test confirmed the safety and tolerability of the formulation.
Conclusion: These findings indicate that EV-sus might be an effective therapy for corneal neovascularization. The formulation exhibits excellent biocompatibility, efficient cellular uptake, and robust anti-angiogenic activity, suggesting its suitability for ocular administration and the potential to mitigate CNV progression with minimal irritation.
Keywords: everolimus, nanosuspensions, HUVECs, HCE-Ts, corneal neovascularization
Introduction
Located at the anterior segment of the eye, the healthy cornea, as a transparent and non-vascular tissue, is essential for maintaining visual acuity and ocular surface integrity. However, corneal neovascularization (CNV) is a disease marked by the growth of blood vessels in the normal blood vessel-free corneal tissue.1 This condition can impair corneal transparency, potentially leading to visual impairment or blindness.2 Furthermore, various factors, such as infection, inflammation, and corneal transplantation, can induce CNV, making it a significant clinical concern.3
Current pharmacological treatments for CNV include anti-inflammatory medications, immunosuppressants, and vascular endothelial growth factor (VEGF) inhibitors. Everolimus (EV), a rapamycin derivative, is a selective inhibitor of the mammalian target of rapamycin (mTOR) with potent immunosuppressive and antiproliferative effects.4 Similar to rapamycin, everolimus binds to FK506 binding protein 12 (FKBP12) intracellularly to suppress mTOR activity. This leads to decreased activity of transcription factors, disrupting the translation and synthesis of proteins that play roles in cell cycle progression, angiogenesis, and glycolysis.5 Relevant research has proven the effectiveness of everolimus in treating and preventing tuberous sclerosis,6 neuroendocrine tumors,7 and breast cancer,8 as well as in preventing rejection in both kidney9 and liver10 transplantation.
In the ocular context, research has indicated that everolimus has the potential to prevent immune rejection in corneal transplants11 and treat eye diseases like uveitis,12–14 uveal melanoma,15,16 retinal neovascularization,17 and CNV.18 In vitro research has demonstrated that everolimus is capable of suppressing the proliferation of Human Umbilical Vein Endothelial Cells (HUVECs) and decreasing the expression of Hypoxia-Inducible Factor 1 (HIF-1) and VEGF, suggesting its potential as an anti-angiogenic agent.
Everolimus is lipophilic and exhibits poor water solubility at 9.6 μg·mL−1,19 which limits its ocular application. Formulating everolimus into a nano-preparation can improve its solubility and permeability, enhancing its bioavailability. Nano-suspension, as innovative drug delivery system, has the potential to markedly improve drug solubility and bioavailability, optimizing therapeutic effects and reducing adverse reactions. In a previous study, researchers prepared EV nanosuspension (EV-sus) and conducted a comprehensive comparison with EV nanomicelles.20 The area under the concentration-time curve (AUC) of the aqueous humor drug for the nanosuspension was around three times that of the micelles in the pharmacokinetic analysis of rabbit eyes, indicating superior ocular absorption and bioavailability. Additionally, the nanosuspensions demonstrated a superior level of stability compared to micelles, a difference that was both noteworthy and crucial in the field of advanced ocular drug delivery systems.
Nevertheless, the efficacy and uptake mechanisms of EV-sus in ocular applications remain unconfirmed. To address this gap, this study conducted a series of cellular experiments, mouse models of ocular alkali burns, and rabbit eye safety assessments to establish a foundation for the development of CNV applications.
Materials and Methods
Materials
Everolimus (purity ≥ 98%) was purchased from Lunan Pharmaceutical Group Co. (Shandong, China). Poloxamer P407 was acquired from CHINEWAY (Shanghai, China). Hydroxypropyl methylcellulose (HPMC) was obtained from Sunhere Pharmaceutical Excipients Co., Ltd. (Anhui, China). Polyvinyl Alcohol (PVA) was bought from Alpha Hi-tech Pharmaceutical Co., Ltd (Jiangxi, China). Radio-Immunoprecipitation Assay (RIPA) lysis buffer and Cell Counting Kit-8 (CCK-8) were sourced from Biosharp (Anhui, China). DMEM/F12 medium, penicillin-streptomycin solution, 0.05% trypsin-EDTA, and fetal bovine serum were purchased from GIBCO (USA). 4′,6-Diamidino-2-phenylindole (DAPI) staining solution and Bicinchoninic Acid Protein Assay Kit were obtained from Beyotime Biotechnology (Shanghai, China). Coumarin 6 (C6) was supplied by J&K Scientific (Shanghai, China). Amiloride was provided by Acmec Biochemical Technology Co., Ltd (Shanghai, China). Saccharose and Indomethacin were purchased from Aladdin (Shanghai, China). Methyl-β-cyclodextrin was obtained from Binzhou Zhiyuan Bio-Technology Co., Ltd. (Shandong, China). Chlorpromazine was acquired from Dalian Meilun Biotechnology Co., Ltd (Shandong, China). Transwell inserts and Matrigel matrix were purchased from Corning (USA). Recombinant human VEGF165 was procured from GenScript (Nanjing, China). Cyclosporine A (CsA) eye drops were supplied by Xingqi Pharmaceutical Co., Ltd. (Shenyang, China). The Human Corneal Epithelial Cells-Transformed (HCE-T) were purchased from ICELL Biotechnology Co., Ltd. (Shanghai, China).
Preparation and Characterization
Everolimus nanosuspension was prepared using a solvent volatilization method as previously described.20 Briefly, PVA (0.298%, w/v) and HPMC (0.106%, w/v) were dissolved in 10 mL of distilled water at 80°C, and then allowed to cool to room temperature to obtain solution A. Concurrently, P407 (0.073%, w/v) and EV (0.1%, w/v) were dissolved in a minimal amount (1.4%, w/v) of ethanol to create solution B. Solution B was then combined with solution A, followed by stirring magnetically for 10 minutes to obtain the final EV-sus formulation. To prepare the drug-free formulation, blank nanosuspension (Blank-sus), the same method was followed without adding EV during the process. For C6-EV-sus, C6 and EV were co-loaded, EV (0.1%, w/v) was dissolved in a minimal amount of C6 ethanol solution (0.01%, w/v), and then the above method was followed to obtain the formulation.
The drug content of EV-sus was assessed through high-performance liquid chromatography (HPLC) using the analytical methods in the study.20 Specifically, 100 μL of EV-sus was combined with 3.9 mL of acetonitrile and sonicated for 10 minutes. Subsequently, the mixture was subjected to centrifugation at 10,000 rpm for 5 minutes. The supernatant was analyzed for EV content using HPLC with a C18 column (4.6 × 150 mm, 5 μm). The analysis used a mobile phase of acetonitrile and water in an 86:14 volume ratio, with a flow rate of 1 mL/min and UV detection at 277 nm. The temperature of the column oven was set to 60°C. Each sample was measured three times.
A Malvern Zetasizer Nano ZS90 was used to examine the particle size, polydispersity index (PDI), and zeta potential of EV-sus. The nanosuspension was diluted 1:10 in ultrapure water for measurement. The morphology of EV-sus was observed with the help of transmission electron microscopy (TEM) (HT7700, Hitachi, Japan).
Cellular Uptake and Mechanisms
Cytotoxicity Assay
HCE-Ts were placed at 1 × 10⁴ cells/well density and incubated for 24 h. 100 μL of EV-sus and Blank-sus, diluted in the basal medium, were added to each well, respectively. A control group containing only the basal medium was also included and incubated for 4 h or 24 h. Next, each well was added with 10 μL of CCK-8 reagent and incubated for 2 h. The optical density (OD) at 450 nm was determined by a microplate reader (Molecular Devices, SpectraMax iD5) for each well to determine cell viability. The formula was presented as follows:

Cellular Uptake
The C6 level was determined using HPLC, while the protein concentration per cell group was calculated to derive the ratio of C6 concentration to protein concentration.21 HCE-Ts were planted in 6-well plates at 2 × 10⁵cells/well density and cultured for 24 h. C6-EV-sus and C6-control were then added to the 6-well plates and incubated for 1 h or 4 h. The concentration of C6 in each group was 14 ng·mL−1. Post-incubation, the cells were subjected to 2–3 washes with cool phosphate-buffered saline (PBS). Each well received 200 μL of RIPA lysis buffer and was incubated on ice for 30 min. Subsequently, the mixture was centrifuged at 9000 rpm for 15 minutes. The supernatant was used to examine the protein levels by a BCA protein assay kit. In addition, 40 μL of the supernatant was combined with 120 μL of methanol, and the C6 concentration was determined by HPLC. The determination of C6 utilized a C18 column (Diamonsil, 4.6 mm × 150 mm, 5 μm, 201078796, Dikma) with a mobile phase of methanol and water in a 95:5 volume ratio, with a flow rate of 1.0 mL/min, a column temperature of 30°C, and excitation/emission wavelengths of 465/502 nm.
Fluorescence Microscopy Imaging
HCE-Ts (2 × 10⁵ cells/well) were inoculated in 12-well plates and incubated for 24 h. The cells were incubated with C6-EV-sus and control groups for 4 hours, respectively. After washing with cold PBS multiple times, 4% paraformaldehyde was used to fix the cells for 15 minutes. Subsequently, they were stained with DAPI for 5 minutes. The fixed cells were inverted onto slides and imaged under an inverted fluorescence microscope.22
Cellular Uptake Mechanisms
The uptake mechanism of EV-sus was investigated by the way outlined in Section Cellular uptake. Before the experiment, the cells were treated with various inhibitors of cellular transport pathways in a basal medium for 30 min (Table 1). After incubation, the cells were washed with PBS, exposed to C6-EV-sus, and further incubated for 4 hours. Subsequently, the cells were rinsed with chilled PBS, lysed, and diluted with methanol. HPLC was used to quantify the C6 content.
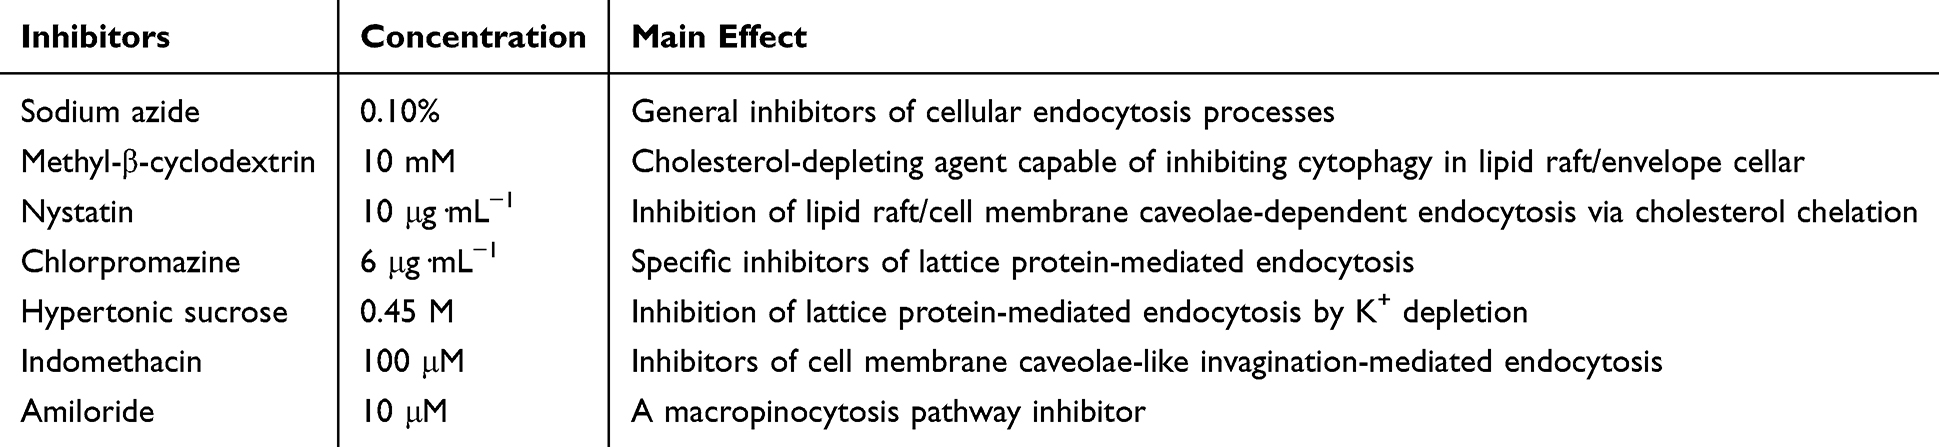 |
Table 1 Inhibitor Types and Concentrations |
CCK-8 Assay
This study investigated the influence of varying concentrations of EV-sus on the cytotoxic implications for HUVECs. The cells, seeded at 1 × 10⁴ cells/well, were incubated for 24 h. Thereafter, these cells were exposed to an array of concentrations of EV-sus for an additional 24 h. A control group that received only the basal medium was set for comparison. A subsequent 10 microliters of CCK-8 reagent was dispensed into each well, followed by a 2-hour incubation. After incubation, the OD at 450 nm was measured to determine the survival rate of HUVECs at each concentration. The viability rate of the untreated cells was adopted as the benchmark, assigning it 100% to represent the baseline level of cell vitality.
Cell Proliferation Test
The Experimental Group
The experimental design involved three groups: a control group receiving only the basal medium, a VEGF group receiving VEGF solution diluted in basal medium, and an EV-sus group receiving a mixture of EV-sus and VEGF.
CCK-8 Test
The impact of EV-sus on VEGF-induced HUVECs was assessed with the CCK-8 assay. HUVECs were planted at 1 × 10⁵ cells/well density, with four wells per group, and cultured for 24 hours. Different reagents were added according to the experimental grouping in Section The experimental group, and the culture was continued for another 24 hours. Subsequently, 100 μL of CCK-8 solution was placed into each well, and the OD value at 450 nm was determined using an ELISA reader to calculate the survival rate of HUVECs at each concentration.
Scratch Healing Test
HUVECs were cultured in six-well plates at 2 × 10⁵ cells/well. The next day, vertical lines were drawn on the rear of each 6-well plate, with three lines per well, spaced 0.5 to 1 cm apart. The wells were then rinsed with PBS 2–3 times. Reagents were added according to the experimental grouping in section The experimental group. Photographs of the wells were imaged with an inverted microscope at the 0, 12, and 24-hour marks. The healing area after scratching was analyzed using ImageJ software.23
Transwell Migration Test
The Transwell chambers were carefully transferred using sterile forceps and placed into 24-well plates. The lower chamber of each chamber was supplemented with VEGF at 20 ng·mL−1 to induce migration, while the upper chamber was infused with 1 μg·mL−1 EV-sus as an intervening agent. HUVECs (2.5 × 10⁴ cells/well) that had been starved were inoculated on the upper side and cultured for 24 h. After the treatment, the cells in the Transwell chambers were fixed with 4% paraformaldehyde for 30 min and then stained with 0.1% crystal violet solution for 10 min. Concurrently, a cotton swab was used to wipe off the non-migrated cells in the upper chamber. Cell movement was monitored by an inverted microscope, and the stained cells were counted.24,25 This experiment was conducted three times.
Cell Tube Formation Assay
A pre-cooled 96-well plate was gently coated with 50 μL of Matrigel and then incubated at 37°C to solidify into a gel. HUVECs at 2.5 × 10⁵ cells/mL were mixed into the culture medium, and different reagents were introduced according to the experimental grouping described in Section The experimental group. Subsequently, the cells were inoculated onto the substrate gel and incubated for 4 hours. The images were taken with the help of an inverted microscope. ImageJ software was used to manually count the length and quantity of tubes to assess the degree of tube formation. The experiment was repeated four times.
C57BL/6 Mice of Corneal Alkali Burns Model
The corneal alkali burn model in C57BL/6 mice was developed as described in the previous report.26 Briefly, 1% pentobarbital sodium was administered via intraperitoneal injection to anesthetize the mice. A circular filter paper with a 2 mm diameter, saturated with 2 μL of 1 M NaOH, was placed on the center of the right eye for 40 seconds. Once the corneal injury occurred, the paper was immediately taken away, and the eyes underwent a 30-second wash with saline solution. The day of modeling was recorded as day 0. Following randomization, mice were allocated into four groups (n = 10), the normal group and three experimental groups (Saline, CsA, and EV-sus). Each experimental group received 5 μL of the respective treatment via topical ocular administration.
Neovascularization Data Analysis and H&E Staining
For the measurement of CNV-associated blood vessel growth, photographic records of the anterior and lateral surfaces of the right eye corneas in anesthetized mice on days 3 and 7 post-administration were obtained using a slit-lamp biomicroscope. The images were analyzed with ImageJ software to measure the length and area of corneal neovascularization. The formula for calculating the area of neovascularization was presented as follows:

S denotes the neovascularization area; C represents the angular sector of the corneal surface occupied by the neovascularization, assuming the cornea to be a clock face; a is the length of the longest new blood vessel; r is the radius of the cornea.
After all observations, on day 7 of administration in mice, the subjects were anesthetized and subsequently euthanized via decapitation. The eyes of each group were carefully excised using ophthalmic scissors, minimizing traction during the procedure. The excised eyes were then immersed in ocular fixation fluid for 24 h, followed by dehydration and embedding in paraffin blocks. The eyes were sectioned using a microtome, dehydrated, baked, and mounted onto slides for analysis. The sections of the cornea and conjunctiva were stained with hematoxylin and eosin (H&E) and subsequently examined under a light microscope for photographic documentation.
RT-qPCR
Total RNA from the corneal tissue was meticulously extracted employing the renowned TRIzol reagent. Corneas from the right eyes of two mice within the same group were pooled as one sample. The relative expression levels of Interleukin-1 (IL-1), Interleukin-6 (IL-6), matrix metalloproteinase-9 (MMP-9), VEGF, and tumor necrosis factor-α (TNF-α) were quantified through the 2−ΔΔCT approach. The specific primer sequences are shown in Table 2.
 |
Table 2 Primer Sequences for Target and Reference Genes |
Evaluation of Rabbit Eye Irritation
The Draize test, conducted using a slit-lamp microscope (Shinova Medical CO., Ltd, SL-PC), was employed to evaluate the ocular irritation of EV-sus. In the single-dose administration experiment, 50 μL of EV-sus was administered to the left eye, while the right eye received an equivalent volume of saline. The ocular responses of rabbits were scored at 1, 2, 4, 24, 48, and 72 hours after the administration of the treatment.
In the multiple-dose administration experiment, 50 μL of EV-sus was instilled in the left eye, while the right eye received the equivalent volume of saline. Rabbit eyes were scored during administration and at specific time points post-administration.
Following the Draize test, the rabbits were anesthetized, and 50 μL of 0.1% fluorescein sodium solution was instilled into the administered eye of each rabbit. The eyes were examined and photographed under cobalt blue light. While the corneal epithelium does not stain, damaged regions appear green in speckled or scattered patterns. After euthanizing the rabbits, their eyeballs were immersed in eyeball fixation solution. After 24 hours, the tissues underwent dehydration, paraffin embedding, sectioning, and H&E staining to examine the histology of the corneal epithelium.
Statistical Analysis
All data were analyzed using GraphPad Prism 10.1.2 software. Statistical differences were evaluated using the t-test or Analysis of Variance (ANOVA). The data are presented as mean ± standard deviation (SD). Significant differences were defined according to the following conventions: ns: p ≥ 0.05, *p < 0.05, **p < 0.01, ***p < 0.001, ****p < 0.0001.
Results
Characterization of Nanosuspension
Using the previously described solvent volatilization method, we successfully developed EV-sus with a particle size of 141.0 ± 1.0 nm, a PDI of 0.099 ± 0.017, and a zeta potential of −12.2 ± 0.4 mV (Figure 1A and B). Transmission electron microscopy revealed the morphology of the nanosuspension, indicating good dispersibility and a spherical shape with a uniform particle size of approximately 100 nm (Figure 1C). The drug loading capacity of EV in EV-sus, as determined by HPLC, was 0.96 mg·mL−1. The outcomes are similar to those found in prior studies.20
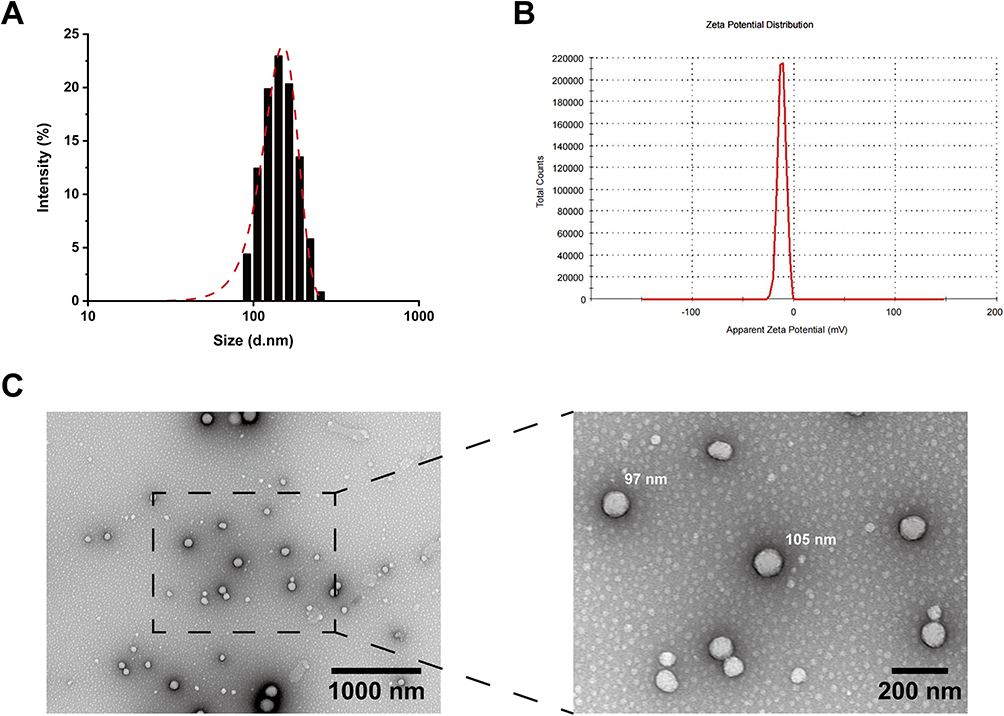 |
Figure 1 (A) Particle size determination of EV-sus. (B) Zeta potential distribution of EV-sus. (C) TEM images of EV-sus. |
Cellular Uptake
Cell Viability
The effects of the EV-sus preparation on HCE-Ts survival after 24 hours were investigated. A 1:200 dilution (5 μg·mL−1) of EV-sus had no effect on cell survival, whereas a 1:100 dilution (10 μg·mL−1) resulted in a survival rate of more than 85% (Figure 2A). The Blank-sus preparation was unaffected by a 1:10 dilution at 24 hours in terms of cell activity (Figure 2B).
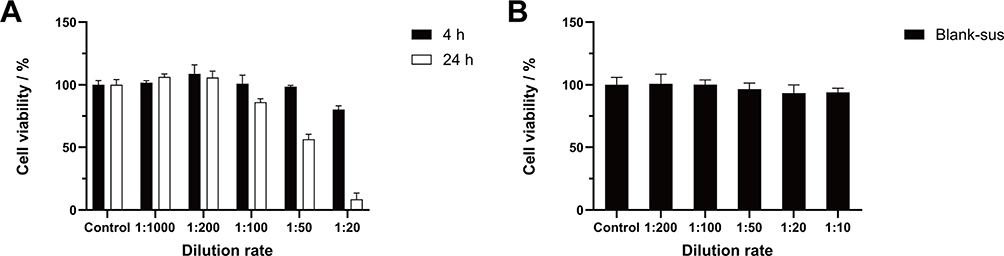 |
Figure 2 (A) HCE-Ts cytotoxicity of EV-sus within 4 and 24 h (n = 5). (B) HCE-Ts cytotoxicity of Blank-sus within 24 h (n = 5). |
HCE-Ts remained unimpaired following exposure in EV-sus at a ratio of 1:100 (10 μg·mL−1) for 4 hours (Figure 2A). Therefore, this dilution ratio was used for subsequent cell uptake assays.
Cellular Uptake
The uptake characteristics of C6-EV-sus were quantitatively investigated by HPLC. C6 peaked at approximately 3.70 min with no interference, as shown in the chromatograms of the C6-control solution, C6-EV-sus solution, and blank-sample solution (Figure 3). The HPLC standard curve was Y = 54828.123 + 231508.204X (R2 = 1.000).
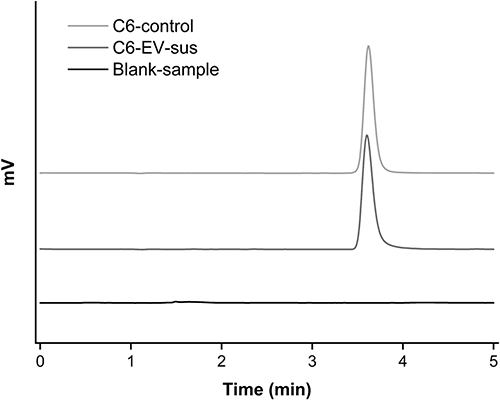 |
Figure 3 HPLC chromatograms of different samples. |
As shown in Figure 4A, the uptake of C6-EV-sus and Control exhibited a consistent increase at 4 h, with C6-EV-sus being significantly higher than Control at 1 h (p < 0.05) and 4 h (p < 0.0001).
 |
Figure 4 (A) Results of HPLC quantification of HCE-Ts uptake (n = 3). (B) Fluorescence microscopy imaging. (C) Effect of each inhibitor on cellular uptake (n = 3). ns: p ≥ 0.05,*p < 0.05, ****p < 0.0001. |
The data regarding to the precision and accuracy of the HPLC determination method are shown in Table 3. For each C6 sample, the intra- and inter-day precision values (RSD, %) were both below 4%. Additionally, the accuracy (%) was in the range of 95–105%. These results demonstrated acceptable accuracy and precision of the biological analysis.
 |
Table 3 The Precision and Accuracy Results |
Fluorescence Microscope Imaging
The results of fluorescence microscopy imaging, shown in Figure 4B, revealed that the green fluorescence of C6-EV-sus was significantly stronger than the control at 4 h, consistent with the quantitative uptake results.
Cellular Uptake Mechanisms
Compared to the control group, the uptake of C6-EV-sus exhibited a significant decrease (p < 0.0001) upon the addition of sodium azide (Figure 4C). The results suggested that the uptake of C6-EV-sus by HCE-Ts is energy-dependent.
Methyl-β-cyclodextrin effectively inhibits caveolae- and lipid raft-mediated endocytosis through its binding to cholesterol. Nystatin, a cholesterol-chelating agent, reduces the number of caveolin/lipid raft structures on the cell membrane surface, thereby effectively inhibiting caveolae- and lipid raft-mediated endocytosis. As shown, the uptake of C6-EV-sus by HCE-Ts was significantly decreased to 35.4% after treatment with methyl-β-cyclodextrin (p < 0.0001), and the uptake of C6-EV-sus by HCE-Ts was significantly reduced to 46.4% after treatment with Nystatin (p < 0.0001).
Chlorpromazine can inhibit clathrin synthesis in the cell membrane, preventing the formation of clathrin-mediated endocytic structures, and ultimately hindering the endocytosis of macromolecules. Hypertonic sucrose can also inhibit clathrin-mediated endocytosis by depleting intracellular potassium ions. After treatment with chlorpromazine, the uptake of C6-EV-sus by HCE-Ts was significantly decreased to 40.1% (p < 0.0001). Similarly, after treatment with hypertonic sucrose, the uptake of C6-EV-sus was significantly reduced to 28.6% (p < 0.0001).
Caveolae are specialized invaginated structures on the cell membrane surface, and indomethacin is an antagonist of caveolae-mediated endocytosis.27 It likely exerts this inhibitory effect by interfering with the internalization process of caveolae through affecting the expression or function of caveolin-1.28 After indomethacin treatment, the uptake of C6-EV-sus by HCE-Ts was significantly decreased to 42.6% (p < 0.0001).
Macropinocytosis is also a process of endocytosis of extracellular substances into the cell; however, adding amiloride, a macropinocytosis inhibitor, did not significantly reduce the uptake of C6-EV-sus by HCE-Ts (p > 0.05).
In conclusion, the cellular entry process of C6-EV-sus involves multiple mechanisms, including caveolae- and lipid raft-mediated endocytosis, clathrin-mediated endocytosis, and caveolae-mediated endocytosis. Notably, this process excludes involvement with macropinocytosis.
Cell Proliferation Assay
Cytotoxicity Test
The CCK-8 test was employed to assess the influence of EV-sus on the survival of HUVECs at different dilution ratios over 24 hours. It was observed that a 1:1000 dilution (1 μg·mL−1) of EV-sus had no impact on cell survival. Therefore, subsequent experiments were conducted at this dilution (Figure 5A).
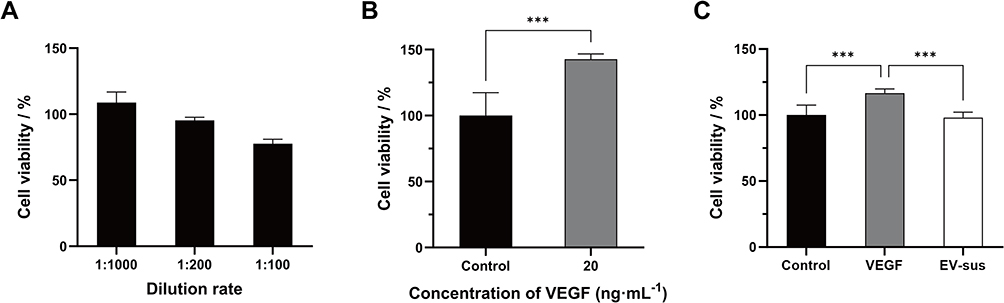 |
Figure 5 (A) HUVECs Cytotoxicity of EV-sus (n = 5). (B) VEGF promotes the proliferation of HUVECs (n = 5). (C) EV-sus inhibited HUVECs proliferation (n = 5). ***p < 0.001. |
Cell Proliferation Assay
About 20 ng·mL−1 of VEGF could effectively promote the proliferation of HUVECs (Figure 5B). The impact of EV-sus on HUVEC proliferation of VEGF-induced was illustrated in Figure 5C. Compared to the control group, VEGF (20 ng·mL−1) significantly promoted the proliferation of HUVECs (p < 0.001). EV-sus, at 1 μg·mL−1 concentration, significantly inhibited the proliferative effect of VEGF-induced HUVECs (p < 0.001).
Cell Scratch Test
The results of the scratch assay and ImageJ statistical analysis are shown in Figure 6A and D. VEGF significantly promoted HUVECs migration, as evidenced by a healing area of approximately 174,604 ± 16,910 pixels at 12 hours (p < 0.01) and 277,496 ± 13,361 pixels at 24 hours (p < 0.0001), significantly higher than the control group. Conversely, EV-sus significantly inhibited VEGF-induced HUVECs migration, with a healing area of 128,674 ± 16,402 pixels at 12 hours (p < 0.001) and 215,872 ± 6707 pixels at 24 hours (p < 0.0001).
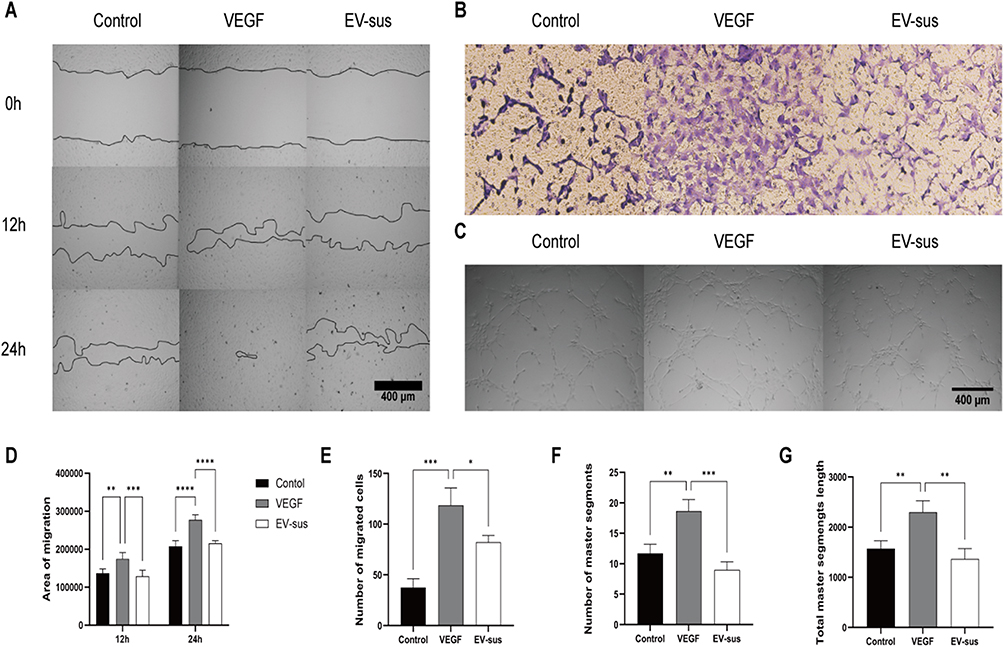 |
Figure 6 (A) Representative images and (D) corresponding quantitative analysis of the scratch wound healing assay (n = 4). (B) Representative images and (E) corresponding quantitative analysis of the Transwell migration assay (n = 3). (C) Representative images and (F and G) corresponding quantitative analysis of the tube formation assay (n = 4). *p < 0.05, **p < 0.01, ***p < 0.001, ****p < 0.0001. |
Transwell Migration Test
The results of the transwell assay are shown in Figure 6B and E. The number of HUVECs migrating at 24 hours induced by VEGF alone or by EV-sus on VEGF was 118.4 ± 17.3 and 82.1 ± 6.5 cells, respectively. The data suggested that EV-sus effectively inhibited the migration of HUVECs induced by VEGF (p < 0.05).
Cell Tube Formation Assay
The results of the tube formation assay are presented in Figure 6C. The count and the global length of master segments for each group were analyzed using ImageJ software (Figure 6F and G). The findings demonstrated that VEGF effectively increased the count (p < 0.01) and the global length (p < 0.01) of master segments formed by HUVECs. In contrast, EV-sus significantly inhibited both the count (p < 0.001) and the tube length (p < 0.01) of master segments formed by HUVECs induced by VEGF.
Corneal Neovascularization of Alkali Burn Model in C57BL/6 Mice
Neovascularization Data Analysis and H&E Staining
The progression of C57BL/6 mice corneal neovascularization over time is shown in Figure 7A–C. By day 3, neovascularization was observed near the corneal rim in all experimental groups. By day 7, neovascularization had advanced towards the center of the cornea in the Saline group, whereas in the CsA and EV-sus groups, neovascularization extended along the corneal rim without reaching the center. The length and area of neovascularization in each group were quantified using ImageJ. The results showed that on day 7, the CsA group had shorter neovascularization lengths (p < 0.0001) and area (p < 0.0001) than the Saline group, and the EV-sus group had considerably shorter neovascularization lengths (p < 0.0001) and area (p < 0.0001) than the Saline group.
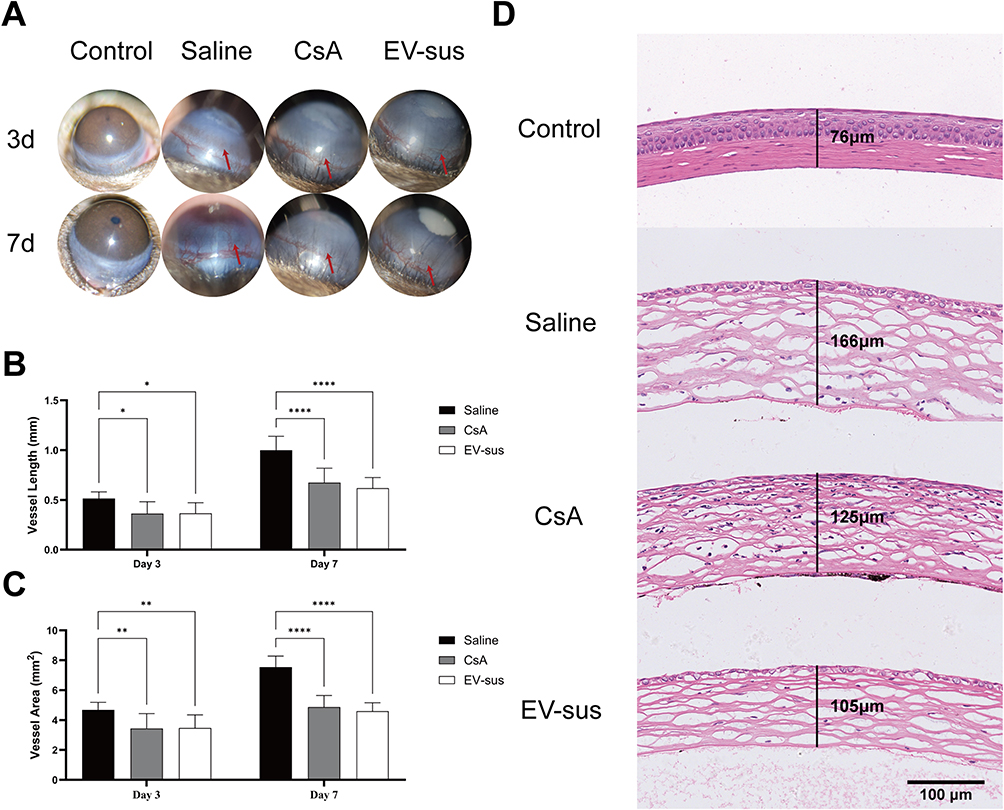 |
Figure 7 (A) Images of eyeballs during the experiment. (B) The statistical results of blood vessel length (n = 8). (C) The statistical results of blood vessel area (n = 8). (D) The results of H&E staining. The red arrows indicated the corneal neovascularization of the mice; *p < 0.05, **p < 0.01, ****p < 0.0001. |
The corneas of mice from each group were stained with H&E and sectioned. The central corneal thickness was then determined (Figure 7D). The data indicated that the corneal thickness was approximately 166 μm for the saline group, 125 μm for the CsA group, and 105 μm for the EV-sus group. In the normal control group, the corneal structure remained intact, with no obvious pathological changes. The saline group exhibited significant corneal edema and stromal loosening, accompanied by inflammatory cell infiltration and neovascularization. The CsA group showed inflammatory cell infiltration but relatively milder stromal loosening. In contrast, the EV-sus treatment group demonstrated significantly reduced corneal pathology, presenting only slight neovascularization and mild stromal loosening.
RT-qPCR
Mouse corneal RNA was extracted using the TRIzol method, and the 2−ΔΔCt method was utilized to assess the expression levels of IL-1, IL-6, VEGF, TNF-α, and MMP-9 (Figure 8).
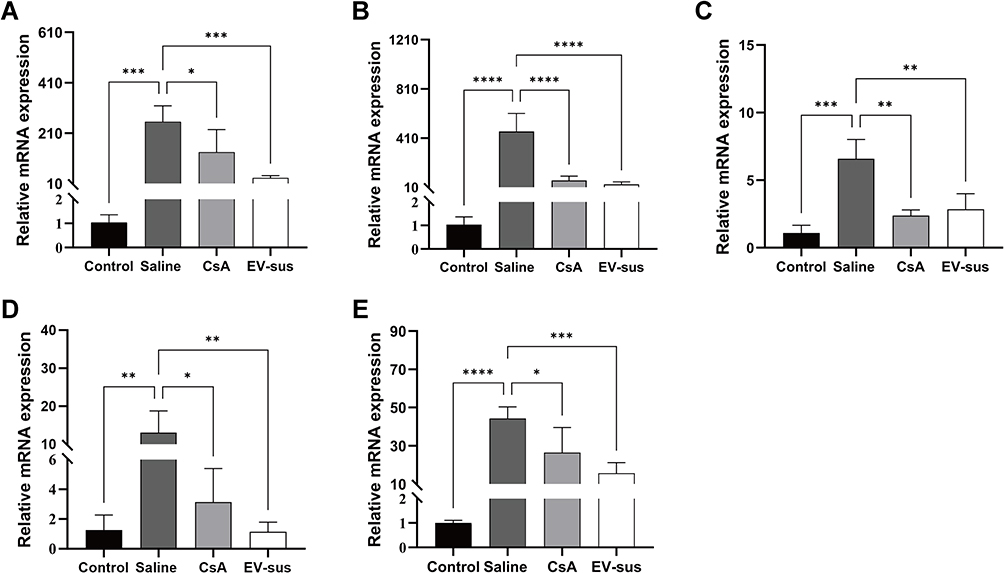 |
Figure 8 Results of mRNA expression in mouse corneas (n = 4): (A) IL-1; (B) IL-6; (C) VEGF; (D) TNF-α; and (E) MMP-9. *p < 0.05, **p < 0.01, ***p < 0.001, ****p < 0.0001. |
The results exhibited that, compared to the Saline group, continuous administration of CsA significantly reduced the expression of IL-1 (p < 0.05), IL-6 (p < 0.0001), VEGF (p < 0.01), TNF-α (p < 0.05), and MMP-9 (p < 0.05). Similarly, the EV-sus group showed a notable reduction in the expression of IL-1 (p < 0.001), IL-6 (p < 0.0001), VEGF (p < 0.01), TNF-α (p < 0.01), and MMP-9 (p < 0.001). There were no notable variations in the effects of CsA and EV-sus. The results indicated that EV-sus could effectively inhibit corneal neovascularization and inflammatory responses in alkali-burned mice.
Evaluation of Eye Irritation
The results of the eye irritation test for EV-sus are shown in Tables 4 and 5. In the single-dose administration experiment, EV-sus did not induce eye irritation, and the appearance of the rabbits’ eyes remained largely unchanged. In the multiple-dose administration experiment, slight moisture was observed around the rabbits’ eyes, but no edema or congestion was detected (Figure 9A).
 |
Table 4 Results of the Single-Dose Administration Experiment (n = 3) |
 |
Table 5 Results of the Multiple-Dose Administration Experiment (n = 3) |
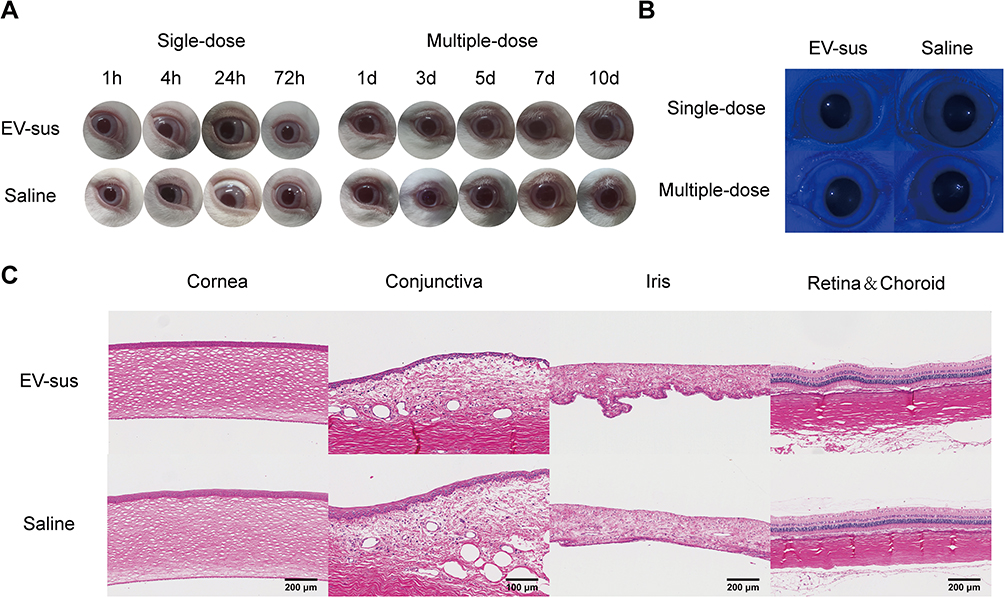 |
Figure 9 (A) Pictures of rabbit eyes during the experiment (n = 3). (B) Pictures of rabbit eyes after staining with sodium fluorescein. (C) Results of H&E staining for each group. |
A sodium fluorescein solution was instilled into the rabbit’s eye, followed by a saline rinse. Under cobalt blue light, a yellow-green fluorescent area indicated the injury site. In both single and multiple dosing experiments, no ocular damage was observed in any group of rabbits (Figure 9B).
After multiple-dose administration, HE staining was performed on rabbit eyes (Figure 9C). The EV-sus group demonstrated a complete corneal structure, in contrast to the Saline group, with no infiltration of inflammatory cells, no significant differences in the endothelial cell layer, and no changes in the morphology of the conjunctiva. These results indicated that EV-sus was not irritating to the eye.
Discussion
Everolimus, recognized for its poor water solubility and suboptimal bioavailability, requires an effective stabilization protocol.19 After extensive trials and characterization, we ultimately selected a nanosuspension-based formulation due to its inherent stability.20 Additionally, the straightforward preparation process enhances its potential for clinical translation compared to other complex formulations.29 The dosage of each excipient was below the FDA-recommended limits, ensuring the safety of the preparation. The eye irritation test, a crucial safety evaluation for ophthalmic products, was typically performed on rabbit eyes due to their substantial conjunctival sac volume, anatomical similarity to the human eyes, and heightened sensitivity to ocular irritation compared to humans.30 In this study, the ocular irritation score revealed that the drug-loaded formulation, EV-sus, did not induce irritation in rabbits after both single and multiple applications of eye drops, indicating the high safety of EV-sus.
To our knowledge, no prior studies have investigated the impact of the hydroxyethyl derivative of rapamycin, everolimus, on the survival of human corneal epithelial cells. Existing literature indicated that rapamycin does not exhibit significant toxic effects on HCE-Ts at 180 ng·mL−1 for 24 h.31 However, exposure to 100 ng·mL−1 of rapamycin for 48 h significantly reduced the viability of human dermal microvascular endothelial cells.32 In the present study, a 1:100 dilution of EV-sus (10 μg·mL−1) suppressed HCE-Ts viability after 24 hours, whereas a 1:200 dilution (5 μg·mL−1) had no effect on cell viability. Besides, we investigated the effects of blank preparations, Blank-sus, on HCE-Ts and found that Blank-sus did not irritate HCE-Ts at 24 hours when diluted 1:10.
The use of C6 as a fluorescent surrogate for EV in the cellular uptake study was based on several considerations. Both EV and C6 are highly lipophilic molecules, enabling C6 to reasonably mimic the cellular uptake behavior of EV.33 Furthermore, everolimus itself lacks intrinsic fluorescence, making its direct quantification at low concentrations technically challenging, whereas C6 exhibits strong fluorescence even at trace levels, permitting sensitive detection by fluorescence microscopy.34 C6 was frequently utilized in research to explore cellular uptake mechanisms as potential alternatives to lipophilic drugs.35 Consequently, this study opted to measure the concentration of C6 as an indirect indicator of EV-sus uptake.36,37 The uptake of C6 by cells was a time-dependent process that may be energy-consuming, possibly related to caveolin proteins, clathrin, and micropinocytosis.38–41
In this study, the in vivo angiogenesis environment was simulated by the addition of VEGF. VEGF could promote the proliferation, migration, and tube formation of HUVECs, consistent with the results reported in the literature.42 Studies showed that 1 μg·mL−1 of rapamycin exerted a significant growth-inhibitory effect on HUVECs.43 Similarly, 1 μg·mL−1 of everolimus was observed to significantly inhibit the growth, migration, and angiogenesis of HUVECs.44,45
Four principal animal models of corneal neovascularization were typically used to investigate its pathogenesis and to evaluate the efficacy of novel antiangiogenic drugs: the chemical burn model, the corneal suture model, the corneal microcapsule analysis model, and the transgenic model. The corneal alkali burn model was easy to replicate in animal tests and extensively employed to induce corneal neovascularization in rats46 and mice.47 Numerous studies showed that the C57BL/6 mice are well-established models of corneal neovascularization in alkali burn mice.26,48 Thus, in this investigation, the efficacy of EV-sus in inhibiting corneal neovascularization in vitro was assessed using C57BL/6 mice to create the corneal alkali burn model. In this study, a 7-day drug treatment was conducted to avoid the effects of spontaneous recovery in mice, and the results also illustrated the efficacy of the drug. After 7 days, in the EV-sus group, the corneal stroma layer was more tightly linked, with a reduction in neovascularization compared to other groups.49
It was reported that rapamycin could diminish the infiltration of inflammatory cells, modulate cytokine expression, and regulate the balance between MMP-2 and HIF-1α-mediated inflammation and angiogenesis by inhibiting mTOR activation during corneal wound healing following alkali injury.50 Everolimus, as a rapamycin derivative, was anticipated to exhibit similar pharmacological efficacy. Nevertheless, limited studies elucidated its ability to inhibit corneal neovascularization by reducing VEGFR expression.18 In this paper, we investigated the cellular uptake mechanism of EV-sus and assessed its efficacy and safety. The findings indicated that EV-sus could significantly inhibit the occurrence of CNV.
Conclusion
In this study, we showed the promising prospects of EV-sus as a therapeutic candidate for CNV. The process of EV-sus uptake into HCE-Ts involves multiple mechanisms, including caveolae- and lipid raft-mediated endocytosis, clathrin-mediated endocytosis, and caveolae-mediated endocytosis. Significantly, EV-sus has been evaluated for its potential to reduce the proliferation, migration, and angiogenesis of HUVECs induced by VEGF, thereby preventing CNV formation. Additionally, the Draize test indicated that EV-sus exhibited good biocompatibility. In summary, these results provide strong theoretical support for employing EV-sus nanodispersions in corneal neovascularization treatment. As an innovative formulation, EV-sus demonstrates an effective strategy for combating ocular corneal neovascularization and suggests promising avenues for treating this sight-threatening condition. Future studies should further explore the long-term safety and efficacy of EV-sus in the treatment of CNV and elucidate its molecular mechanisms of action in greater depth.
Abbreviations
EV-sus, everolimus-loaded nanosuspensions; CNV, corneal neovascularization; HCE-T, Human Corneal Epithelial Cells-Transformed; HUVECs, Human Umbilical Vein Endothelial Cells; VEGF, vascular endothelial growth factor; EV, Everolimus; mTOR, mammalian target of rapamycin; FKBP12, FK506 binding protein 12; HIF-1, Hypoxia-Inducible Factor 1; AUC, area under the concentration-time curve; HPMC, Hydroxypropyl methylcellulose; PVA, Polyvinyl Alcohol; RIPA, Radio-Immunoprecipitation Assay; CCK-8, Cell Counting Kit-8; DAPI, 4′,6-Diamidino-2-phenylindole; C6, Coumarin 6; CsA, Cyclosporine A; PDI, polydispersity index; OD, optical density; PBS, phosphate-buffered saline; IL-1, Interleukin-1; IL-6, Interleukin-6; MMP-9, matrix metalloproteinase-9; TNF-α, tumor necrosis factor-α.
Data Sharing Statement
The authors confirm that the data supporting the findings of this study are available within the article.
Ethical Approval
New Zealand rabbits (male, 2.0-3.0 kg) and C57BL/6 mice (male, 20 g) were provided by Zhejiang Laboratory Animal Center (Hangzhou, China). Before being used, New Zealand rabbits and C57BL/6 mice were maintained at room temperature around 20°C and allowed to adjust to the environment for at least a week. Standard lab food and water were available to all animals. All experimental procedures were complied with the animal husbandry and use standards of the Zhejiang Academy of Medical Sciences. Approval for the conduct of these animal experiments was granted by Zhejiang Center of Laboratory Animals Institutional Animal Care and Use Committee (Grant No. ZJCLA-IACUC-20050072, Date: March 2022).
Acknowledgments
This project is supported by National Natural Science Youth Foundation of China (No. 82000864), General Research Project of Zhejiang Provincial Department of Education (No.Y202559796), Hangzhou Natural Science Foundation Project (No. 2025SZRJJ0213), Special project of Hangzhou Medical College (No. YS2022009 and KYYB2024005), and Key Laboratory of Neuropsychiatric Drug Research of Zhejiang Province (No. 2019E10021).
We thank Home for Researchers editorial team (https://www.home-for-researchers.com) for language editing service.
Disclosure
The authors report no conflicts of interest in this work. This paper has been uploaded to SSRN as a preprint: https://www.researchgate.net/publication/389959225_Enhanced_Everolimus_Delivery_Development_and_Evaluation_of_a_Nanosuspension_Formulation.
References
1. Nicholas MP, Mysore N. Corneal neovascularization. Exp Eye Res. 2021;202:108363. doi:10.1016/j.exer.2020.108363
2. Ma DH, Chen HC, Lai JY, et al. Matrix revolution: molecular mechanism for inflammatory corneal neovascularization and restoration of corneal avascularity by epithelial stem cell transplantation. Ocul Surf. 2009;7(3):128–144. doi:10.1016/s1542-0124(12)70308-7
3. Wang JS, Xie HT, Zhang MC. Characterization of ex vivo expanded oral mucosal epithelium cells on acellular porcine corneal stroma for ocular surface reconstruction. J Ophthalmol. 2017;2017:6761714. doi:10.1155/2017/6761714
4. Tedesco-Silva H, Saliba F, Barten MJ, et al. An overview of the efficacy and safety of everolimus in adult solid organ transplant recipients. Transplant Rev. 2022;36(1):100655. doi:10.1016/j.trre.2021.100655
5. Majumder PK, Febbo PG, Bikoff R, et al. mTOR inhibition reverses Akt-dependent prostate intraepithelial neoplasia through regulation of apoptotic and HIF-1-dependent pathways. Nat Med. 2004;10(6):594–601. doi:10.1038/nm1052
6. Tran LH, Zupanc ML. Long-term everolimus treatment in individuals with tuberous sclerosis complex: a review of the current literature. Pediatr Neurol. 2015;53(1):23–30. doi:10.1016/j.pediatrneurol.2014.10.024
7. Lee L, Ito T, Jensen RT. Everolimus in the treatment of neuroendocrine tumors: efficacy, side-effects, resistance, and factors affecting its place in the treatment sequence. Expert Opin Pharmacother. 2018;19(8):909–928. doi:10.1080/14656566.2018.1476492
8. Raphael J, Lefebvre C, Allan A, et al. Everolimus in advanced breast cancer: a systematic review and meta-analysis. Target Oncol. 2020;15(6):723–732. doi:10.1007/s11523-020-00770-6
9. Witzke O, Sommerer C, Arns W. Everolimus immunosuppression in kidney transplantation: what is the optimal strategy. Transplant Rev. 2016;30(1):3–12. doi:10.1016/j.trre.2015.09.001
10. Tang CY, Shen A, Wei XF, et al. Everolimus in de novo liver transplant recipients: a systematic review. Hepatobiliary Pancreat Dis Int. 2015;14(5):461–469. doi:10.1016/s1499-3872(15)60419-2
11. Reis A, Megahed M, Reinhard T, Godehardt E, Braunstein C, Sundmacher R. Synergism of RAD and cyclosporin A in prevention of acute rat corneal allograft rejection. Cornea. 2002;21(1):81–84. doi:10.1097/00003226-200201000-00017
12. Blair J, Barry R, Murray PI, Moore DJ, Denniston AK. mTOR-inhibiting pharmacotherapy for the treatment of non-infectious uveitis: a systematic review protocol. Syst Rev. 2018;7(1):83. doi:10.1186/s13643-018-0745-2
13. Hennig M, Bauer D, Wasmuth S, et al. Everolimus improves experimental autoimmune uveoretinitis. Exp Eye Res. 2012;105:43–52. doi:10.1016/j.exer.2012.09.003
14. Kasper M, Gabriel D, Möller M, et al. Novel everolimus-loaded nanocarriers for topical treatment of murine experimental autoimmune uveoretinitis (EAU). Exp Eye Res. 2018;168:49–56. doi:10.1016/j.exer.2018.01.003
15. Amirouchene-Angelozzi N, Nemati F, Gentien D, et al. Establishment of novel cell lines recapitulating the genetic landscape of uveal melanoma and preclinical validation of mTOR as a therapeutic target. Mol Oncol. 2014;8(8):1508–1520. doi:10.1016/j.molonc.2014.06.004
16. Carita G, Frisch-Dit-Leitz E, Dahmani A, et al. Dual inhibition of protein kinase C and p53-MDM2 or PKC and mTORC1 are novel efficient therapeutic approaches for uveal melanoma. Oncotarget. 2016;7(23):33542–33556. doi:10.18632/oncotarget.9552
17. Yagasaki R, Nakahara T, Ushikubo H, Mori A, Sakamoto K, Ishii K. Anti-angiogenic effects of mammalian target of rapamycin inhibitors in a mouse model of oxygen-induced retinopathy. Biol Pharm Bull. 2014;37(11):1838–1842. doi:10.1248/bpb.b14-00487
18. Çakmak H, Ergin K, Bozkurt G, Kocatürk T, Evliçoğlu GE. The effects of topical everolimus and sunitinib on corneal neovascularization. Cutan Ocul Toxicol. 2016;35(2):97–103. doi:10.3109/15569527.2015.1034360
19. Iwase Y, Maitani Y. Preparation and in vivo evaluation of liposomal everolimus for lung carcinoma and thyroid carcinoma. Biol Pharm Bull. 2012;35(6):975–979. doi:10.1248/bpb.35.975
20. Tang Z, Yin L, Zhang Y, Yu W, Wang Q, Zhan Z. Preparation and study of two kinds of ophthalmic nano-preparations of everolimus. Drug Deliv. 2019;26(1):1235–1242. doi:10.1080/10717544.2019.1692966
21. Li H, Xiao Y, Niu J, Chen X, Ping Q. Preparation of a cationic nanoemulsome for intratumoral drug delivery and its enhancing effect on cellular uptake in vitro. J Nanosci Nanotechnol. 2011;11(10):8547–8555. doi:10.1166/jnn.2011.4965
22. Wang X, Huang H, Zhang L, Bai Y, Chen H. PCM and TAT co-modified liposome with improved myocardium delivery: in vitro and in vivo evaluations. Drug Deliv. 2017;24(1):339–345. doi:10.1080/10717544.2016.1253121
23. Lin X, Yu X, Chen X, et al. Inhibition of neovascularization and inflammation in a mouse model of corneal alkali burns using cationic liposomal tacrolimus. Front Bioeng Biotechnol. 2021;9:791954. doi:10.3389/fbioe.2021.791954
24. Li Z, Li J, Zhu L, et al. Celastrol nanomicelles attenuate cytokine secretion in macrophages and inhibit macrophage-induced corneal neovascularization in rats. Int J Nanomed. 2016;11:6135–6148. doi:10.2147/IJN.S117425
25. Zhang XP, Li KR, Yu Q, et al. Ginsenoside Rh2 inhibits vascular endothelial growth factor-induced corneal neovascularization. FASEB J. 2018;32(7):3782–3791. doi:10.1096/fj.201701074RR
26. Balne PK, Gupta S, Zhang J, et al. The functional role of decorin in corneal neovascularization in vivo. Exp Eye Res. 2021;207:108610. doi:10.1016/j.exer.2021.108610
27. Nagai N, Ogata F, Otake H, Nakazawa Y, Kawasaki N. Energy-dependent endocytosis is responsible for drug transcorneal penetration following the instillation of ophthalmic formulations containing indomethacin nanoparticles. Int J Nanomed. 2019;14:1213–1227. doi:10.2147/IJN.S196681
28. Han Y, Park J, Kang JX, et al. Mitigation of indomethacin-induced gastrointestinal damages in fat-1 transgenic mice via gate-keeper action of ω-3-polyunsaturated fatty acids. Sci Rep. 2016;6:33992. doi:10.1038/srep33992
29. Younis MA, Tawfeek HM, Abdellatif A, Abdel-Aleem JA, Harashima H. Clinical translation of nanomedicines: challenges, opportunities, and keys. Adv Drug Deliv Rev. 2022;181:114083. doi:10.1016/j.addr.2021.114083
30. Miralles E, Kamma-Lorger CS, Domènech Ò, et al. Assessment of efficacy and safety using PPAR-γ agonist-loaded nanocarriers for inflammatory eye diseases. Int J Mol Sci. 2022;23(19):11184. doi:10.3390/ijms231911184
31. Liu Z, Chen D, Chen X, et al. Autophagy activation protects ocular surface from inflammation in a dry eye model in vitro. Int J Mol Sci. 2020;21(23):8966. doi:10.3390/ijms21238966
32. Kwon YS, Kim JC. Inhibition of corneal neovascularization by rapamycin. Exp Mol Med. 2006;38(2):173–179. doi:10.1038/emm.2006.21
33. Zhang M, Dai T, Feng N. A novel solubility-enhanced rubusoside-based micelles for increased cancer therapy. Nanoscale Res Lett. 2017;12(1):274. doi:10.1186/s11671-017-2054-4
34. Liu Y, Wu X, Mi Y, et al. PLGA nanoparticles for the oral delivery of nuciferine: preparation, physicochemical characterization and in vitro/in vivo studies. Drug Deliv. 2017;24(1):443–451. doi:10.1080/10717544.2016.1261381
35. Yang L, Zhang Z, Hou J, et al. Targeted delivery of ginsenoside compound K using TPGS/PEG-PCL mixed micelles for effective treatment of lung cancer. Int J Nanomed. 2017;12:7653–7667. doi:10.2147/IJN.S144305
36. Rivolta I, Panariti A, Lettiero B, et al. Cellular uptake of coumarin-6 as a model drug loaded in solid lipid nanoparticles. J Physiol Pharmacol. 2011;62(1):45–53.
37. Song K, Xin M, Yu H, et al. Novel ultra-small micelles based on rebaudioside A: a potential nanoplatform for ocular drug delivery. Int J Pharm. 2018;552(1–2):265–276. doi:10.1016/j.ijpharm.2018.10.006
38. Fang L, Li J, Cheng H, Liu H, Zhang C. Dual fluorescence images, transport pathway, and blood-brain barrier penetration of B-Met-W/O/W SE. Int J Pharm. 2024;652:123854. doi:10.1016/j.ijpharm.2024.123854
39. Sun Y, Lu J, Yan D, Shen L, Hu H, Chen D. Cellular uptake mechanism and clearance kinetics of fluorescence-labeled glycyrrhetinic acid and glycyrrhetinic acid-modified liposome in hepatocellular carcinoma cells. Environ Toxicol Pharmacol. 2017;53:46–56. doi:10.1016/j.etap.2017.05.003
40. Tong Z, Jie X, Chen Z, et al. Borneol and lactoferrin dual-modified crocetin-loaded nanoliposomes enhance neuroprotection in HT22 cells and brain targeting in mice. Eur J Med Chem. 2024;276:116674. doi:10.1016/j.ejmech.2024.116674
41. Zhang X, Xiao Y, Huang Q. Investigation of cellular uptake and transport capacity of Cordyceps sinensis exopolysaccharide‑selenium nanoparticles with different particle sizes in Caco-2 cell monolayer. Int J Biol Macromol. 2024;262(Pt 1):130060. doi:10.1016/j.ijbiomac.2024.130060
42. Yang T, Wang X, Guo L, et al. Daphnetin inhibits corneal inflammation and neovascularization on a mouse model of corneal alkali burn. Int Immunopharmacol. 2022;103:108434. doi:10.1016/j.intimp.2021.108434
43. Kwon YS, Hong HS, Kim JC, Shin JS, Son Y. Inhibitory effect of rapamycin on corneal neovascularization in vitro and in vivo. Invest Ophthalmol Vis Sci. 2005;46(2):454–460. doi:10.1167/iovs.04-0753
44. Chen X, Chen X, Sun X, Wang C, Wen Z, Cheng Y. RAD001 targeted HUVECs reverses 12-lipoxygenase-induced angiogenesis in oesophageal squamous cell carcinoma. J Cell Mol Med. 2021;25(14):6936–6947. doi:10.1111/jcmm.16705
45. Mishra GP, Doddapaneni BS, Nguyen D, Alani AW. Antiangiogenic effect of docetaxel and everolimus as individual and dual-drug-loaded micellar nanocarriers. Pharm Res. 2014;31(3):660–669. doi:10.1007/s11095-013-1188-z
46. Yaşar M, Çakmak H, Dündar S, Örenay Boyacıoğlu S, Çalışkan M, Ergin K. The role of microRNAs in corneal neovascularization and its relation to VEGF. Cutan Ocul Toxicol. 2020;39(4):341–347. doi:10.1080/15569527.2020.1813749
47. Maier AB, Reichhart N, Gonnermann J, et al. Effects of TNFα receptor TNF-Rp55- or TNF-Rp75- deficiency on corneal neovascularization and lymphangiogenesis in the mouse. PLoS One. 2021;16(4):e0245143. doi:10.1371/journal.pone.0245143
48. Dong Q, Qi B, Zhang B, et al. Overactivation of norepinephrine-β2-adrenergic receptor axis promotes corneal neovascularization. Invest Ophthalmol Vis Sci. 2023;64(3):20. doi:10.1167/iovs.64.3.20
49. Wang W, Deng M, Li M, Liu L, Zou J, Qian Y. Exploring corneal neovascularization: an integrated approach using transcriptomics and proteomics in an alkali burn mouse model. Invest Ophthalmol Vis Sci. 2024;65(1):21. doi:10.1167/iovs.65.1.21
50. Li J, Han J, Shi Y, Liu M. Rapamycin inhibits corneal inflammatory response and neovascularization in a mouse model of corneal alkali burn. Exp Eye Res. 2023;233:109539. doi:10.1016/j.exer.2023.109539
 © 2025 The Author(s). This work is published and licensed by Dove Medical Press Limited. The
full terms of this license are available at https://www.dovepress.com/terms
and incorporate the Creative Commons Attribution
- Non Commercial (unported, 4.0) License.
By accessing the work you hereby accept the Terms. Non-commercial uses of the work are permitted
without any further permission from Dove Medical Press Limited, provided the work is properly
attributed. For permission for commercial use of this work, please see paragraphs 4.2 and 5 of our Terms.
© 2025 The Author(s). This work is published and licensed by Dove Medical Press Limited. The
full terms of this license are available at https://www.dovepress.com/terms
and incorporate the Creative Commons Attribution
- Non Commercial (unported, 4.0) License.
By accessing the work you hereby accept the Terms. Non-commercial uses of the work are permitted
without any further permission from Dove Medical Press Limited, provided the work is properly
attributed. For permission for commercial use of this work, please see paragraphs 4.2 and 5 of our Terms.