Back to Journals » International Journal of Nanomedicine » Volume 10 » Issue 1
Engineering iodine-doped carbon dots as dual-modal probes for fluorescence and X-ray CT imaging
Authors Zhang M, Ju H, Zhang L, Sun M, Zhou Z, Dai Z, Zhang L, Gong A, Wu C ![]() , Du F
, Du F
Received 12 February 2015
Accepted for publication 16 June 2015
Published 6 November 2015 Volume 2015:10(1) Pages 6943—6953
DOI https://doi.org/10.2147/IJN.S82778
Checked for plagiarism Yes
Review by Single anonymous peer review
Peer reviewer comments 4
Editor who approved publication: Professor Lei Yang
Miaomiao Zhang,1,* Huixiang Ju,2,* Li Zhang,1,* Mingzhong Sun,2 Zhongwei Zhou,2 Zhenyu Dai,3 Lirong Zhang,1 Aihua Gong,1 Chaoyao Wu,1 Fengyi Du1
1School of Medicine, Jiangsu University, Zhenjiang, People’s Republic of China; 2Department of Clinical Laboratory, Affiliated Yancheng Hospital, School of Medicine, Southeast University, Yancheng, Jiangsu, People’s Republic of China; 3Radiology Department, Affiliated Yancheng Hospital, School of Medicine, Southeast University, Yancheng, Jiangsu, People’s Republic of China
*These authors contributed equally to this work
Abstract: X-ray computed tomography (CT) is the most commonly used imaging technique for noninvasive diagnosis of disease. In order to improve tissue specificity and prevent adverse effects, we report the design and synthesis of iodine-doped carbon dots (I-doped CDs) as efficient CT contrast agents and fluorescence probe by a facile bottom-up hydrothermal carbonization process. The as-prepared I-doped CDs are monodispersed spherical nanoparticles (a diameter of ~2.7 nm) with favorable dispersibility and colloidal stability in water. The aqueous solution of I-doped CDs showed wavelength-dependent excitation and stable photoluminescence similar to traditional carbon quantum dots. Importantly, I-doped CDs displayed superior X-ray attenuation properties in vitro and excellent biocompatibility. After intravenous injection, I-doped CDs were distributed throughout the body and excreted by renal clearance. These findings validated that I-doped CDs with high X-ray attenuation potency and favorable photoluminescence show great promise for biomedical research and disease diagnosis.
Keywords: carbon dots, contrast agents, iodine-doped, CT imaging
Introduction
During the past decade, medical imaging (MI) technologies have been emerging as a powerful noninvasive tool to visualize, characterize, and quantify the physiological and pathological process for disease diagnosis and biomedical research.1–3 The modalities of MI technologies are currently used in optical imaging,4 ultrasound,5 magnetic resonance imaging,6 computed tomography (CT),7 and positron-emission tomography.8 As one of the most commonly used MI technologies, CT offers more spatial anatomic details with high resolution than other imaging modalities. In comparison to other MI technologies, CT provides superior images of electron-dense materials due to X-ray attenuation by tissues.9 Therefore, the contrast resolution of CT is easy to distinguish soft tissues from bone tissue based on the distinct X-ray attenuation capacity. Even so, subtle changes of soft tissues, such as lesion, anabasis, and tumor, are difficult to perceive through CT image because these soft tissues have similar X-ray attenuation properties, ranging from 0 to 50 HU.10 Consequently, the injection of contrast agents is necessary to achieve accurate and abundant information of region of interest.11
Iodinated compounds are widely used as CT contrast agents in clinical applications due to their prominent photoelectric effect.12 The cube of the high atomic number (Z=53) endows iodine with favorable X-ray attenuation property through photoelectric effect.13 However, iodinated contrast agents, with the help of the blood circulation system, spread throughout body after intravenous injection and are excreted through rapid renal clearance.14 The nonspecificity and short circulation restricts their wide applications in vivo. Additionally, inherent properties of iodinated aqueous solution, such as high osmolality and viscosity, sometimes induce serious adverse effect related to the excretion pathway. Due to these restrictions, various kinds of nanoparticles as efficient CT contrast agents have been developed to overcome these abovementioned limitations.15,16
Carbon quantum dots, emerging as new stars of carbon nanomaterials, have attracted tremendous attention due to their outstanding properties and potential applications.15 Especially in biomedical field, favorable water-solubility, good biocompatibility, and facile surface modification enabled their use as a multifunctional nanoplatform for bioimaging,17 biosensor,18 and targeted drug delivery system.19 In previous research studies, we demonstrated that functionalized carbon dots (CDs) could be used as effective fluorescent probes for bioimaging and biolabeling living cells.20,21 Meanwhile, as a commonly functionalized strategy, doping CDs with heteroatoms provides an attractive method of effectively tuning their intrinsic properties and exploiting new performance for advanced device applications.22 In view of X-ray attenuation and heteroatom-doped strategy, we report a hydrothermal carbonization (HTC) approach for facile preparation of iodine-doped carbon dots (I-doped CDs) as efficient CT contrast agents for the first time. In line with the intensive research, we demonstrated that iodine atoms could be successfully doped into the carbon nanoparticles and that the I-doped CDs possessed similar physicochemical and optical properties of conventional CDs. Compared with traditional iodinated contrast agent, the resultant I-doped CDs exhibited not only unique photoluminescence (PL) and X-ray attenuation property, but also long circulation and passive targeted CT imaging.
Materials and methods
Materials
Glycine and quinine sulfate (98%, suitable for fluorescence) were purchased from Sigma (New York, NY, USA). Iodixanol was purchased from Hengrui Pharmaceutical Co., Ltd (Lianyungang, Jiangsu, People’s Republic of China). 3-(4,5-Dimethyl-thiazol-2-yl)-5-(3-carboxymethoxyphenyl)-2-(4-sulfophenyl)-2H-tetrazolium (MTS) was purchased from Promega (CellTiter Aqueous One Solution cell proliferation Assay kit, Madison, WI, USA). NaH2PO4, Na2HPO4, and H2SO4 were obtained from Guangfu Fine Chemical Research Institute (Nankai, Tianjin, People’s Republic of China). Fetal bovine serum and Dulbecco’s Minimum Essential Medium (DMEM) were purchased from Invitrogen China Limited (Shanghai, People’s Republic of China). All chemicals were of analytical grade and were used without further purification.
Synthesis of I-doped CDs
First, certain amounts of iodixanol and glycine were diluted with 20 mL water under vigorous stirring to form a transparent homogeneous solution. This solution was transferred into a 50 mL Teflon-lined stainless steel autoclave and heated at 180°C for different periods (3 hours). After cooling to room temperature, the reaction mixture was centrifuged at 5,000 rpm for 15 minutes to remove the black precipitates. The brown–yellow supernatant was transferred into a dialysis membrane (molecular weight cut-off of 1,000 Da) and was dialyzed against ultrapure water for 4 days to remove residues. The dialysis solution was collected and freeze-dried using a vacuum freeze dryer at −50°C for 48 hours. The I-doped CD powders thus obtained were saved for further characterization.
Instrumentation and characterizations
The chemical structures of I-doped CDs were analyzed using a Fourier transform infrared (FTIR) spectrometer (Nicolet Nexus 470, GMI, Ramsey, MN, USA). The elemental composition was determined by elemental analysis performed on a CHNS-O analyzer. The morphologies of the I-doped CDs were examined by high-resolution transmission electron microscopy on a JEM-2100 microscope (JEOL, Tokyo, Japan) under an accelerating voltage of 200 kV. UV–Vis (ultraviolet–visible) absorption spectra were recorded using a UV-2450 UV–Vis Spectrophotometer (Shimadzu, Kyoto, Japan). PL emission measurements were made using a Cary Eclipse Fluorometer (Varian, Palo Alto, CA, USA). The iodine element of I-doped CDs was quantified by linear calibration with a standard content of previously determined amounts of potassium iodine by inductively-coupled plasma atomic emission spectroscopy.
Measurement of fluorescence quantum yields
The quantum yield (Φ) of the as-prepared I-doped CDs was determined by a comparative method.23 A standard solution of quinine sulfate (reported quantum yield: 54%) was prepared by dissolving the substance in 0.1 M H2SO4 (refractive index [η] =1.33). Aqueous solutions containing varying concentrations of I-doped CDs were prepared by dissolving in distilled water (η =1.33). Absorbance of the solutions at the excitation wavelength was measured using a UV–Vis spectrophotometer. PL emission spectra of all the samples were recorded using an FLS920 fluorometer at an excitation wavelength of 360 nm. The samples were then analyzed using the PL spectrometer and the PL emission intensity at the excitation wavelength at which the I-doped CDs and the reference showed the same UV absorbance. The quantum yield was calculated using the following equation:
|
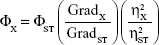
ST and X denote the standard group and test group, respectively. Φ is the fluorescence quantum yield. Grad is the gradient from the plot of integrated fluorescence intensity vs absorbance, and η is the refractive index of the solvent. To minimize the reabsorption effects, absorbance in the 10 mm fluorescence cuvette was not allowed to exceed 0.1 at the excitation wavelength.
Cell viability assay and cell imaging
The cytotoxicity of I-doped CDs was evaluated on A549 and 4T1 cells using the MTS assay according to the protocol provided by the manufacturer. Briefly, these cells were seeded in a 96-well plate at a density of 3×10³ cells/well and incubated for 24 hours at 37°C and 5% CO2, and then the growth medium was replaced with DMEM containing different concentrations of I-doped CDs. Each sample was prepared in triplicate. After incubation for 24 hours, 20 μL MTS solution was added to each well and incubated for 3 hours at 37°C under 5% CO2. The absorbance of each well was measured at 490 nm using Synergy HT Multi-Mode Microplate Reader (Bio Tek, Winooski, VT, USA). Nontreated cells (in DMEM) were used as control, and the relative cell viability (mean ± SD, n=3) was expressed as Abssample/Abscontrol ×100%.
The A549 and 4T1 cells were used to examine the utility of the newly developed I-doped CDs in live cell imaging. The two cell types were seeded on 15 mm diameter glass cover-slips placed inside the wells of a 24-well plate and were cultured for 24 hours at 37°C and 5% CO2 in medium containing 10% fetal bovine serum. Medium containing I-doped CDs at a concentration of 50 mg/mL was then added to each well and the cells were incubated for 6 hours at 37°C and 5% CO2. The labeled cells were then washed with phosphate buffer saline (PBS) and fixed with 4% paraformaldehyde/PBS at room temperature for 10 minutes. After washing the cells, a confocal lasers scanning fluorescence microscope (Zeiss LSM-710, Carl Zeiss Meditec AG, Jena, Germany) was used to observe and record the fluorescence emission from CDs inside the cells.
Hemolysis assay
Hemolysis assay was carried out according to the procedure reported in the literature with slight modification.24,25 In brief, fresh mouse blood stabilized with heparin sodium was kindly prepared by Animal Management Rules of the Ministry of Health of the People’s Republic of China and the guidelines for the Care and Use of the Jiangsu University Laboratory Animal Center. The blood was centrifuged (1,200 rpm, 15 minutes) to remove the supernatant and washed with PBS five times to completely remove serum and obtain the mouse red blood cells (MRBCs). Thereafter, the MRBCs were diluted ten times with PBS. The diluted MRBC suspension (0.1 mL) was transferred into 2 mL tubes prefilled with 0.9 mL water (as positive control), 0.9 mL PBS (as negative control), and 0.9 mL PBS containing I-doped CDs with different particle concentrations (50–200 μg/mL), respectively. The mixtures were incubated for 2 hours at 37°C after a gentle shaking, and centrifuged at 12,000 rpm for 1 minute. Finally, the photographs of the samples were taken and the absorbance of the supernatants (hemoglobin) was measured by a UV-2450 UV–Vis spectrophotometer. The hemolysis percentages of different samples were calculated by dividing the difference in absorbance at 541 nm between the sample and the negative control by the difference in absorbance at 541 nm between the positive and negative controls.
In vivo and in vitro CT phantom study
To study the X-ray attenuation in vitro, I-doped CDs with different concentration ranging from 0 to 0.2 mg/mL were diluted into 100 μL water and added to a 96-well culture plate. CT images of the samples were acquired on a clinical 64-slice multidetector CT scanner (SOMATOM Emotion, Siemens, Bavaria, Munich, Germany). These samples were imaged with the following parameters: tube voltage, 130 kV; current intensity, 180 mA; slice thickness, 5.0 mm; scan time, 2.85 seconds.
For CT imaging in vivo, we choose the Sprague Dawley rats as animal model. Animal experiments were approved and performed in accordance with the Animal Management Rules of the Ministry of Health of the People’s Republic of China and the guidelines for the Care and Use of the Jiangsu University Laboratory Animal Center. Before the intravenous injection, the samples solution was filtered through sterilized membrane filters (pore size 0.22 μm) and stored at 4°C for following experiments. The mice given intravenous injection of 1 mL I-doped CDs in PBS solution. The CT images of mice injected with I-doped CDs were acquired under the following parameters: tube voltage, 130 kV; current intensity, 25 mA.
Histological analysis
For histological studies, mice were sacrificed 30 days after intravenous injection of I-doped CDs at a dose of 20 mg/kg. Rats without the injection of I-doped CDs were used as control groups. Tissues (heart, spleen, liver, lung, and kidney) were harvested from the above two groups (control and test groups). The ex vivo organs were immersed in a buffered solution of 4% paraformaldehyde for 24 hours, dehydrated, and treated for inclusion in paraffin. The specimen was sectioned serially at 4 mm thickness and stained with hematoxylin and eosin. The histological sections were observed under an optical microscope.
Results and discussion
Preparation and characterization of I-doped CDs
The successful preparation of I-doped CDs was carried out by using iodixanol as iodine source and glycine as surface passivation agent based on the scheme given in Figure 1. The morphology of the synthesized I-doped CDs was analyzed by transmission electron microscopy. As shown in Figure 2A, the I-doped CDs exhibited uniform dispersion and discrete quasispherical shape without apparent aggregation. Figure 2B shows that the diameter distribution of I-doped CDs matched well with Gaussian fitting curve. The average diameter of I-doped CDs was approximately 2.7 nm, which was determined by statistical analysis of more than 100 particles by using the ImageJ software (National Institutes of Health, Bethesda, MD, USA). Meanwhile, these nanoparticles were amorphous without any lattices, which was consistent with other reports on CDs.20,21
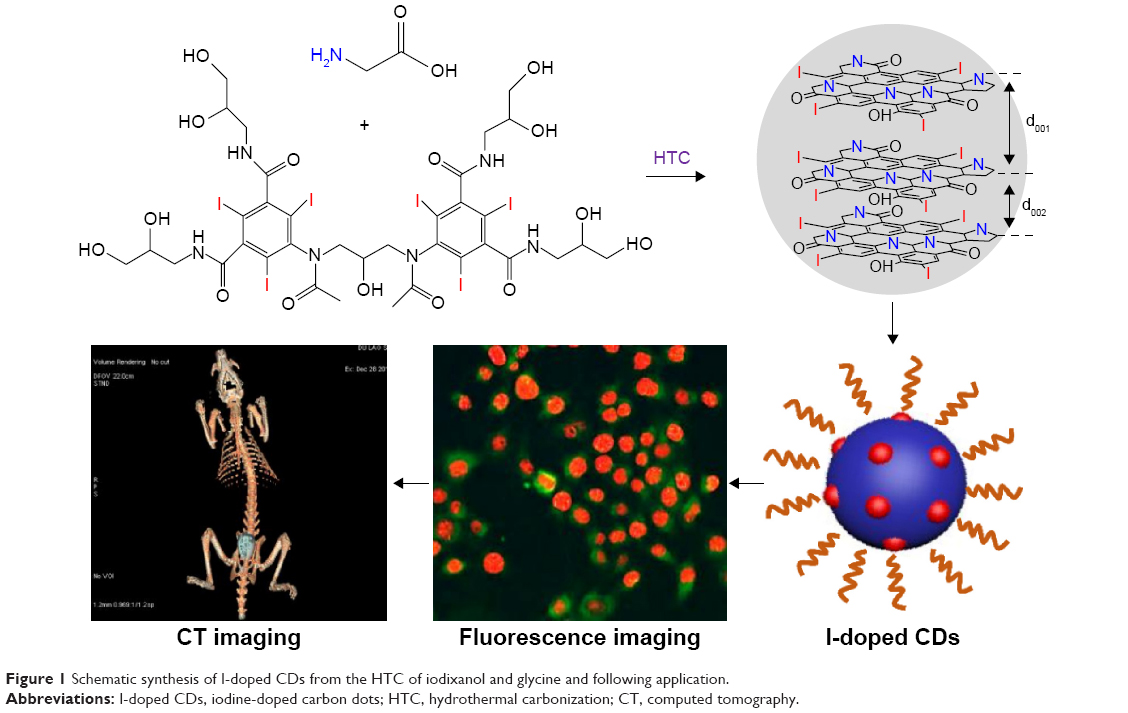 | Figure 1 Schematic synthesis of I-doped CDs from the HTC of iodixanol and glycine and following application. |
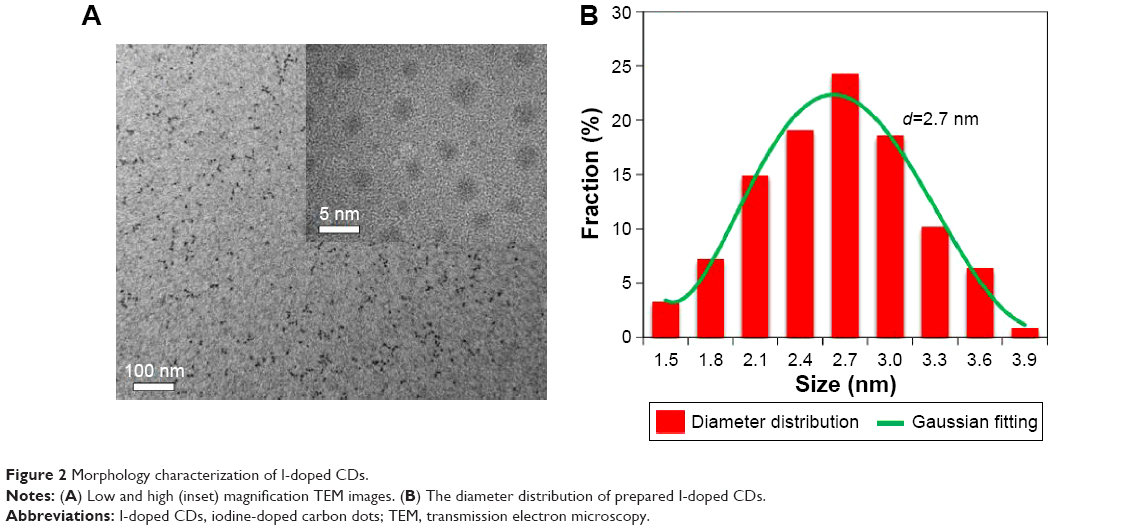 | Figure 2 Morphology characterization of I-doped CDs. |
The chemical structure and surface composition of the I-doped CDs
The surface functional groups and composition of the I-doped CDs were investigated using FTIR spectrum and X-ray photoelectron spectroscopy pattern. As shown in Figure 3A, the FTIR pattern exhibited characteristic absorption bonds of O–H and N–H stretching vibrations of amine groups at 3,420 cm−1, C–H stretching vibrations at 2,940 cm−1, C=C stretching vibrations at 1,660 cm−1, C–N stretching vibrations at 1,410 cm−1, and C–H stretching vibrations at 1,070 cm−1. The X-ray photoelectron spectroscopy survey spectra of the as-prepared I-doped CDs (Figure 3B) showed four typical peaks at 619.0, 284.0, 400.0, and 530.6 eV, which indicated that the I-doped CDs were mainly composed of iodine, carbon, nitrogen, and oxygen atoms. The high-resolution spectrum of I3d5 revealed the presence of 3d5/2 and 3d3/2 doublet at 619.6 and 631.1 eV, respectively. This suggested that iodine existed in the form of negatively charged iodine.26 There were two weak peaks at 617.1 and 628.7 eV which were ascribed to the characteristic bonds of iodine in I2.27 During the hydrothermal process, the trace amount of I2 species was probably absorbed on the surface defect sites of the I-doped CD nanoparticles. The high-resolution spectrum of C1S (Figure 3C) indicated the three main peaks at 283.7, 285.3, and 287.3 eV, which were attributed to C–C, C–I and C–C, C–O, respectively. The binding energy peak at 283.7 eV confirmed the graphitic structure (sp2, C–C) of the I-doped CDs. These results revealed that the functional groups of I-doped CDs mainly contained certain iodine and amino groups, plentiful carbonyl, carboxylate, and hydroxyl groups. The presence of these functional groups located at their surface endowed the I-doped CDs with excellent solubility and dispersibility in water.
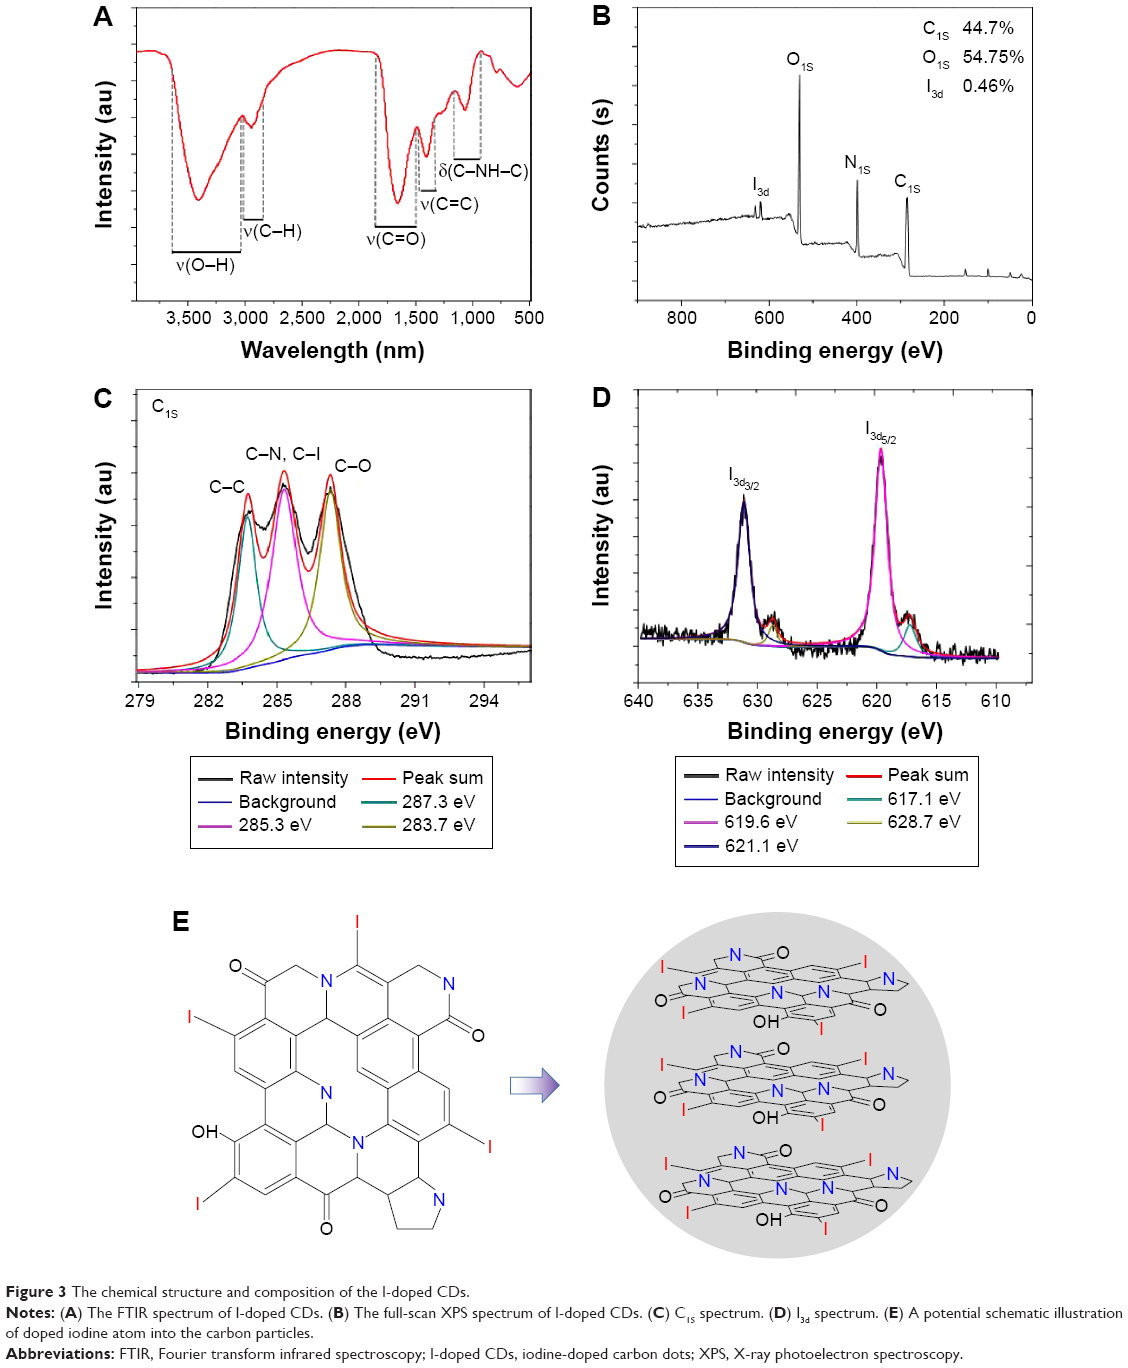 | Figure 3 The chemical structure and composition of the I-doped CDs. |
The crystal structure of the I-doped CDs was investigated by X-ray diffraction. As shown in Figure 4A, there were three diffraction peaks in the I-doped CDs pattern around 13.17°, 29.6°, and 42.7°, respectively. The corresponding interlayer spacing (d) was calculated from the Bragg’s law (the wavelength of Cu-Kα (λ) is 0.154 nm). These diffraction peaks matched well with the characteristic peaks of graphite oxide. As for the main peak, the diffraction peak of I-doped CDs around 13.17° (d001=0.671 nm) was similar to the typical diffraction peak (2θ=10.6°, {001} plane) of graphite oxide, which was attributed to an increase in sp3 layers spacing. During HTC process, many functional groups such as hydroxyl, carbonyl, epoxy, and amino groups were formed and bonded to the edges of basal planes of the crystal structure, inducing an increase in the interlayer spacing. Additionally, the second diffraction peak of I-doped CDs around 29.6° (d002=0.301 nm) became stronger and was more similar to the characteristic peaks of graphite ({002} planes, 2θ=26.5°) than graphite oxide. However, compared to the ordered crystal structure of graphite, the upward shift (from 26.5° to 29.6°) was attributed to highly disordered carbon and decrease in the sp2 (C–C) layers spacing in the carbonization process. The decrease in the intensity of the three peaks and the increase of the full width half maximum were due to the amorphous carbon structure of the prepared I-doped CDs. These results further indicated that these I-doped CDs with poor crystalline nature possessed heterogeneous multilayered structure, which was consistent with our previous reports about other CDs.28,29
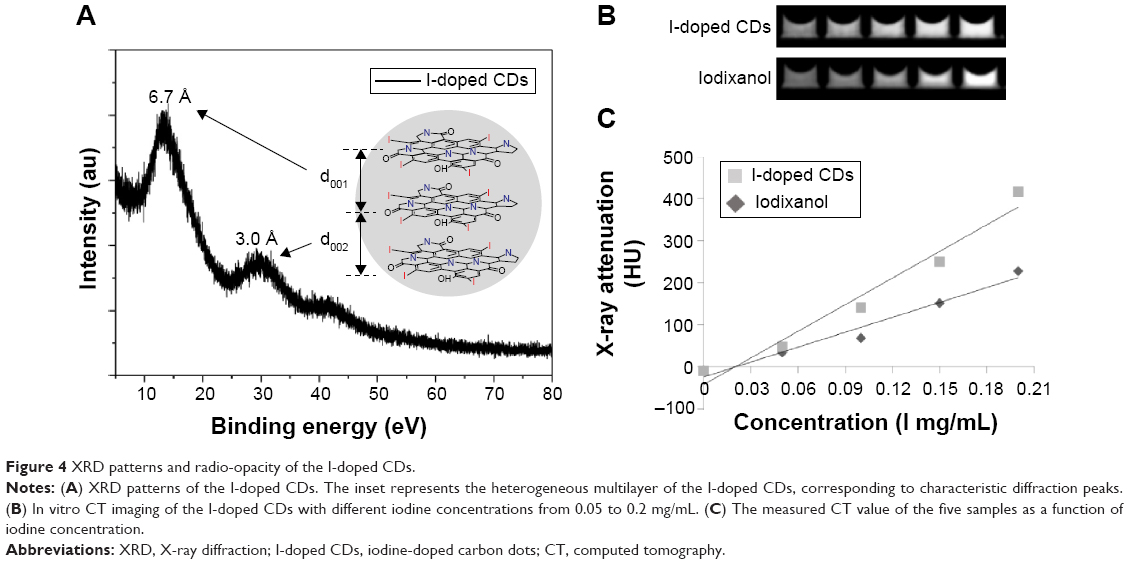 | Figure 4 XRD patterns and radio-opacity of the I-doped CDs. |
The X-ray attenuation and optical property of the I-doped CDs
We then investigated the X-ray attenuation capacity of the I-doped CDs compared with the iodixanol (commercial contrast agents). As shown in Figure 4B, the CT image brightness increased with the I-doped CDs concentration, which was similar to the behavior of the iodixanol. At the iodine concentration of 0.1 mg/mL or above, the CT image was much brighter than those iodixanol under the same dosage of radiation. Further quantitative analysis data show that X-ray attenuation intensity of both I-doped CDs and the iodixanol increased with the mass concentration of radiodense element of the iodine. Nevertheless, the I-doped CDs exhibited much higher X-ray attenuation capacity than iodixanol under the same radiodense element concentrations (0.1 mg/mL or above). The superior X-ray attenuation capacity endowed the I-doped CDs with more sensitive CT imaging applications.
The optical properties of the I-doped CDs were characterized using UV–Vis and PL spectrum (Figure 5). No obvious absorption peak could be observed in the UV–Vis spectrum (Figure 5A). The aqueous solution was pale yellow and transparent in daylight, but emitted bright blue fluorescence under UV excitation (inset, Figure 5A). The maximum emission at 475 nm was observed under 370 nm excitation. Additionally, the PL emission of the I-doped CDs, including the wavelength and intensity in well-regulated mode within the excitation range of 330–510 nm, was wavelength-dependent excitation (Figure 5B). Although the emission peak gradually shifted from 450 to 550 nm with increasing excitation wavelength, the intensity of emission increased and reached a maximum at 390 nm, beyond which the emission intensity gradually decreased. Figure 5C shows the effect of ratio of glycine and iodixanol on the PL of I-doped CDs. When the amount of iodine source equaled that of glycine (surface passivation), the PL intensity of I-doped CDs reached the maximum. The aqueous solution of I-doped CDs exhibited a long-term homogeneous phase without any noticeable precipitation at room temperature. To investigate the dispersibility in water, we used a beam of red light to illuminate the aqueous solution and observe the Tyndall effect clearly (as shown in Figure 5D). These results verified that the prepared I-doped CDs possessed superior fluorescent properties and dispersibility in aqueous solutions.
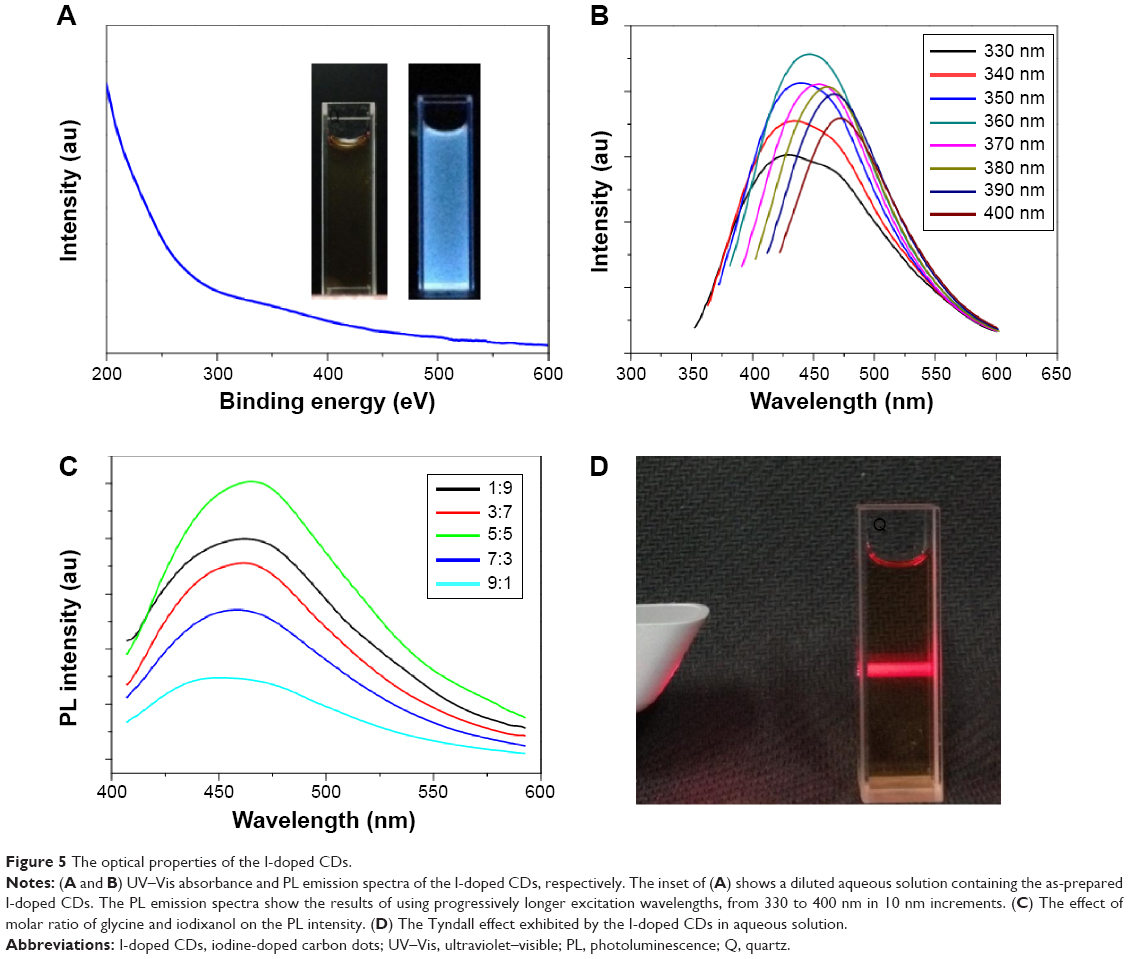 | Figure 5 The optical properties of the I-doped CDs. |
The cytotoxicity and optical imaging of the I-doped CDs
As potential biomedical probes, the good biocompatibility of the I-doped CDs is critical for their biomedical application. In order to validate the cytotoxicity in vitro, the effect of I-doped CDs on 4T1 cells viability was assessed by the MTS assay. As shown in Figure 6A, the I-doped CDs exhibited minimum cytotoxicity. Even at the concentration of 200 μg/mL and a 24-hours exposure time, the cell viability was approximately 90%. It was worth noting that the I-doped CDs could be ready to enter into the cytoplasm and distribute around the nucleus after incubation for 4 hours. We found that the labeled cells emitted bright fluorescence due to the presence of I-doped CDs in cytosol (Figure 6B). Based on this capacity, we propose that the I-doped CDs can be used as potential fluorescence probes for real-time and long-term living cell imaging applications. Additionally, the live-cell fluorescent images showed that there were no morphological differences between the I-doped CD-treated and the vehicle-treated cells. These results clearly suggested that the as-synthesized I-doped CDs had very low cytotoxicity and good biocompatibility.
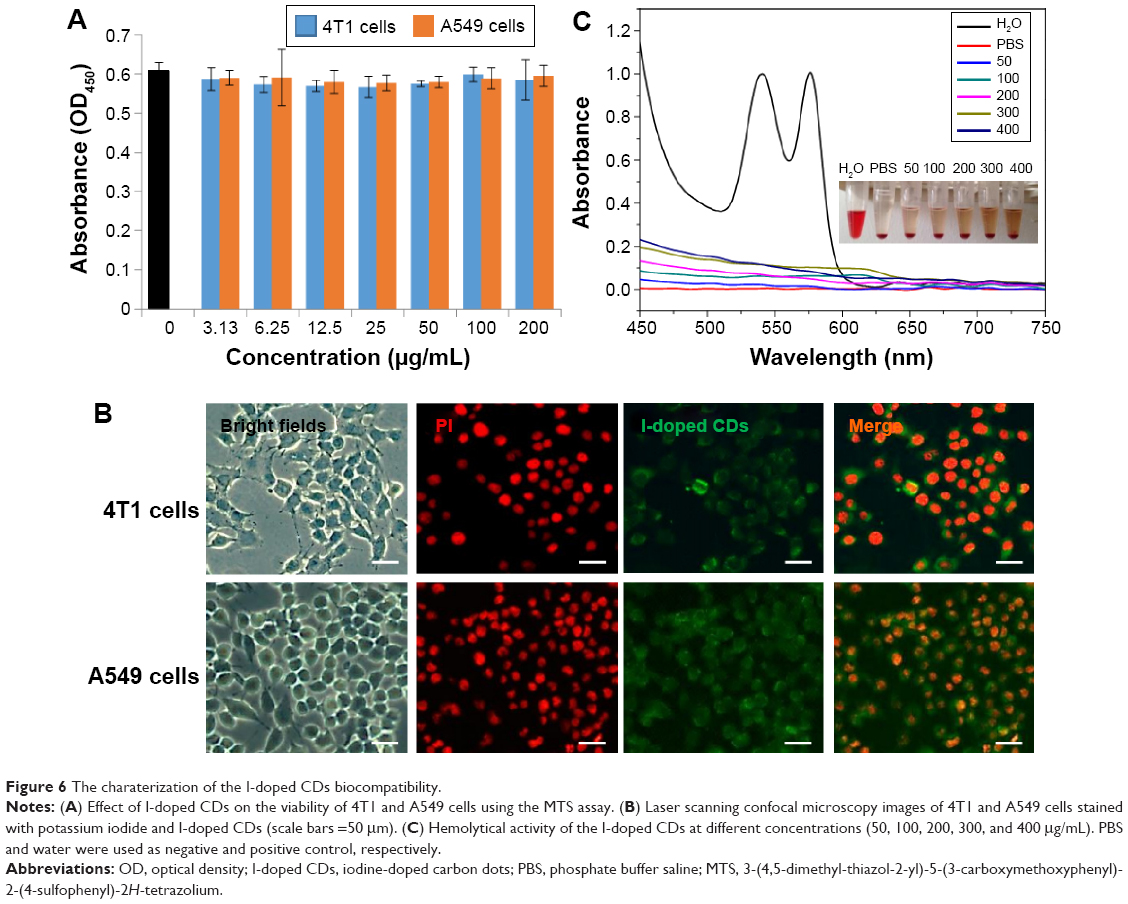 | Figure 6 The charaterization of the I-doped CDs biocompatibility. |
The potential utility of the I-doped CDs as contrast agents for X-ray CT in vivo was evaluated using hemolysis assay. As shown in Figure 6C, we found hemolysis of RBC in the positive control. On the contrary, no obvious hemolysis phenomenon was observed after incubation with different concentrations from 50 to 400 μg/mL for 2 hours, which was similar to the negative normal saline. Compared to the negative control, the percentage of hemolysis at different concentrations of I-doped CDs was quantitatively evaluated based on the absorbance of the supernatant at 541 nm. The results indicated that the hemolysis percentages of the I-doped CDs were all less than 3% in the studied concentration range from 50 to 400 μg/mL, which verified their favorable hemocompatibility.
The biodistribution and the X-ray imaging of the I-doped CDs in vivo
The possibility to use I-doped CDs as contrast agents for CT imaging in vivo was studied using Sprague Dawley rats as a model. After intravenous injection of I-doped CDs at a dose of 40 mg/kg, the CT images were acquired through different scans. Compared with preinjection (Figure 7A), a great contrast enhancement in bladder was observed clearly using the three dimensional (3-D) CT imaging (as shown in Figure 7B). Figure 7C showed that the signal both in the kidney and bladder strongly increased at 10 minutes postinjection, which indicated I-doped CDs accumulation. These results were further confirmed through CT transverse scans at different levels (Figure 7D and E). To further investigate whether I-doped CDs can induce adverse effect (such as tissue damage, inflammation, or lesions) during the long-term postinjection, we conducted the histological assessment of the mouse susceptible organs (liver, heart, spleen, lung, and kidney). As shown in Figure 8, no obvious adverse effect associated with the administration of the I-doped CDs was observed compared with the control group. Based on the results described above, we proposed that the I-doped CDs were rapidly distributed throughout the body and excreted from the bladder.
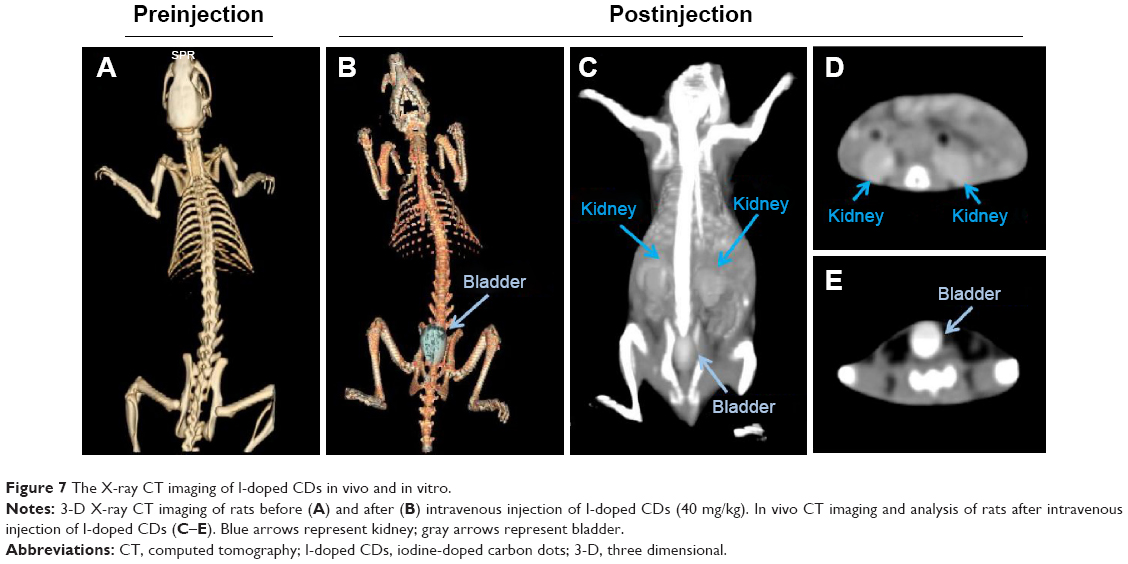 | Figure 7 The X-ray CT imaging of I-doped CDs in vivo and in vitro. |
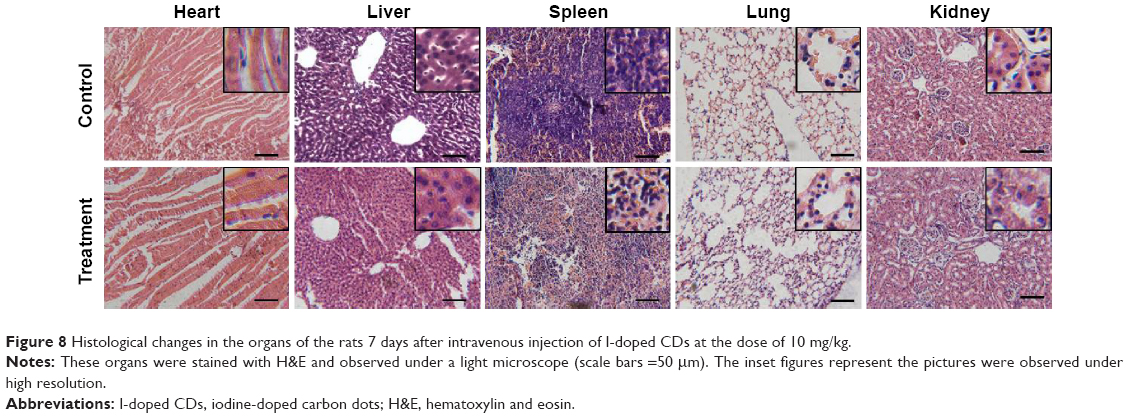 | Figure 8 Histological changes in the organs of the rats 7 days after intravenous injection of I-doped CDs at the dose of 10 mg/kg. |
Usually, large nanoparticles (more than 20 nm) suffered from a high uptake by the reticuloendothelial system and macrophages and rapid accumulation in the mononuclear phagocyte system (eg, liver and spleen), resulting in a short circulation half-time and long-term toxicity issues.30,31 We have demonstrated that the prepared I-doped CDs with ultrasmall size (2.7 nm) could be readily excreted by renal clearance, therefore avoiding nonspecific accumulation in the tissue of host. Importantly, ultrasmall size nanoparticles circulating in the blood might also increase the possibility of passive targeting in tumors by enhancing permeation and retention effect.32,33 Based on these results, we proposed that the I-doped CDs as ideal CT contrast agents had the potential to efficiently target the region of interest (eg, diseased area or tumor), after systemic administration, with unbound rapidly renal clearance from the host.
Conclusion
We have developed dual-modal I-doped CDs for fluorescence and X-ray CT imaging by the HTC of glycine and iodixanol. Encapsulating iodine atoms into the carbon nanoparticles, the resultant I-doped CDs not only effectively overcame the side effect due to the intrinsic biological toxicity of iodine species, but also provided an attractive platform of introducing new physicochemical properties. The I-doped CDs exhibited favorable fluorescence properties and good biocompatibility, which were similar to previously reported carbon nanodots. Importantly, the high atomic number of iodine endowed these nanoparticles with strong X-ray attenuation capacity. The potential applications of I-doped CDs were strengthened by the fact that they could be efficiently excreted through renal clearance after systematic administration. In view of these merits, the novel I-doped CDs used as dual-modal probes have great potential applications in biomedical research and disease diagnosis.
Acknowledgments
The research was supported by the National Natural Science Foundation of China (Nos 81301316, 31200676), PhD Programs Foundation of Ministry of Education of China (No 20123227120008), China Postdoctoral Science Foundation (2013M540425, 2013M542520, 2014T70487, 2015M571705), Senior Talents Scientific Research Foundation of Jiangsu University (Nos 13JDG022, 11JDG113), and Zhenjiang City University Development Fund (No SH2013026).
Disclosure
The authors report no conflicts of interest in this work.
References
Kaittanis C, Shaffer TM, Ogirala A, et al. Environment-responsive nanophores for therapy and treatment monitoring via molecular MRI quenching. Nat Commun. 2014;5:3384. | ||
Zhou Z, Huang D, Bao J, et al. A synergistically enhanced T1–T2 dual-modal contrast agent. Adv Mater. 2012;24(46):6223–6228. | ||
Cho NH, Cheong TC, Min JH, et al. A multifunctional core-shell nanoparticle for dendritic cell-based cancer immunotherapy. Nat Nanotechnol. 2011;6(10):675–82. | ||
Hong G, Lee JC, Robinson JT, et al. Multifunctional in vivo vascular imaging using near-infrared II fluorescence. Nat Med. 2012;18(12):1841–1846. | ||
Smet M, Langereis S, Bosch S, et al. SPECT/CT imaging of temperature-sensitive liposomes for MR-image guided drug delivery with high intensity focused ultrasound. J Control Release. 2013;169(1–2):82–90. | ||
Li WP, Liao PY, Su CH, Yeh CS. Formation of oligonucleotide-gated silica shell-coated Fe3O4-Au core-shell nanotrisoctahedra for magnetically targeted and near-infrared light-responsive theranostic platform. J Am Chem Soc. 2014;136(28):10062–10075. | ||
Stewart RC, Bansal PN, Entezari V, et al. Contrast-enhanced CT with a high-affinity cationic contrast agent for imaging ex vivo bovine, intact ex vivo rabbit, and in vivo rabbit cartilage. Radiology. 2013;266(1):141–150. | ||
Gaedicke S, Braun F, Prasad S, et al. Noninvasive positron emission tomography and fluorescence imaging of CD133+ tumor stem cells. Proc Natl Acad Sci U S A. 2014;111(6):692–701. | ||
Lee N, Choi SH, Hyeon T. Nano-sized CT contrast agents. Adv Mater. 2013;25(19):2641–2660. | ||
Hainfeld JF, O’Connor MJ, Dilmanian FA, Slatkin DN, Adams DJ, Smilowitz HM. Micro-CT enables microlocalisation and quantification of Her2-targeted gold nanoparticles within tumour regions. Br J Radiol. 2011;84(1002):526–533. | ||
Ashton JR, Clark DP, Moding EJ, et al. Dual-energy micro-ct functional imaging of primary lung cancer in mice using gold and iodine nanoparticle contrast agents: a validation study. PLoS One. 2014;9(2):88129. | ||
Jakhmola A, Anton N, Anton H, et al. Poly-epsilon-caprolactone tungsten oxide nanoparticles as a contrast agent for X-ray computed tomography. Biomaterials. 2014;35(9):2981–2986. | ||
Li X, Anton N, Zuber G, et al. Iodinated alpha-tocopherol nano-emulsions as non-toxic contrast agents for preclinical X-ray imaging. Biomaterials. 2013;34(2):481–491. | ||
Myoung HO, Nohyun L, Hyoungsu K, et al. Large-scale synthesis of bioinert tantalum oxide nanoparticles for X-ray computed tomographyimaging and bimodal image-guided sentinel lymph node mapping. J Am Chem Soc. 2011;133:5508–5515. | ||
Yu SB, Watson AD. Metal-based X-ray contrast media. Chem Rev. 1999;99(9):2353–2377. | ||
Wang H, Zheng L, Peng C, Shen M, Shi X, Zhang G. Folic acid-modified dendrimer-entrapped gold nanoparticles as nanoprobes for targeted CT imaging of human lung adencarcinoma. Biomaterials. 2013;34(2):470–480. | ||
Cao L, Wang X, Meziani MJ, et al. Carbon dots for multiphoton bioimaging. J Am Chem Soc. 2007;129(37):11318–11319. | ||
Fan RJ, Sun Q, Zhang L, Zhang Y, Lu AH. Photoluminescent carbon dots directly derived from polyethylene glycol and their application for cellular imaging. Carbon. 2014;71:87–93. | ||
Zhang R, Chen W. Nitrogen-doped carbon quantum dots: facile synthesis and application as a “turn-off” fluorescent probe for detection of Hg2+ ions. Biosens Bioelectron. 2014;55(0):83–90. | ||
Dan L, Tang X, Pulli B, et al. Theranostic nanoparticles based on bioreducible polyethylenimine-coated iron oxide for reduction-responsive gene delivery and magnetic resonance imaging. Int J Nanomedicine. 2014;9:3347–3361. | ||
Du F, Zhang M, Li X, et al. Economical and green synthesis of bagasse-derived fluorescent carbon dots for biomedical applications. Nanotechnology. 2014;25(31):315702. | ||
Du F, Li J, Hua Y, et al. Multicolor nitrogen-doped carbon dots for live cell imaging. J Biomed Nanotechnol. 2015;11(5):780–788. | ||
Li Y, Zhao Y, Cheng H, et al. Nitrogen-doped graphene quantum dots with oxygen-rich functional groups. J Am Chem Soc. 2012;134(1):15–18. | ||
Zhai X, Zhang P, Liu C, et al. Carbon nanoparticle-based fluorescent bioimaging probes. Chem Commun (Camb). 2013;48(64):7955–7957. | ||
Li J, Zheng L, Cai H, et al. Polyethyleneimine-mediated synthesis of folic acid-targeted iron oxide nanoparticles for in vivo tumor MR imaging. Biomaterials. 2013;34(33):8382–8392. | ||
Cai H, Li K, Shen M, et al. Facile assembly of Fe3O4@aunanocomposite particles for dual mode magnetic resonance and computedtomography imaging applications. J Mater Chem. 2012;22:15110–15120. | ||
Wang Y, Duo F, Peng S, Jia F, Fan C. Potassium iodate assisted synthesis of titanium dioxide nanoparticles with superior water-dispersibility. J Colloid Interface Sci. 2014;430:31–39. | ||
Zheng Z, Ai Z, Wang M, Zhang L. Doping iodine in CdS for pure hexagonal phase, narrower band gap, and enhanced photocatalytic activity. J Mater Res. 2011;26(5):710–719. | ||
Du F, Yuan J, Zhang M, et al. Nitrogen-doped carbon dots with heterogeneous multi-layered structures. RSC Adv. 2014;4(71):37536–37541. | ||
Du F, Jin X, Chen J, et al. Nitrogen-doped carbon dots as multifunctional fluorescent probes. J Nanopart Res. 2014;16:2720. | ||
Gao J, Chen K, Xie R, et al. Ultrasmall near-infrared non-cadmium quantum dots for in vivo tumor imaging. Small. 2010;6(2):256–261. | ||
Dong K, Ju E, Liu J, Han X, Ren J, Qu X. Ultrasmall biomolecule-anchored hybrid GdVO4 nanophosphors as a metabolizable multimodal bioimaging contrast agent. Nanoscale. 2014;6(20):12042–12049. | ||
Zhou Z, Wang L, Chi X, et al. Engineered iron-oxide-based nanoparticles as enhanced T1 contrast agents for efficient tumor imaging. ACS Nano. 2013;7(4):3287–3296. |
 © 2015 The Author(s). This work is published and licensed by Dove Medical Press Limited. The
full terms of this license are available at https://www.dovepress.com/terms
and incorporate the Creative Commons Attribution
- Non Commercial (unported, 3.0) License.
By accessing the work you hereby accept the Terms. Non-commercial uses of the work are permitted
without any further permission from Dove Medical Press Limited, provided the work is properly
attributed. For permission for commercial use of this work, please see paragraphs 4.2 and 5 of our Terms.
© 2015 The Author(s). This work is published and licensed by Dove Medical Press Limited. The
full terms of this license are available at https://www.dovepress.com/terms
and incorporate the Creative Commons Attribution
- Non Commercial (unported, 3.0) License.
By accessing the work you hereby accept the Terms. Non-commercial uses of the work are permitted
without any further permission from Dove Medical Press Limited, provided the work is properly
attributed. For permission for commercial use of this work, please see paragraphs 4.2 and 5 of our Terms.