Back to Journals » Diabetes, Metabolic Syndrome and Obesity » Volume 14
Empagliflozin Regulates the AdipoR1/p-AMPK/p-ACC Pathway to Alleviate Lipid Deposition in Diabetic Nephropathy
Authors Zhang Z, Ni L, Zhang L, Zha D, Hu C, Zhang L, Feng H, Wei X, Wu X
Received 13 November 2020
Accepted for publication 24 December 2020
Published 18 January 2021 Volume 2021:14 Pages 227—240
DOI https://doi.org/10.2147/DMSO.S289712
Checked for plagiarism Yes
Review by Single anonymous peer review
Peer reviewer comments 2
Editor who approved publication: Professor Ming-Hui Zou
Zhiqin Zhang, Lihua Ni, Lian Zhang, Dongqing Zha, Chun Hu, Lingli Zhang, Huiling Feng, Xiaobao Wei, Xiaoyan Wu
Department of Nephrology, Zhongnan Hospital of Wuhan University, Wuhan 430071, People’s Republic of China
Correspondence: Xiaoyan Wu
Department of Nephrology, Zhongnan Hospital of Wuhan University, Wuhan 430071, People’s Republic of China
Tel +86 15972935798
Email [email protected]
Background: Abnormal lipid deposition in the progress of diabetic nephropathy (DN) plays an important role in a number of studies that have shown that SGLT2 inhibitor (SGLT2i) empagliflozin plays an important role in lipid metabolism, but its mechanism is still unclear.
Methods: We aimed to explore the effect of empagliflozin on lipid levels in kidney cancer patients with DN and postoperative patients without DN kidney carcinoma; the patients with DN showed ectopic lipid deposition. In type 2 diabetes model mice induced by streptozotocin (STZ) and a high-fat diet, combined AMPK plus empagliflozin or empagliflozin inhibitor plus compound C was applied, followed by analyses of the blood, urine and kidney indexes to observe the correlation between SGLT2i and AMPK and lipid metabolism in diabetic kidney disease. We determined whether DN in patients with renal tubular atrophy involved lipid metabolism.
Results: In clinical specimens, the adiponectin receptor AdipoR1 was reduced, and the phosphorylation acetyl-CoA carboxylase (p-ACC) was increased. In vitro and in vivo pathological immunofluorescence and Western blotting confirmed that, under the condition of high glucose, malpighian tubules displayed ectopic lipid deposition and expressed related lipid parameters accompanied by fibrosis. Empagliflozin intervention reduced lipid deposition fibrosis and renal tubular atrophy, and the addition of compound C promoted disease progression. Moreover, siAdipoR1 transfection proved that AdipoR1 affected P-AMPK and then p-ACC affected lipid metabolism in renal tubular cells.
Conclusion: According to the above experimental results, empagliflozin could reduce lipid metabolism of DN through AdipoR1/P-AMPK/P-ACC pathway and delay DN progress.
Keywords: diabetic nephropathy, empagliflozin, AdipoR1, p-AMPK, p-ACC, lipid
Introduction
Diabetic nephropathy (DN) is a common microvascular disease in diabetes that seriously threatens the survival and prognosis of patients. As the incidence of DN increases annually, the need to delay or prevent the occurrence and progression of DN becomes increasingly important. DN involves marked glomerular changes, leading to glomerulosclerosis, compensatory hypertrophy in early-stage DN and gradual atrophy in late-stage DN.1 Notably, significant changes also occur in renal tubules. In addition to renal tubular atrophy and renal interstitial fibrosis, heterotopic lipid deposition in the renal interstitium has been suggested by some evidence to play a key role in the development of this disease.2 In both participants and victims of diabetes, renal tubules play an important role in its progression. As participants, renal tubular gluconeogenesis, glycolysis, and glucose reabsorption are all involved in glycolipid metabolism. By contrast, systemic dyslipidemia occurs in the kidneys of diabetic patients but is then reduced because of various factors, such as increased glucose absorption in the renal tubules in early-stage disease, increased active transport of oxygen and oxygen consumption, a compensatory increase in the renal unit, inflammatory invasion in the later stage of disease, lipid accumulation, and tubulointerstitial fibrosis.3 Therefore, investigating the mechanism of ectopic lipid deposition in renal tubules in DN would help to fundamentally alleviate the development of this disease.
Sodium glucose transporter 2 (SGLT2) is expressed in segment S1 of the renal tubule and performs 90% of renal glucose reabsorption. Empagliflozin, an inhibitor of SGLT2, competitively binds glucose transporters, reduces glucose reabsorption by renal tubular epithelial cells, and promotes the excretion of glucose in urine, exerting a hypoglycemic effect.4 More importantly, SGLT2 inhibitors (SGLT2is) act independent of islet cells and insulin in vivo, improve islet function and promote increased glucagon, benefiting patients with diabetes and islet insufficiency, and have good clinical applicability.5 Additionally, the advantages of SGLT2is include their ability to lower blood pressure, reduce body weight and proteinuria, downregulate uric acid (UA), decrease glycosylated hemoglobin, increase high-density lipoprotein (HDL-C), and improve triglyceride (TG) and cholesterol accumulation.6 This study aimed to investigate the effect of empagliflozin, an SGLT2i, on lipid metabolism in DN.
Mechanistically, lipid metabolism in DN may proceed through the AdipoR1/p-AMPK/p-ACC pathway. AdipoR1, an adiponectin receptor, is downregulated in renal tubular epithelial cells in DN, fatty liver, and skeletal muscle under a high-fat diet and is related to lipophagy, and the pathway downstream of AdipoR1 is associated with the p-AMPK pathway involved in glucogenic inhibition.7 Furthermore, P-AMPK can inactivate ACC through phosphorylation, inhibit the formation of fatty acids, and directly affect lipid metabolism.8 The AdipoR1/p-AMPK/p-ACC pathway is involved in lipid metabolism based on various models, while the use of different SGLT2is, such as dapagliflozin, canagliflozin and empagliflozin, improves lipid metabolism, with some involving AMPK and ACC.9 Additionally, because AdipoR1/p-AMPK/p-ACC in specimens strongly correlates with lipid deposition in DN, we speculate that lipid metabolism may be regulated through AdipoR1/p-AMPK/p-ACC in DN.
Materials and Methods
Materials
Rabbit monoclonal anti-AdipoR1 antibody (cat. no. ab126611) was purchased from Abcam (Cambridge, MA, USA). Rabbit monoclonal anti-p-AMPK antibody (cat. no. 2535), rabbit monoclonal anti-AMPK antibody (cat. no. 5831), rabbit monoclonal anti-p-ACC antibody (cat. no. 11,818), and rabbit monoclonal anti-ACC antibody (cat. no. 3676) were purchased from Cell Signaling Technology (Danvers, MA, USA). HRP-conjugated goat anti-rabbit (cat. no. 5220–0336) and HRP-conjugated goat anti-mouse (cat. no. 5220–0341) antibodies were purchased from SeraCare (Milford, MA, USA). Streptozotocin (STZ; cat. no. SO130) was purchased from Sigma (St. Louis, MO, USA). Both empagliflozin (cat. no. HY-15,409) and dorsomorphin (cat. no. HY-13418A) were from MedChemExpress (Monmouth Junction, NJ, USA).
Clinical Sample Analysis
The paraffin specimens of postoperative tissue adjacent to the carcinoma were collected from 36 patients with stage III DN (DN group; n=18) and non-DN (NC group; n=18) who had undergone kidney cancer resection at Zhongnan Hospital of Wuhan University. The staging criteria of diabetic nephropathy were determined by more than two pathologists according to the staging criteria of diabetes, and basic preoperative information and clinical features were obtained. These procedures were approved by Wuhan Zhongnan Hospital ethical review. The pathological staining results from HE, Masson’s trichrome, PAS and oil red O staining, the expression of AdipoR1 and p-ACC, which are related to lipid metabolism, by immunohistochemistry, and the results of renal function tests in the DN and CN groups were analyzed. The experimental protocol was approved by the Medical Ethics Committee of Zhongnan Hospital of Wuhan University, and all subjects provided written informed consent. This study was conducted in accordance with the Declaration of Helsinki.
Animals and Experimental Design
Thirty-two 6- to 8-week-old male C57 mice were purchased from Three Gorges University (Yichang, China) and Liaoning Changsheng Biotechnology Co., Ltd (Liaoning, China). The animals were randomly divided into 4 groups: normal control group (8 mice), diabetic group (8 mice), diabetic plus empagliflozin group (8 mice), and diabetic plus empagliflozin and compound C group (8 mice). All the mice were housed under specific pathogen-free (SPF) conditions. The feeding environment had a temperature of 22–26°C and a relative humidity of 50%-60%, and artificial light and shade were provided for 12 h each. First, the animals had undergone adaptive feeding for 7 d and were allowed to drink water and food freely. Subsequently, the diabetic mice were administered a high-fat diet and fasted for 16 h without water. STZ at a dosage of 70 mg/kg/d was continuously administered by intraperitoneal injection for 2 d, followed by high-fat feeding for 4 weeks. Blood glucose was measured after fasting for 12 h, and a blood glucose concentration >16.7 mmol/L was used to indicate successful modeling.10 After 2 weeks, the mice in the diabetic plus empagliflozin group were administered 10 mg/kg/d of empagliflozin by gavage, while those in the diabetic plus empagliflozin and compound C group were given 10 mg/kg/d of compound C and 10 mg/kg/d of empagliflozin.11 After 8 weeks of intervention, all the mice were anesthetized with pentobarbital sodium. The animal experimental protocol was approved by the Institutional Animal Use and Care Committee at Zhongnan Hospital of Wuhan University (Wuhan, China). All animal work was performed at Wuhan Myhalic Biotechnological Co., Ltd. The institutional review board confirmed that the animal experiment design in the application was reasonable, conformed to the “3R” principle of laboratory animals, and strictly complied with the “Guidelines for the Use and Management of Laboratory Animals” issued by the National Institutes of Health (NIH) of the USA and relevant regulations of the “Implementation Rules for the Management of Medical Laboratory Animals” issued by the National Health and Family Planning Commission of China. The investigators were qualified to undertake the proposed project. All the materials met the requirements of the “Ethical Review System for Laboratory Animal Welfare of Wuhan Myhalic Biotechnology Co., Ltd.”
Culture and Treatment of HK-2 Cells
HK-2 human tubular epithelial cells were purchased from the ATCC Cell Bank (Shanghai, Chinese Academy of Sciences). The cells were cultured in complete medium comprising 10% fetal bovine serum, 1% penicillin and streptomycin, and low-glucose DMEM (HyClone). The cells were cultured in an incubator containing 5% CO2 and 95% moist air, and the temperature was 37°C. All the cells were used at generations 10–15. The culture medium was changed every 48 h, and serum-free medium was used when the cells reached 70% confluence. The cells were starved for 24 h and then collected after 48 h of intervention with prepared high-glucose medium (30 mM glucose), empagliflozin (500 nM) or compound C (10 µM).12 For cell transfection, HK-2 cells were cultured in plates for 24 h and then transfected with si-AdipoR1 or the corresponding controls (RiBoBio Co., Guangzhou, China) using Lipofectamine 2000 reagent (Invitrogen, Carlsbad, CA, USA) under high-glucose medium plus empagliflozin for comparison with cells under high-glucose medium. The cells were incubated for another 48 h before subsequent experiments.
Detection and Sampling of Mice
The blood glucose of the mice was measured from the tail vein using a blood glucose meter (cat. no. 306; Yuyue). Urine specimens were collected one day before death, and the urine protein levels were measured (cat. no. E083-1-1). All ELISA kits were purchased from Jiancheng Company (Nanjing). Blood was collected from the anesthetized mouse hearts, and serum was collected after centrifugation at 4000 rpm for 10 min. Blood glucose, serum creatinine (Scr), blood urea nitrogen (BUN), blood total cholesterol (TC), blood TG, HDL-C, and blood low-density lipoprotein (LDL-C) were measured using an automatic biochemical analyzer (Shenzhen Mindray, BS-420), while free fatty acids were measured using a NEFA ELISA kit (A042-1-1). The mice were weighed after anesthesia, and the kidney tissue was weighed after death. The left kidney was fixed in a formaldehyde fixative solution and embedded in paraffin. Next, the wax block was cut into 3-µm-thick slices for subsequent immunohistochemical and pathological staining. The right kidney was frozen; part of the right kidney was used to generate frozen sections for oil red O staining, and the rest was used for further protein testing.
Immunohistochemical Staining
The paraffin sections from the left kidney were dewaxed, and antigen repair was performed by microwave heating. Endogenous peroxidase was blocked with 3% hydrogen peroxide in the dark for 10 min at room temperature. After washing with phosphate-buffered saline (PBS), a circle was drawn around the tissue using an immunohistochemical pen. Five percent bovine serum albumin (BSA) was used to incubate samples within the circle for 30 min to seal the serum. The serum was absorbed with filter paper, after which primary antibody (anti-AdipoR1 antibody, 1:100; anti-p-ACC antibody, 1:400) was added. After washing with PBS 3 times for 5 min, secondary antibodies of the same species were added, and the nuclei were restained with hematoxylin and colored by diaminobenzidine (DAB) staining at room temperature away from light for 50 min. The cumulative optical density (IOD) values of adipoR1 and p-ACC were measured by immunohistochemistry for intergroup comparison.
Immunofluorescence
The cell slides were fixed with 4% paraformaldehyde at room temperature for 15min and washed with PBS. Membrane breaking solution was added for incubation at room temperature for 10min (it was not needed in AdipoR1). After washing with PBS, the cells were blocked by 3%BSA for 10min. The cells were incubated with rabbit anti-AdipoR1 (1:200, Abcam) and rabbit anti-p-ACC (1:100, CST) primary antibodies dissolved in blocking solution overnight at 4◦C in the dark. The secondary antibody of the species corresponding to the primary antibody was used to incubate at room temperature in dark for 50min. DAPI dyes to dye the nucleus at room temperature after incubation for 10 min PBS washing, using fluorescence quenching sealing seal tablets. Then, taking photos through fluorescence microscope, using Image-Pro Plus 6.0 software for semi-quantitative analysis by converting the green fluorescence monochrome Image to black and white photos, and then select the same black as a unified standard to determine all the photos as based on the analysis of each photo, getting each Image are cumulative values optical density (IOD).
HE, Masson’s Trichrome, PAS, and Oil Red O Staining
For HE staining, paraffin sections were dewaxed in water, washed and stained with hematoxylin and eosin. For Masson’s trichrome staining, the paraffin sections were placed in water. Ferric lignin was then added, the sections were washed, and glacial acetic acid differentiation liquid was added for differentiation. After that, the supernatant was removed, acid magenta was added, and the cells were washed. After covering the sections with an aqueous molybdophosphate solution, they were incubated with an aniline blue dye solution. For PAS staining, after dewaxing, the sections were dyed with periodate and washed with hematoxylin dye, and the blue color in the sections was developed. After rinsing with running water, the sections were dyed with Schiff’s reagent for 30 min while avoiding light and then washed. After that, hematoxylin dye was added, and the blue color was developed. For oil red O staining, the frozen sections were reheated, dried, fixed in fixation solution for 15 min, washed with water, and dried. The sections were then placed into a solution of oil red O dye in the dark, and washed in distilled water. Next, the sections were stained with hematoxylin solution, differentiated, and washed, and the blue color was developed. HE staining showed the morphology of the glomeruli and tubules. Masson’s trichrome staining was used to measure the percentage of the collagen fiber area. Oil red O staining was used to measure lipid droplets. PAS staining was used to measure the thickness of the renal tubule basement membrane. Three fields from each section in each group were selected for photography at 200×. When the photographs were taken, the tissue filled the whole field of vision to ensure that the background light for each photograph was consistent. After measurement, the average value was calculated, and a corresponding bar chart was prepared.
Western Blot Analysis
Proteins were extracted from cells and tissues using RIPA protein extraction reagent containing protease and phosphatase inhibitors. After the protein concentration was measured using the bicinchoninic acid (BCA) method, equal amounts of samples containing 40 µg of protein were used. An appropriate amount of 5× protein loading buffer was added to each protein sample, and the sample was heated at 95°C in a bath for 5 min. After the proteins were separated by polyacrylamide gel electrophoresis (SDS-PAGE), they were transferred to a membrane that was then incubated with 5% skim milk at room temperature. After that, the proteins were incubated in diluted primary antibody overnight at 4°C and then in diluted secondary antibody at room temperature for 1 h. A solution of Tris-HCl buffer plus Tween (TBST) was used as cleaner for each step above, and the blots were incubated on a shaking platform. Finally, after electrochemiluminescence (ECL) detection, the gray values in the strip were analyzed by ImageJ. The following antibodies were used: anti-AdipoR1 antibody (1:1000), anti-p-AMPK antibody (1:1000), anti-AMPK antibody (1:1000), anti-p-ACC antibody (1:1000), anti-ACC antibody (1:1000), and HRP-conjugated goat anti-rabbit (1:5000).
Quantitative Reverse Transcription
Total RNA was extracted using TRIpure total RNA extraction reagent (ELK Biotechnology Co., Ltd.). After the quality of total RNA was detected using a NanoDrop 2000 system (Thermo), reverse transcription into cDNA was performed using the PrimeScript RT reagent kit (TaKaRa, Dalian, China). qRT-PCR was then performed using a SYBR Green PCR kit (Toyobo, Osaka, Japan) and the ABI 7500 PCR system (Applied Biosystems). The primers used for target amplification were as follows: AdipoR1: forward 5ʹ-AAAGCTGAAGAAGAGCAAACATG-3ʹ; reverse 5ʹ-AGTCAGGGAGCACATCATATGG-3ʹ and phospho-glyceraldehyde dehydrogenase (GAPDH): forward 5ʹ-CATCATCCCTGCCTCTACTGG-3ʹ; reverse 5ʹ-GTGGGTGTCGCTGTTGAAGTC-3ʹ. Each reaction was conducted in triplicate, and the relative expression levels of the targets were determined according to threshold cycle (Ct) values using the 2−ΔΔCT method.
Statistical Analyses
All the data were tested for normality and homogeneity of variance before analysis. All the data were expressed as means ± SEM. Comparisons between renal cancer specimens were performed by independent samples t-test. Comparisons between cells and animals were performed by one-way ANOVA, and pairwise comparisons between groups were performed by LSD. P<0.05 was used to indicate statistical significance. SPSS software (version 18.0; Chicago, IL, USA) was used for data analysis.
Results
AdipoR1 and p-ACC Levels and Renal Function in DN
Clinical renal function examination showed that the renal function of the DN group was significantly decreased compared with that of the control group. The following serological indicators were increased in the DN group (Table 1): BUN, Scr, UA and cystatin C (CysC). Additionally, IHC analysis of kidney slices from DN patients showed that the expression levels of AdipoR1 and p-ACC, which are related to lipid metabolism, were decreased compared with those in the control group, while Masson’s trichrome and PAS staining showed increased glomerular compensation in the DN group. Furthermore, renal interstitial and perivascular fibrosis were aggravated, and renal tubules were obviously atrophied (Figure 1).
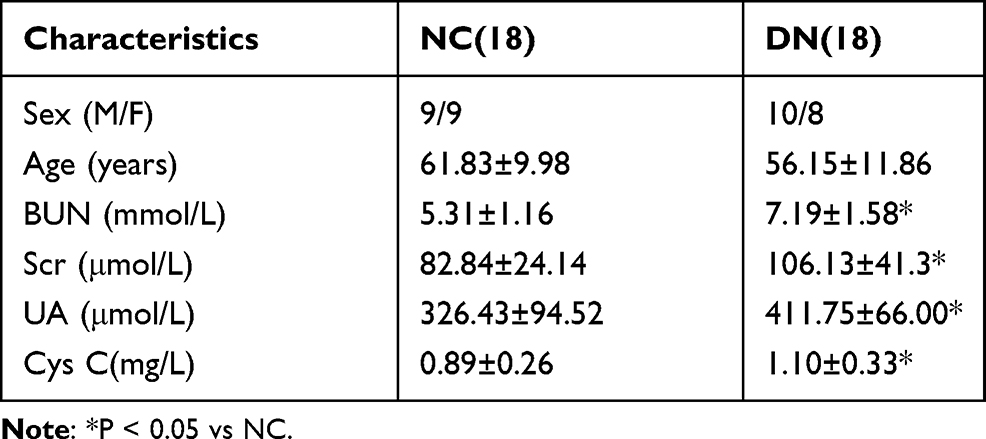 |
Table 1 Baseline Characteristics of Patients with DN and Normal Controls |
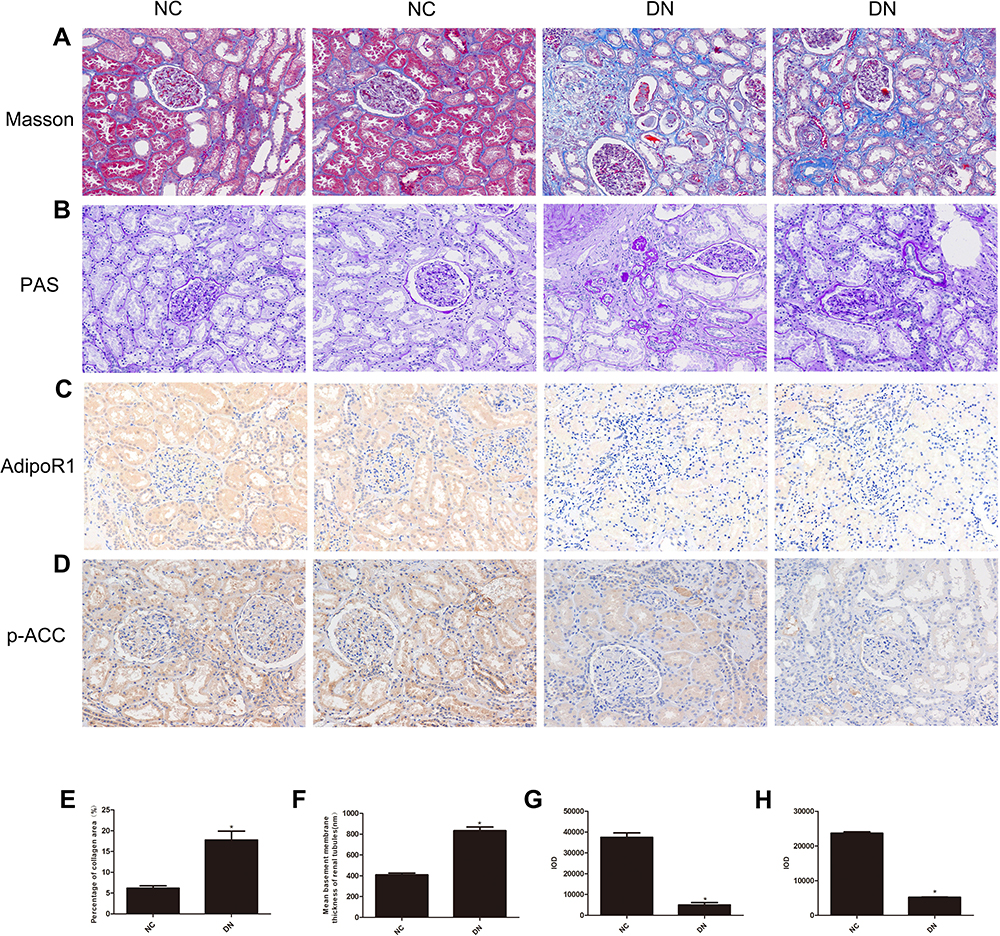 |
Figure 1 Histopathological examination of nondiabetic adjacent normal kidney tissues (NC) and renal biopsy sections from DN patients. Representative images showing (A) Masson’s trichrome staining, (B) PAS staining, (C) immunohistochemical staining for AdipoR1, and (D) immunohistochemical staining for p-ACC. All the images are magnified 200×. Quantitative analysis of the (E) percentage of the collagen fiber area, as shown by Masson’s trichrome staining, (F) Mean basement membrane thickness of renal tubules, as shown by PAS staining, (G) Cumulative optical density values for AdipoR1 and (H) p-ACC, as determined by immunohistochemistry. All the data are expressed as means ± SEMs (*p < 0.05 vs NC). |
Effects of Empagliflozin on DN
Empagliflozin significantly improved the renal function of DN mice. The average renal function of the DN mice with empagliflozin intervention was significantly improved compared with that of the control diabetic mice. Urine testing showed decreased urinary albumin in the DN+Em group. Blood analysis confirmed that renal function was improved in this group because the BUN and Scr levels were decreased, as well as the TC, TG, LDL-C, and NEFA levels, while the HDL-C levels increased. However, the renal function of the diabetic mice in the empagliflozin plus compound C group was significantly decreased compared with that of the empagliflozin group, with a dramatic decrease in p-AMPK (Table 2). This finding suggests that p-AMPK plays an important role in empagliflozin intervention in diabetes.
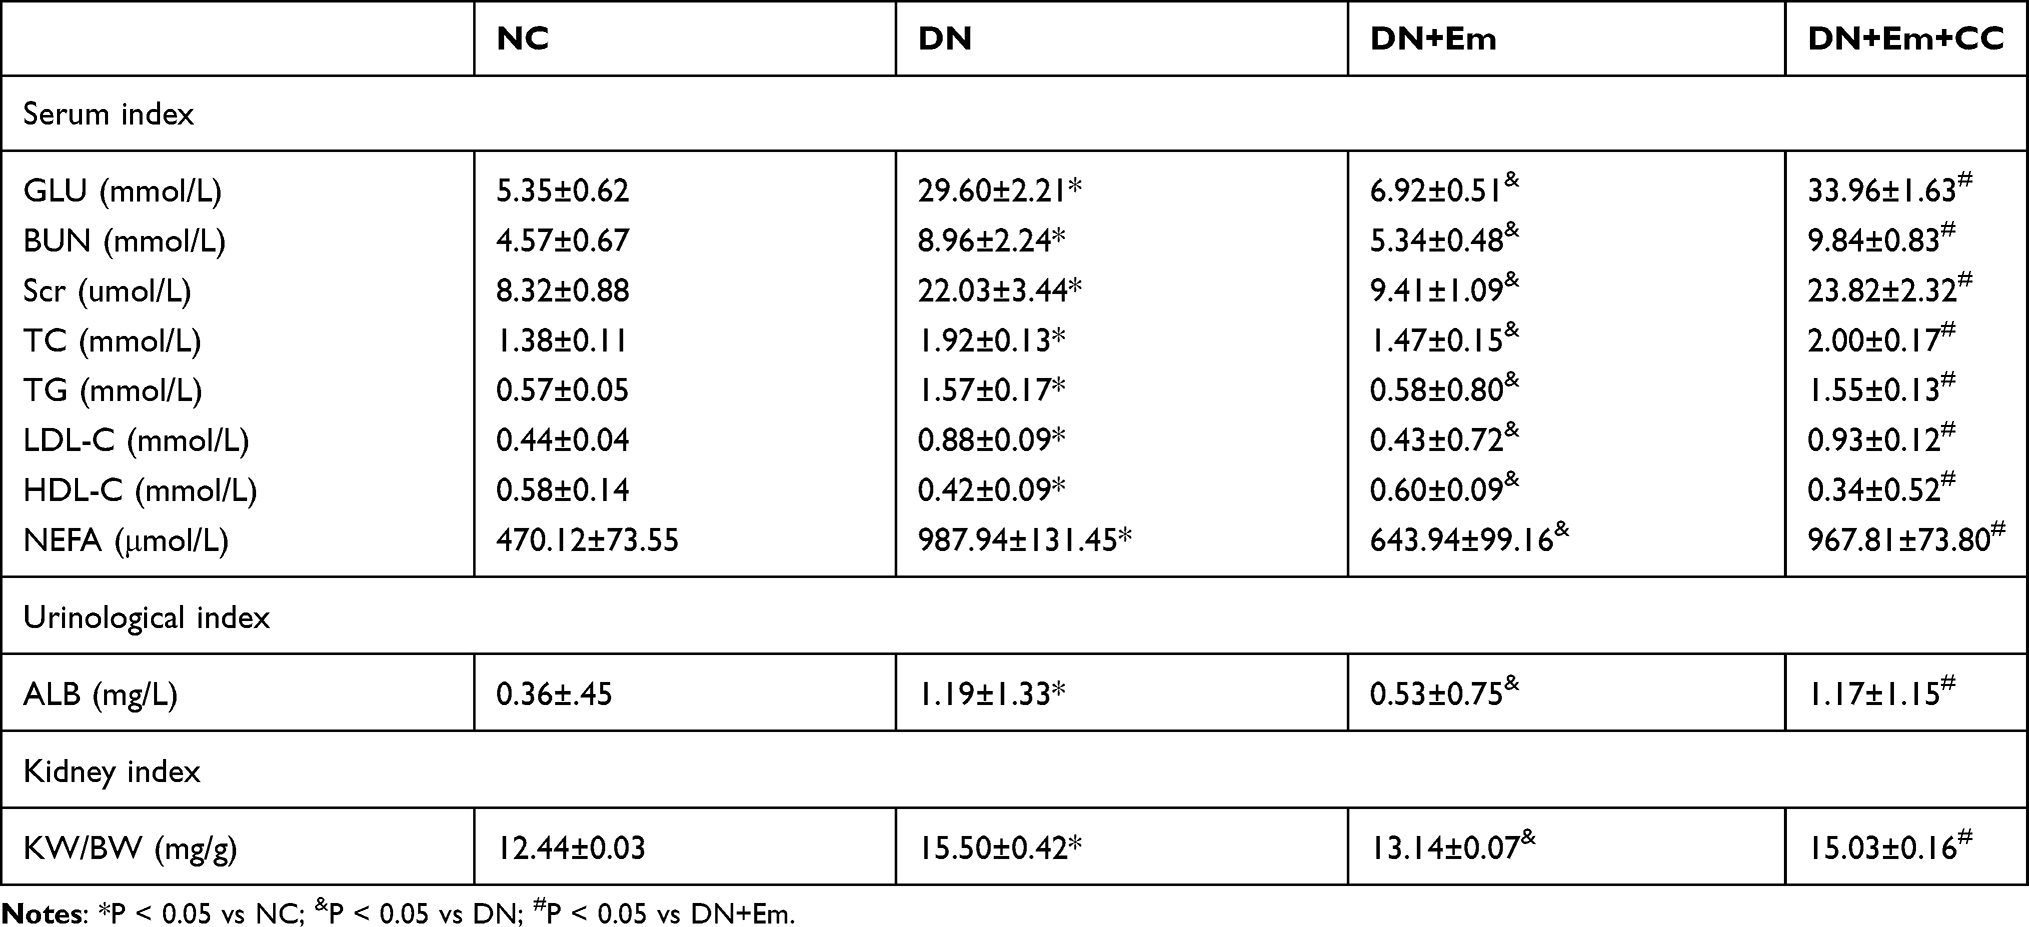 |
Table 2 Effect of Empagliflozin on Renal Functional Parameters and Lipid Metabolism Parameters in Mice in the Diabetic (DN), Diabetic Plus Empagliflozin (DN+Em) and Diabetic Plus Empagliflozin Plus Compound C (DN+Em+CC) Groups |
Masson’s trichrome, PAS and oil Red O staining of the kidneys of the above 4 mouse groups showed that empagliflozin reduced the histological and morphological changes related to DN and improved renal interstitial fibrosis and lipid deposition. Additionally, the IHC results showed that AdipoR1, which promotes lipid metabolism, and p-ACC, which inhibits fatty acid synthesis, were upregulated under the action of empagliflozin (Figure 2). Moreover, Western blot analysis of renal tissue showed that empagliflozin upregulated AdipoR1, p-AMPK and p-ACC at the protein level. However, renal interstitial fibrosis was significantly increased in the empagliflozin plus compound C group compared with that in the empagliflozin group. Additionally, AMPK and p-ACC were downregulated, indicating that p-AMPK plays an important role in empagliflozin intervention in diabetes (Figure 3).
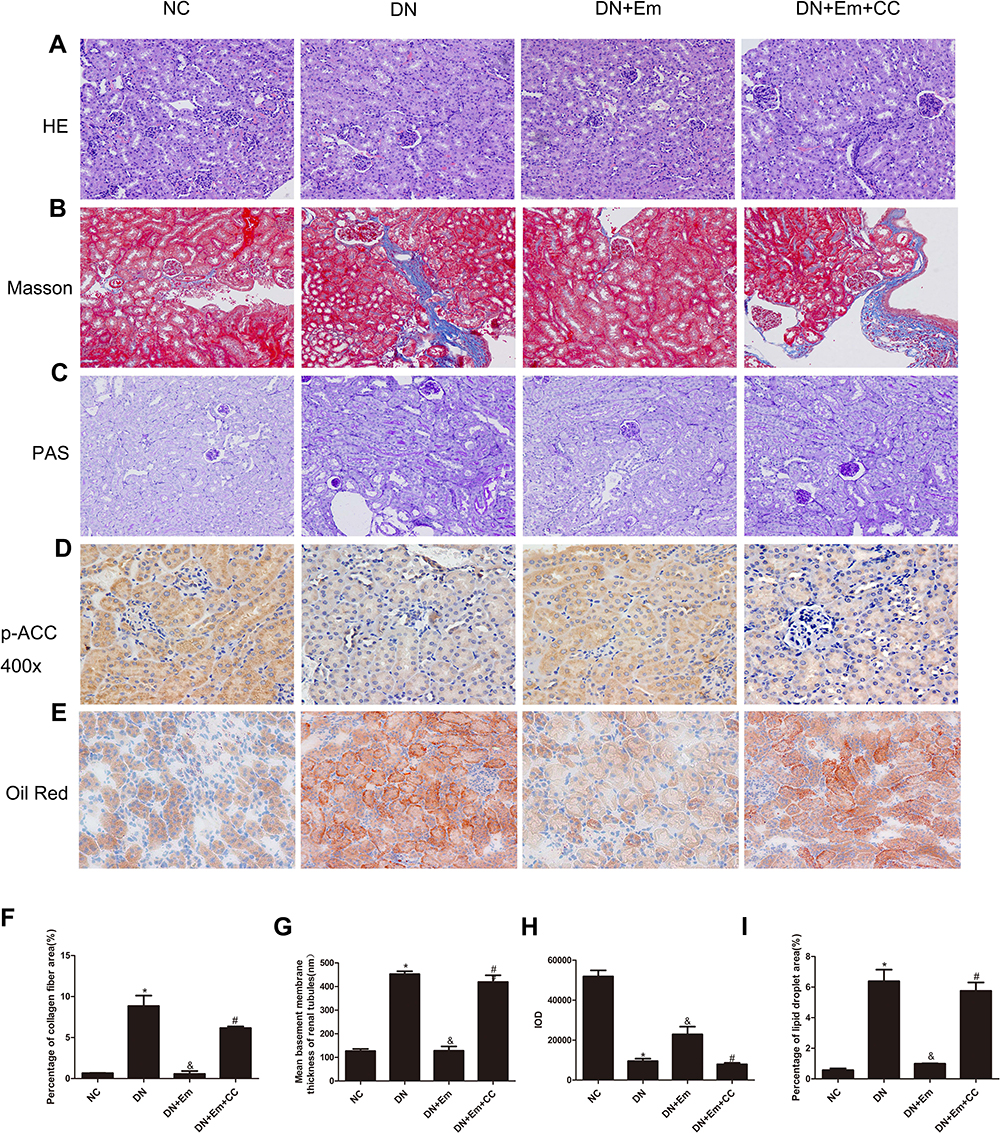 |
Figure 2 Histopathological examination of renal tissue in mice in the negative control (NC), diabetic (DN), diabetic plus empagliflozin (DN+Em) and diabetic plus empagliflozin plus compound C (DN+Em+CC) groups. (A–E) Representative photomicrographs showing H&E, Masson’s trichrome, PAS, immunohistochemical staining for AdipoR1 (400×) and oil red O staining. All images are magnified 200×. (F–I) Quantification of the Masson’s trichrome, PAS, immunohistochemical staining for AdipoR1 and oil red O staining results. *p < 0.05 vs NC; &p < 0.05 vs DN; #p < 0.05 vs DN+Em. |
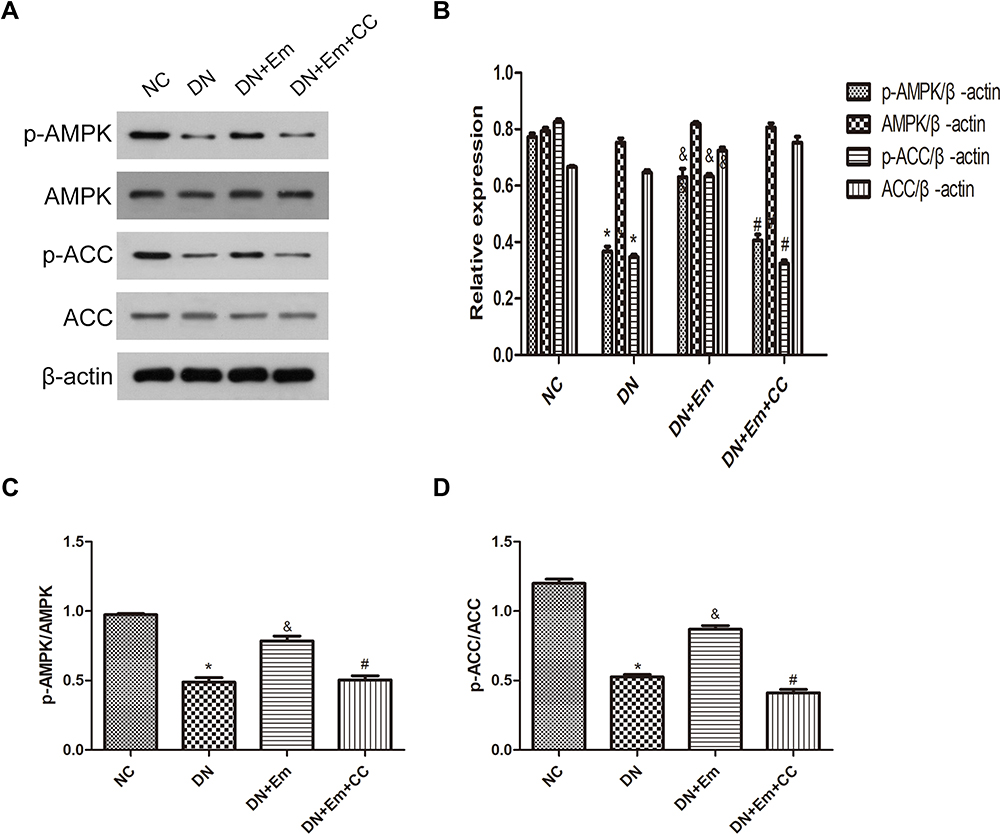 |
Figure 3 (A) Protein expression analysis of p-AMPK, AMPK, p-ACC and ACC in mice in the negative control (NC), diabetic (DN), diabetic plus empagliflozin intervention (DN+Em), and diabetic plus empagliflozin plus compound C (DN+Em+CC) groups. (B) Histogram of p-AMPK, AMPK, p-ACC and ACC expression. (C and D) Histogram of p-AMPK/AMPK and p-ACC/ACC ratios.*p < 0.05 vs NC; &p < 0.05 vs DM; #p < 0.05 vs DM+Em. |
Influence of Empagliflozin on HK-2 Cells Under High Glucose
HK-2 cells were divided into a normal group (5.5 mM glucose), a high-glucose group (30 mM glucose), high-glucose + empagliflozin (500 nM) group, and a high-glucose + empagliflozin + compound C (10 µM) group. Western blotting revealed protein levels consistent with the results in the different mouse groups; empagliflozin increased the protein levels of p-AMPK and p-ACC. In the empagliflozin plus compound C group, p-AMPK and p-ACC were decreased compared with the corresponding levels in the empagliflozin group (Figure 4). These results suggest that empagliflozin improves lipid deposition in renal tubules in DN by the AdipoR1/p-AMPK/p-ACC pathway. After transfection with AdipoR1 siRNA, AdipoR1 was reduced at the RNA and protein levels, but no difference in AdipoR1 was found between the control group transfected with NC siRNA and nontransfected group, indicating effective transfection. Western blotting after transfection showed less AdipoR1 expression in the group transfected with AdipoR1 siRNA and administered high glucose plus empagliflozin, accompanied by reduced p-AMPK and p-ACC expression, compared with that in the high-glucose plus empagliflozin group. AdipoR1, p-AMPK and p-ACC were increased in the high-glucose plus empagliflozin group compared with that in the high-glucose group, indicating that empagliflozin regulates the AdipoR1/p-AMPK/p-ACC pathway in HK-2 cells under high-glucose conditions (Figure 5).
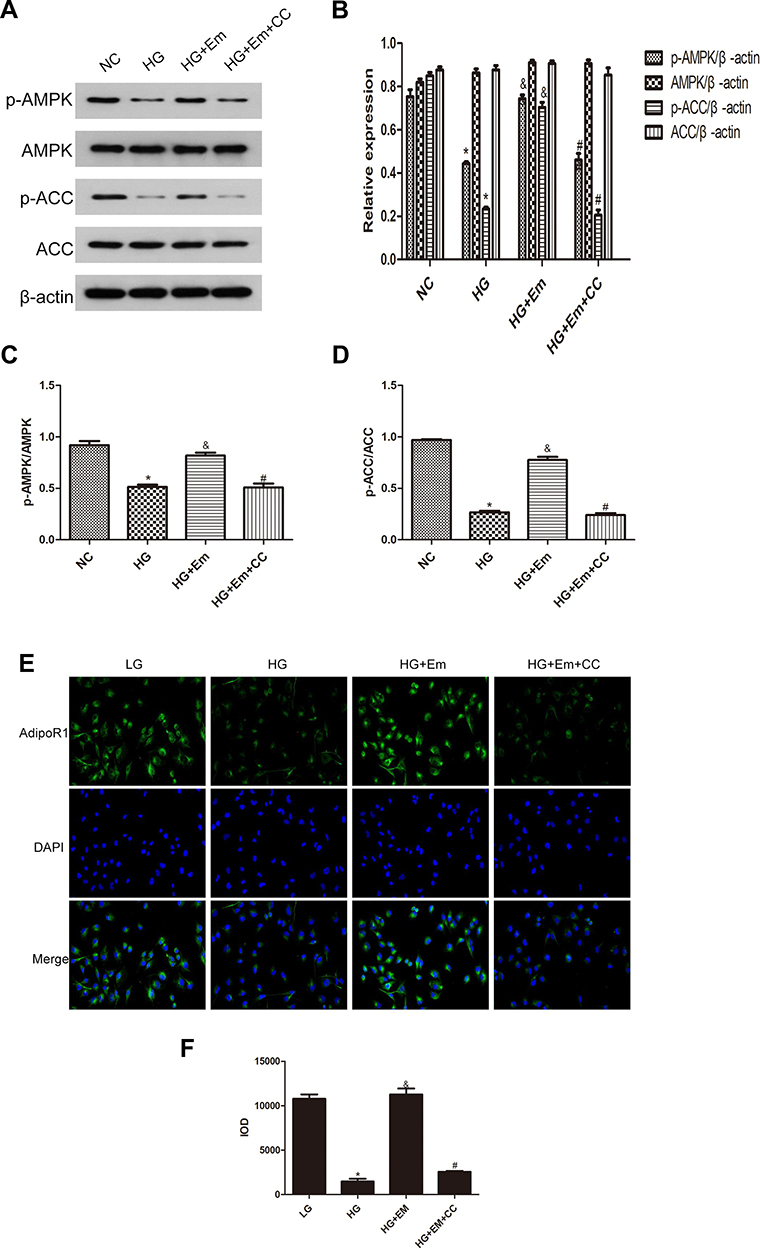 |
Figure 4 (A) Protein expression analysis of p-AMPK, AMPK, p-ACC and ACC in low-glucose HK-2 cells (NC), high-glucose HK-2 cells (HG), high-glucose plus empagliflozin-treated HK-2 cells (HG+Em), and high-glucose plus empagliflozin plus compound C HK-2 (HG+Em+CC) cells. (B) Histogram of p-AMPK, AMPK, p-ACC and ACC expression. (C and D) Histogram of the p-AMPK/AMPK and p-ACC/ACC ratios. (E) Representative images and of immunofluorescence staining for AdipoR1. All images are magnified 200x. (F) Cumulative optical density values for AdipoR1 *p<0.05 vs. NC; &p<0.05 vs. HG; #p<0.05 vs. HG+Em. |
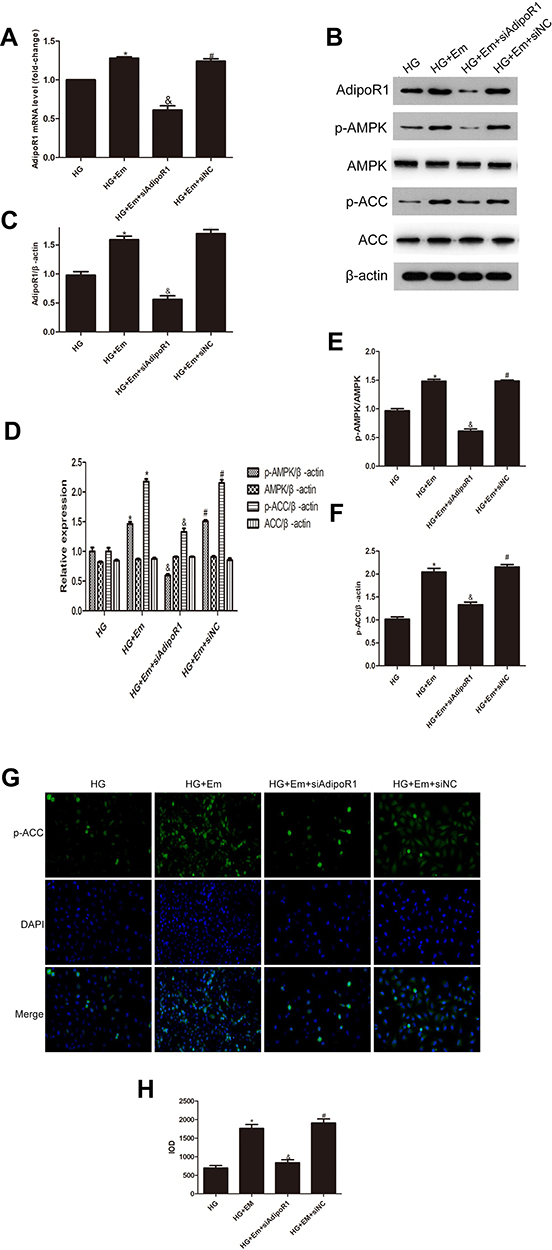 |
Figure 5 Levels of AdipoR1, p-AMPK, AMPK, p-ACC and ACC in HK-2 cells transfected with siAipoR1 or siNC and treated with empagliflozin under high-glucose conditions. (A) RNA level of AdipoR1. (B) Protein levels of AdipoR1, p-AMPK, AMPK, p-ACC and ACC. (C–F) Histogram of the protein levels of AdipoR1, p-AMPK, AMPK, p-ACC and ACC. (E) Representative images and of immunofluorescence staining for p-ACC. All images are magnified 200x. (F) Cumulative optical density values for p-ACC. *p < 0.05 vs HG; &p < 0.05 vs HG+Em; #p < 0.05 vs HG+Em+siAdipoR1. (G) Representative images and of immunofluorescence staining for p-ACC. All images are magnified 200x. (H) Cumulative optical density values for p-ACC *p < 0.05 vs HG; &p < 0.05 vs HG+Em; #p < 0.05 vs HG+Em+siAdipoR1. |
Discussion
One of the most common complications of diabetes, a systemic metabolic disease that often involves all organs of the body, is end-stage renal disease, which seriously affects patient quality of life. Abnormal glucose metabolism, abnormal lipid metabolism, oxidative stress, the inflammatory response, hemodynamic disorders, and genetic factors are all involved in the progression of DN.13–15 Because the conversion between glucose and fat is critical in the human body, two of the three major types of metabolites are regulated by this process. Additionally, lipid toxicity is often a cause of oxidative stress, the inflammatory response, and hemodynamic disorders. Studies have shown significant heterotopic lipid deposition in the renal tubules in DN, and empagliflozin improves lipid metabolism abnormalities in DN and other diseases.16–19 Empagliflozin improves endothelial function, reduces atherosclerosis, and restores vascular tension in patients with type 2 diabetes. Additionally, empagliflozin relieves muscle pain and weakness and alleviates non-alcoholic fatty liver disease in patients with type 2 diabetes. Furthermore, empagliflozin inhibits oxidation, inflammation and apoptosis by reducing the glucose levels in rats with transient ischemic reperfusion injury, alleviating the type 2 diabetes animal model of cerebral injury and cognitive impairment, and inhibiting myocardial cell aging in diabetic mice. Additionally, empagliflozin improves cardiac function in individuals with diabetes, with improvement in most of the organs under empagliflozin intervention.20–23 Therefore, in this study, we investigated the effect of empagliflozin among SGLT2is on lipid metabolism in DN.
When excessive energy accumulates in the body, the conversion barrier exceeds the capacity to store subcutaneous white adipose tissue, and heterotopic lipid deposition occurs in the liver, kidney and skeletal muscle.24 The adiponectin receptor, which is closely related to fat storage and transformation,25 is a seven-transmembrane helical G protein-coupled receptor that exists in two forms, AdipoR1 and AdipoR2. AdipoR1 is believed to be related to the inhibition of AMPK activation in gluconeogenesis, metabolic regulation and energy management, and several studies have shown AdipoR1 to be downregulated in renal tubules in DN.26,27 Furthermore, AdipoR1 induces extracellular Ca2+ influx and activates calmodulin-dependent protein kinase (CaMM), which further activates phosphorylated AMPK and upregulates p-AMPK.28 ACC acts downstream of AMPK and is thought to control lipid synthesis. AMPK activation causes ACC phosphorylation and ACC inactivation, after which p-ACC levels increase and ACC levels decrease, thereby inhibiting lipid synthesis.29 Thus, sequential inflammation and oxidative stress caused by lipid toxicity are inhibited, delaying or preventing the progression of DN. Empagliflozin, a new SGLT2i drug, has been shown in many studies to reduce body weight, improve fat distribution, promote lipophagy, and improve islet resistance in patients with type 2 diabetes.30,31 Therefore, the mechanism of action of the SGLT2i empagliflozin in DN has been suggested to be related to the AdipoR1/p-AMPK/p-ACC pathway.
The results of our in vitro and in vivo experiments comparing diabetic mice and HK-2 cells under high-glucose conditions with and without empagliflozin treatment showed that, with empagliflozin treatment, the AdipoR1 protein levels and p-AMPK/AMPK and p-ACC/ACC ratios increased. These trends were also observed by pathological analysis. Within empagliflozin-treated diabetic mice, oil red O staining showed that lipid expression was reduced, Masson’s trichrome and PAS staining showed reduced visible fibrosis, and the lipid droplet activity was decreased. IHC assays showed that AdipoR1 and p-ACC levels followed the observed trend in protein expression. Additionally, in the diabetic group treated with empagliflozin plus compound C, p-AMPK and p-ACC were decreased, accompanied by aggravated fibrosis and increased lipid deposition. The above results suggest that empagliflozin may mechanistically improve DN through the AdipoR1/p-AMPK/p-ACC pathway.
Other studies have shown that AMPK and ACC are involved in lipid metabolism in the intestinal tissue under a high-fat diet or with fatty liver, adipose tissue, and skeletal muscle during endurance training. Exploration of the upstream mechanism suggested the possible participation of Sirt3, a protease in the mitochondrial matrix important for acetylation, in the regulation of fatty acid oxidation in this pathway.32 The downstream mechanism has been studied and is related to CPT1, a carnitine palmitoyl transferase that transports fatty acids.33 Lipid toxicity produces reactive oxygen species (ROS), which induce inflammatory mediators and damage renal tubular epithelial cells, through monocytes.34 Additionally, the accumulation of fatty acids in cells leads to ER stress, which leads to apoptosis.35 Lipids themselves act as inflammatory mediators that induce an inflammatory response, chemokines and adhesion molecules such as monocyte chemoattractant protein-1 (MCP-1) and E-cadherin, amplifying the inflammatory response. These inflammatory factors also cause kidney damage through vascular calcification.36 When empagliflozin reduces lipid toxicity through the AdipoR1/p-AMPK/p-ACC pathway, renal damage caused by diabetes will be eventually stopped. Empagliflozin may improve DN beyond the pathway reported in this study, and further studies are needed to describe the mechanism in detail. AMPK acts as a cell energy state receptor in eukaryotic cells and plays an important role in type 2 diabetes and metabolic syndrome.37 Our experimental results are consistent with the findings of several studies, confirming that AMPK activation promotes p-ACC and inhibit ACC, thus inhibiting lipid metabolism. However, whether AMPK has a direct or indirect effect on P-ACC or whether there is a feedback regulation remains unclear. We hypothesize that mTOR (target protein of rapamycin) may be involved. Our study revealed that AMPK inhibits PLD (phospholipase) and, thus, inhibits PA (phosphatidic acid) production, making mTOR more likely to bind to low-dose rapamycin than to PA to activate Akt and induce apoptosis.38,39 Additionally, AMPK inhibits mTORC1 (rapamycin complex) and 4E-BP1/2 (translation repressors 4E-BP1), thereby inhibiting mRNA transcription and stabilizing cell proliferation.40 The underlying mechanism of cellular regulation remains to be explored, and further studies will provide more insights into the effect of empagliflozin.
In summary, we believe that the pharmacological mechanism of empagliflozin may affect lipid metabolism in diabetic renal tissues through AdipoR1/p-AMPK/p-ACC to alleviate the development of DN.
Clinical Perspectives
Empagliflozin, an SGLTi and a new type of oral glucose-lowering drug, reduces the renal glucose threshold, thus decreasing the ability of renal tubules to reabsorb glucose, removing urine glucose from the body through glomerular filtration and effectively reducing the concentration of glucose in the blood in patients with diabetes. Empagliflozin also affects the metabolism of the whole body, including its protection of the kidney, cardiovascular system, pancreas and other organs. Furthermore, empagliflozin alleviates the progression of DN and decreases serum lipid metabolism by inhibiting ectopic lipid deposition in renal tubular epithelial cells in DN, but the specific mechanism remains unknown.
In DN, significant ectopic lipid deposition occurs in the renal tubules, accompanied by decreased renal function. Through the modeling of DN in mice and high-glucose cultivation of renal tubular epithelial cells, empagliflozin was observed to alleviate lipid deposition in renal tubules and decrease the levels of the lipid indexes fatty acids, serum TGs, and cholesterol in DN in mice under empagliflozin intervention. Additionally, empagliflozin was confirmed to decrease lipid deposition in the renal tubules in DN through the AdipoR1/p-AMPK/p-ACC pathway.
The above results illustrate one of the mechanisms by which empagliflozin alleviates DN, showing the clinical potential of empagliflozin in DN from a new perspective, revealing the scope of empagliflozin and its potential use as a clinical drug, and providing new ideas for the treatment of DN.
Author Contributions
All authors made a significant contribution to the work reported, whether that is in the conception, study design, execution, acquisition of data, analysis and interpretation, or in all these areas; took part in drafting, revising or critically reviewing the article; gave final approval of the version to be published; have agreed on the journal to which the article has been submitted; and agree to be accountable for all aspects of the work.
Funding
This study was supported by the Health Commission of Hubei Province Scientific Research Project (project no. WJ2019M210), Wuhan Science and Technology Bureau (grant no. 2017060201010179), Clinical Research Project for Wu Jieping Medical Foundation (320.6750.19089-58) and Technology and Innovation Seed Fund (znpy20.17044).
Disclosure
The authors declare no conflicts of interest for this work.
References
1. Glassock RJ, Rule AD. The implications of anatomical and functional changes of the aging kidney: with an emphasis on the glomeruli. Kidney Int. 2012;82(3):270–277. doi:10.1038/ki.2012.65
2. Hosokawa K, Takata T, Sugihara T, et al. Ipragliflozin ameliorates endoplasmic reticulum stress and apoptosis through preventing ectopic lipid deposition in renal tubules. Int J Mol Sci. 2020;21(1):190. doi:10.3390/ijms21010190
3. Guebre-Egziabher F, Alix PM, Koppe L, et al. Ectopic lipid accumulation: a potential cause for metabolic disturbances and a contributor to the alteration of kidney function. Biochimie. 2013;95(11):1971–1979. doi:10.1016/j.biochi.2013.07.017
4. Ni L, Yuan C, Chen G, Zhang C, Wu X. SGLT2i: beyond the glucose-lowering effect. Cardiovasc Diabetol. 2020;19(1). doi:10.1186/s12933-020-01071-y
5. Wilcox CS. Antihypertensive and renal mechanisms of SGLT2 (sodium-glucose linked transporter 2) inhibitors. Hypertension. 2020;75(4):894–901. doi:10.1161/HYPERTENSIONAHA.119.11684
6. Kashihara N, Kidokoro K, Kanda E. Renoprotective effects of sodium-glucose cotransporter-2 inhibitors and underlying mechanisms. Curr Opin Nephrol Hypertens. 2020;29(1):112–118. doi:10.1097/MNH.0000000000000561
7. Chen H, Zhang L, Li X, et al. Adiponectin activates the AMPK signaling pathway to regulate lipid metabolism in bovine hepatocytes. J Steroid Biochem Mol Biol. 2013;138:445–454. doi:10.1016/j.jsbmb.2013.08.013
8. Li Z, Lan D, Zhang H, Zhang H, Chen X, Sun J. Electroacupuncture mitigates skeletal muscular lipid metabolism disorder related to high-fat-diet induced insulin resistance through the AMPK/ACC signaling pathway. Evid Based Complement Alternat Med. 2018;2018:1–8.
9. Choi SR, Lim JH, Kim MY, et al. Adiponectin receptor agonist AdipoRon decreased ceramide, and lipotoxicity, and ameliorated diabetic nephropathy. Metabolism. 2018;85:348–360. doi:10.1016/j.metabol.2018.02.004
10. Zhang C, Deng J, Liu D, et al. Nuciferine ameliorates hepatic steatosis in high-fat diet/streptozocin-induced diabetic mice through a PPARα/PPARγ coactivator-1α pathway. Br J Pharmacol. 2018;175(22):4218–4228. doi:10.1111/bph.14482
11. Lu Y, Chang Y, Li T, et al. Empagliflozin attenuates hyperuricemia by upregulation of ABCG2 via AMPK/AKT/CREB signaling pathway in type 2 diabetic mice. Int J Biol Sci. 2020;16(3):529–542. doi:10.7150/ijbs.33007
12. Lee W, Chau Y, Ng H, et al. Empagliflozin protects HK-2 cells from high glucose-mediated injuries via a mitochondrial mechanism. Cells. 2019;8(9):1085. doi:10.3390/cells8091085
13. Yang W, Luo Y, Yang S, et al. Ectopic lipid accumulation: potential role in tubular injury and inflammation in diabetic kidney disease. Clin Sci. 2018;132(22):2407–2422. doi:10.1042/CS20180702
14. Han Q, Zhu H, Chen X, Liu Z. Non-genetic mechanisms of diabetic nephropathy. Front Med. 2017;11(3):319–332. doi:10.1007/s11684-017-0569-9
15. Leung WK, Gao L, Siu PM, Lai CW. Diabetic nephropathy and endothelial dysfunction: current and future therapies, and emerging of vascular imaging for preclinical renal-kinetic study. Life Sci. 2016;166:121–130. doi:10.1016/j.lfs.2016.10.015
16. Benetti E, Mastrocola R, Vitarelli G, et al. Empagliflozin protects against diet-induced NLRP-3 inflammasome activation and lipid accumulation. J Pharmacol Exp Ther. 2016;359(1):45–53. doi:10.1124/jpet.116.235069
17. Makrecka-Kuka M, Korzh S, Videja M, et al. Empagliflozin protects cardiac mitochondrial fatty acid metabolism in a mouse model of diet-induced lipid overload. Cardiovasc Drugs Ther. 2020;34(6):791–797. doi:10.1007/s10557-020-06989-9
18. Xu L, Nagata N, Chen G, et al. Empagliflozin reverses obesity and insulin resistance through fat browning and alternative macrophage activation in mice fed a high-fat diet. BMJ Open Diabetes Res Care. 2019;7(1):e000783. doi:10.1136/bmjdrc-2019-000783
19. Nishimura R, Tanaka Y, Koiwai K, et al. Effect of empagliflozin on free fatty acids and ketone bodies in Japanese patients with type 2 diabetes mellitus: a randomized controlled trial. Adv Ther. 2019;36(10):2769–2782. doi:10.1007/s12325-019-01045-x
20. Hierro-Bujalance C, Infante-Garcia C, Del Marco A, et al. Empagliflozin reduces vascular damage and cognitive impairment in a mixed murine model of Alzheimer’s disease and type 2 diabetes. Alzheimer’s Res Ther. 2020;12(1).
21. Masuda D, Yamashita S. Postprandial glucose and triglyceride increases along with the endothelial malfunction were attenuated by the administration of SGLT2 inhibitor, empagliflozin. J Atheroscler Thromb. 2020;27(7):637–638. doi:10.5551/jat.ED124
22. Park S, Farooq MA, Gaertner S, et al. Empagliflozin improved systolic blood pressure, endothelial dysfunction and heart remodeling in the metabolic syndrome ZSF1 rat. Cardiovasc Diabetol. 2020;19(1). doi:10.1186/s12933-020-00997-7.
23. Madonna R, Doria V, Minnucci I, Pucci A, Pierdomenico DS, De Caterina R. Empagliflozin reduces the senescence of cardiac stromal cells and improves cardiac function in a murine model of diabetes. J Cell Mol Med. 2020;24(21):12331–12340. doi:10.1111/jcmm.15699
24. Neeland IJ, McGuire DK, Chilton R, et al. Empagliflozin reduces body weight and indices of adipose distribution in patients with type 2 diabetes mellitus. Diabetes Vasc Dis Res. 2015;13(2):119–126. doi:10.1177/1479164115616901
25. Iwabu M, Yamauchi T, Okada-Iwabu M, et al. Adiponectin and AdipoR1 regulate PGC-1α and mitochondria by Ca2+ and AMPK/SIRT1. Nature. 2010;464(7293):1313–1319. doi:10.1038/nature08991
26. Kim Y, Lim JH, Kim MY, et al. The adiponectin receptor agonist adiporon ameliorates diabetic nephropathy in a model of type 2 diabetes. J Am Soc Nephrol. 2018;29(4):1108–1127. doi:10.1681/ASN.2017060627
27. Zha D, Wu X, Gao P. Adiponectin and its receptors in diabetic kidney disease: molecular mechanisms and clinical potential. Endocrinology. 2017;158(7):2022–2034. doi:10.1210/en.2016-1765
28. Grossini E, Farruggio S, Qoqaiche F, et al. Monomeric adiponectin modulates nitric oxide release and calcium movements in porcine aortic endothelial cells in normal/high glucose conditions. Life Sci. 2016;161:1–9. doi:10.1016/j.lfs.2016.07.010
29. Dahlhoff C, Worsch S, Sailer M, et al. Methyl-donor supplementation in obese mice prevents the progression of NAFLD, activates AMPK and decreases acyl-carnitine levels. Mol Metab. 2014;3(5):565–580. doi:10.1016/j.molmet.2014.04.010
30. Hong AR, Koo BK, Kim SW, Yi KH, Moon MK. Efficacy and safety of sodium-glucose cotransporter-2 inhibitors in Korean patients with type 2 diabetes mellitus in real-world clinical practice. Diabetes Metab J. 2019;43(5):590. doi:10.4093/dmj.2018.0134
31. Petito-da-Silva TI, Souza-Mello V, Barbosa-da-Silva S. Empaglifozin mitigates NAFLD in high-fat-fed mice by alleviating insulin resistance, lipogenesis and ER stress. Mol Cell Endocrinol. 2019;498:110539. doi:10.1016/j.mce.2019.110539
32. Zhang Y, Deng Y, Tang K, et al. Berberine ameliorates high-fat diet-induced non-alcoholic fatty liver disease in rats via activation of SIRT3/AMPK/ACC pathway. Curr Med Sci. 2019;39(1):37–43. doi:10.1007/s11596-019-1997-3
33. Yuan E, Duan X, Xiang L, et al. Aged oolong tea reduces high-fat diet-induced fat accumulation and dyslipidemia by regulating the AMPK/ACC signaling pathway. Nutrients. 2018;10(2):187. doi:10.3390/nu10020187
34. Seo E, Kang H, Choi H, Choi W, Jun HS. Reactive oxygen species-induced changes in glucose and lipid metabolism contribute to the accumulation of cholesterol in the liver during aging. Aging Cell. 2019;18(2):e12895. doi:10.1111/acel.12895
35. Wang Y, Xue J, Li Y, Zhou X, Qiao S, Han D. Telmisartan protects against high glucose/high lipid-induced apoptosis and insulin secretion by reducing the oxidative and ER stress. Cell Biochem Funct. 2019;37(3):161–168. doi:10.1002/cbf.3383
36. Carracedo M, Artiach G, Arnardottir H, Back M. The resolution of inflammation through omega-3 fatty acids in atherosclerosis, intimal hyperplasia, and vascular calcification. Semin Immunopathol. 2019;41(6):757–766. doi:10.1007/s00281-019-00767-y
37. Towler MC, Hardie DG. AMP-activated protein kinase in metabolic control and insulin signaling. Circ Res. 2007;100(3):328–341. doi:10.1161/01.RES.0000256090.42690.05
38. Mukhopadhyay S, Chatterjee A, Kogan D, Patel D, Foster DA. 5-Aminoimidazole-4-carboxamide-1-β-4-ribofuranoside (AICAR) enhances the efficacy of rapamycin in human cancer cells. Cell Cycle. 2015;14(20):3331–3339. doi:10.1080/15384101.2015.1087623
39. Mukherjee A, Wu J, Barbour S, Fang X. Lysophosphatidic acid activates lipogenic pathways and de novo lipid synthesis in ovarian cancer cells. J Biol Chem. 2012;287(30):24990–25000. doi:10.1074/jbc.M112.340083
40. Mukhopadhyay S, Saqcena M, Chatterjee A, Garcia A, Frias MA, Foster DA. Reciprocal regulation of AMP-activated protein kinase and phospholipase D. J Biol Chem. 2015;290(11):6986–6993. doi:10.1074/jbc.M114.622571
 © 2021 The Author(s). This work is published and licensed by Dove Medical Press Limited. The
full terms of this license are available at https://www.dovepress.com/terms
and incorporate the Creative Commons Attribution
- Non Commercial (unported, 3.0) License.
By accessing the work you hereby accept the Terms. Non-commercial uses of the work are permitted
without any further permission from Dove Medical Press Limited, provided the work is properly
attributed. For permission for commercial use of this work, please see paragraphs 4.2 and 5 of our Terms.
© 2021 The Author(s). This work is published and licensed by Dove Medical Press Limited. The
full terms of this license are available at https://www.dovepress.com/terms
and incorporate the Creative Commons Attribution
- Non Commercial (unported, 3.0) License.
By accessing the work you hereby accept the Terms. Non-commercial uses of the work are permitted
without any further permission from Dove Medical Press Limited, provided the work is properly
attributed. For permission for commercial use of this work, please see paragraphs 4.2 and 5 of our Terms.