Back to Journals » Clinical Ophthalmology » Volume 16
Emergency Department Presentations of Acute Primary Angle Closure in the United States from 2008 to 2017
Authors Mehta SK, Mir T, Freedman IG, Sheth AH, Sarrafpour S, Liu J ![]() , Teng CC
, Teng CC ![]()
Received 29 March 2022
Accepted for publication 11 July 2022
Published 27 July 2022 Volume 2022:16 Pages 2341—2351
DOI https://doi.org/10.2147/OPTH.S368453
Checked for plagiarism Yes
Review by Single anonymous peer review
Peer reviewer comments 3
Editor who approved publication: Dr Scott Fraser
Sumarth K Mehta, Tahreem Mir, Isaac G Freedman, Amar H Sheth, Soshian Sarrafpour, Ji Liu, Christopher C Teng
Department of Ophthalmology and Visual Science, Yale School of Medicine, New Haven, CT, USA
Correspondence: Sumarth K Mehta, Department of Ophthalmology and Visual Science, Yale School of Medicine, 40 Temple Street, New Haven, CT, 06510, USA, Tel +1 203-785-2020, Email [email protected]
Purpose: Acute primary angle closure (APAC) is an ophthalmologic emergency. Nationwide data on the epidemiology and clinical characteristics of APAC are lacking despite the associated visual morbidity.
Patients and Methods: A retrospective cross-sectional study using the Nationwide Emergency Department Sample (NEDS). The NEDS was queried by ICD-9/10 code for cases of APAC presenting to the United States emergency departments over a ten-year period from 2008 to 2017. All identified cases were included to produce nationally representative estimates. Linear regression and seasonality tests were used to identify trends. Reported outcomes include the incidence, demographics, seasonality, and economic impact of APAC regionally and nationwide.
Results: A total of 23,203 APAC-related ED visits were identified. The mean (SD) and median ages were 58.8 (16.2) and 60 years, respectively. Females (59.4%, p < 0.01), those in the lowest income quartile (6983, 30.1%, p < 0.01), and those in the seventh decade of life (5599, 24.1%) presented more frequently with APAC. The incidence of ED presentations within each age group rose with age and increased significantly over the study period (p < 0.01). The Northeast region had the highest average incidence (0.93 per 100,000 population). Significant seasonal variation was seen regionally and nationally (p < 0.01), with the highest average incidence in December and lowest in April. Median inflation adjusted charge per ED visit was $2496.10, and the total inflation adjusted charges equaled $101.5 million.
Conclusion: The incidence of APAC-related ED visits continues to rise in the United States. High-risk groups include women, individuals of low socioeconomic status, and those between ages 50 and 70. Significant seasonal and regional trends were observed in ED presentations of APAC.
Keywords: glaucoma, incidence, seasonality, demographics, cost
Introduction
Acute primary angle closure (APAC) is an ophthalmic emergency and a major cause of blindness worldwide. Rapid and extreme rise in intraocular pressure (IOP) can result in permanent vision impairment if glaucoma develops, so timely diagnosis and management are important to minimize vision loss. A meta-analysis of global data by Tham et al showed that primary angle-closure glaucoma is most prevalent in Asian populations (1.09% in 2013); however, prevalence in North America (0.26% in 2013) is on the rise, with the same meta-analysis projecting a 12% increase in number of North Americans affected between 2020 and 2040.1 Despite this trend, nationwide data on the epidemiology and clinical characteristics of APAC in the United States are lacking. Most population-based studies have been conducted in Asian populations, which are socio-demographically different than that of the United States.2 There is a need for ophthalmologists and public health researchers to better understand the epidemiology, clinical characteristics, and nationwide economic burden of APAC in the United States.
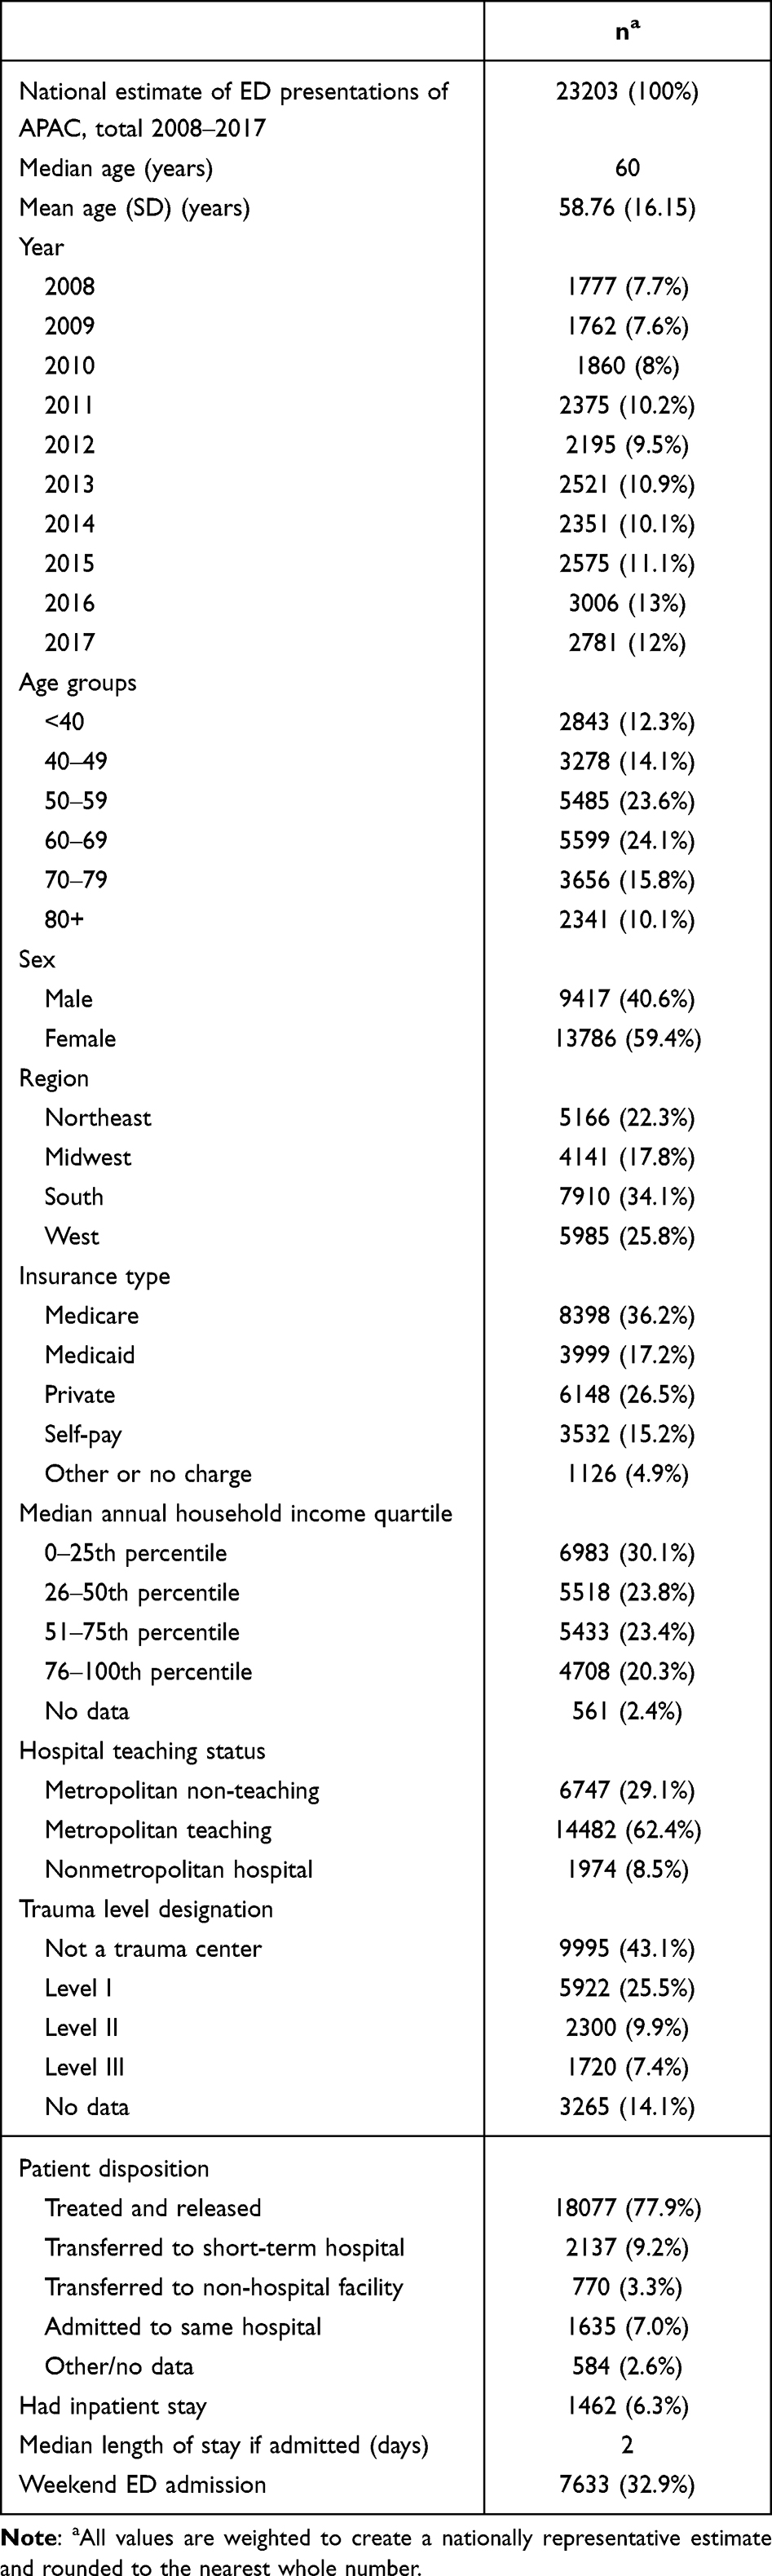 |
Table 1 Demographic and Baseline Characteristics |
The purpose of our study was to fill this gap in knowledge. As symptomatic individuals with APAC are likely to present to the emergency department (ED), we used the Nationwide Emergency Department Sample (NEDS) as a national surveillance system for APAC to generate population-level characteristics. This approach has been previously used to report epidemiological trends for ophthalmologic diagnoses, including for conjunctivitis, open-globe injuries, and ocular burns.3–5 Using NEDS, we investigated 1) national and regional trends in the incidence of APAC-related ED visits in the United States, 2) demographic factors of patients presenting with APAC, 3) seasonal variation in presentation, and 4) the economic burden associated with APAC-related ED visits.
Materials and Methods
Data Source and Population
The Nationwide Emergency Department Sample (NEDS) is the largest all-payer emergency department database in the United States and is part of the Healthcare Cost and Utilization Project (HCUP). The database aggregates records from 984 hospitals in 36 states to produce a 20% stratified sample of all United States EDs, representing approximately 30 million ED visits annually. The sampling strategy provides weights calculated by stratifying hospitals by geographic region, trauma center designation, urban/rural location, teaching status, and ownership and then scaling each stratum to match American Hospital Association (AHA) data; these weights are then used to generate nationally representative estimates.
We queried the NEDS to identify all patients with a primary diagnosis of APAC over a 10-year study period between January 1, 2008, to December 31, 2017. Patients with a primary diagnosis of acute primary angle closure were identified by International Classification of Disease codes (ICD-9365.22 and ICD-10 H40.21, H40.211, H40.212, H40.213, H40.219). Patients with ICD codes indicating intermittent, chronic, and residual angle closure were not included. No explicit patient identifiable information is contained in the database, and our study was prospectively exempted by the Yale Institutional Review Board and was conducted in adherence to the Declaration of Helsinki and all federal and state laws.
Statistical Analysis
In order to report nationally representative estimates, all data points were weighted prior to statistical analysis using methodology specified in the NEDS documentation.6 Descriptive statistics were presented as frequencies (percentages) for categorical variables and means (SDs) for continuous variables. Chi-squared tests were used to identify significant trends in categorical data. National and regional population estimates obtained from the US Census Bureau were used to calculate annual incidence. Linear regression analysis was used to identify trends in incidence. Edwards' test for seasonality was used to test for uniformity of monthly incidences.7 A generalization of Hewitt’s test for seasonality was used to test for 3- and 6-month periods of raised incidence.8 Total annual charges and median charges per encounter were calculated and adjusted for inflation to USD 2020 using the Consumer Price Index from the US Bureau of Labor Statistics.9 Significance was set at α=0.05. Data handling and statistical analyses were performed using Pandas (version 1.03) and SPSS (version 26, IBM, Armonk, New York).
Results
Sociodemographic and Baseline Characteristics
A total of 23,203 APAC-related ED visits were identified over a 10-year study period from 2008 to 2017 (Table 1). The mean age of the study participants was 58.8 ± 16.2 years, and the median age was 60 years. Patients presenting to the ED were most commonly in the seventh decade (age 60–69) of life (5599, 24.1%); however, incidence within each group increased across sequentially older age groups. Incidence was lowest among individuals <40 years of age (0.17 per 100,000 population) and highest in individuals ≥80 years (2.0 per 100,000 population) (Figure 1). Females were more likely to present to the ED with APAC compared to males (59.4% vs 40.6%, p<0.01). By US census region, 34.1% of individuals included were from the South, followed by West (25.8%), Northeast (22.3%), and Midwest (17.8%). Medicare was the primary payer in over a third of presentations (36.2%), followed by private insurance (6.5%), Medicaid (17.2%), and self-pay (15.2%). Patients presenting to the ED with APAC most commonly belonged to the lowest household income quartile (30.1%), and lower-income quartile was associated with increased cases (p<0.01).
 |
Figure 1 Total ED Presentations and Incidences within Age Groups. Caption: The total number of ED presentations declined in the oldest age groups, but incidence continued to increase. |
Sixty-two percent of patients presented to metropolitan teaching hospitals, followed by metropolitan non-teaching hospitals (29.1%), and nonmetropolitan hospitals (8.5%). Most patients were routinely discharged from the ED after treatment (77.9%), while 9.2% were treated and transferred to a short-term care hospital, and 7.0% were admitted to the same hospital. The median length of hospital stay was 2 days. Weekend admissions accounted for 32.9% of cases, which is significantly greater than the expected ratio of 2/7 (28.6%) if presentation was constant across weekdays and weekends (p<0.01).
National and Regional Trends in Incidence
The average annual incidence of APAC-related ED visits in the United States was 0.73 per 100,000 population over the study period. The incidence was the highest in 2016 (0.93 per 100,000 population) and was the lowest in 2009 (0.57 per 100,000 population) (Figure 2). The greatest year-to-year increase in incidence occurred between 2010 and 2011 (0.16 cases per 100,000 population), and the greatest year-to-year decrease in incidence occurred between 2011 and 2012 (0.06 cases per 100,000 population). A linear regression showed a significant increase in the national incidence of APAC-related ED visits between 2008 and 2017 (p<0.01, R2=0.83), with an annual increase of 0.04 cases per 100,000 population per year.
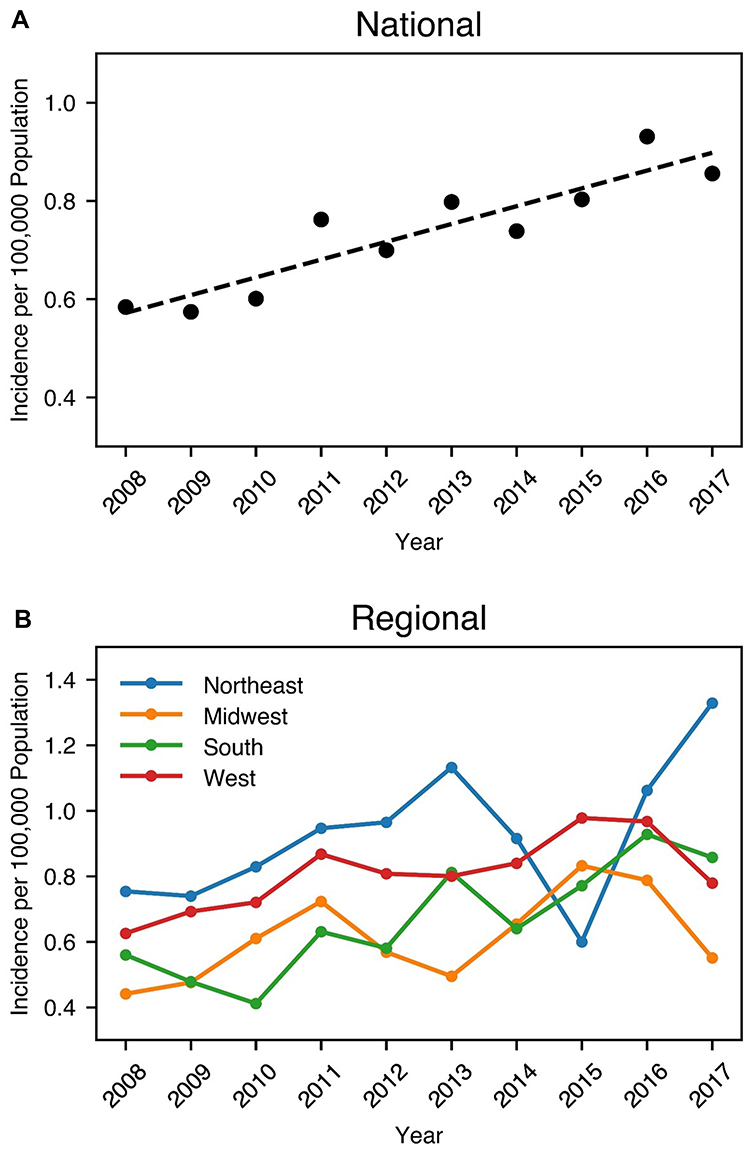 |
Figure 2 (A) National and (B) Regional Annual Incidence of APAC as Primary ED Diagnosis. Caption: The incidence of APAC in the United States increased in the years from 2008 to 2017 (A). The dashed line represents a significant regression analysis (slope = 0.04 cases per 100,000 individuals per year, p<0.01). Additionally, variation in the incidence of APAC was observed across the four geographic regions of the United States (B). |
Variation in incidence was observed across the four geographic regions of the United States. Average incidence across the 10-year period was highest in the Northeast (0.93 per 100,000 population), followed by the West (0.81 per 100,000 population), South (0.67 per 100,000 population), and Midwest (0.61 per 100,000 population). Year-to-year incidence for each region is presented in Figure 2.
Seasonal Variation
Seasonal trends in the incidence of ED presentations of APAC are presented at the national level and by region in Figure 3. The highest average monthly incidence was in December (0.067 per 100,000 population), while the lowest was in April (0.049 per 100,000 population). Analysis using the Edwards test identified significant seasonal variation (p<0.01), and analysis using a generalized Hewitt’s test identified a 6-month period of increased incidence from August to January (observed rank sum 55, maximum possible rank sum 57, p=0.049). Using the Edwards test, seasonal variation was significant in the Northeast, Midwest, and South (all p<0.01), but not in the West (p=0.20).
 |
Figure 3 Seasonal Variation in the National Incidence of APAC as Primary ED Diagnosis. Caption: Significant seasonal variation exists in the national incidence of APAC (p<0.01) at the National level (A) and regional levels (Northeast, South, Midwest, West, (B). The blue bars represent mean monthly incidence over the study period, while the black dots and lines depict year-to-year variation from 2008 to 2017. Seasonal effects vary across geographic regions. |
Resource Utilization
The total inflation adjusted charges associated with APAC-related visits (ED visit and inpatient charges when admitted to the same hospital) were $101.5 million during the study period. Inflation adjusted annual charges were highest in 2016 ($16.6 million) and lowest in 2008 ($6.7 million) (Figure 4). A linear regression model showed a significant trend of increasing annual charges (p<0.01), with an increase of $1.09 million per year. Median charge per encounter was $2496.10 (IQR $1173.30–5271.40) over the study period; it was highest in 2017 ($3076.10, IQR $1443.70–6319.70) and lowest in 2010 ($1823.10, IQR $1031.70–4702.90) (Figure 4).
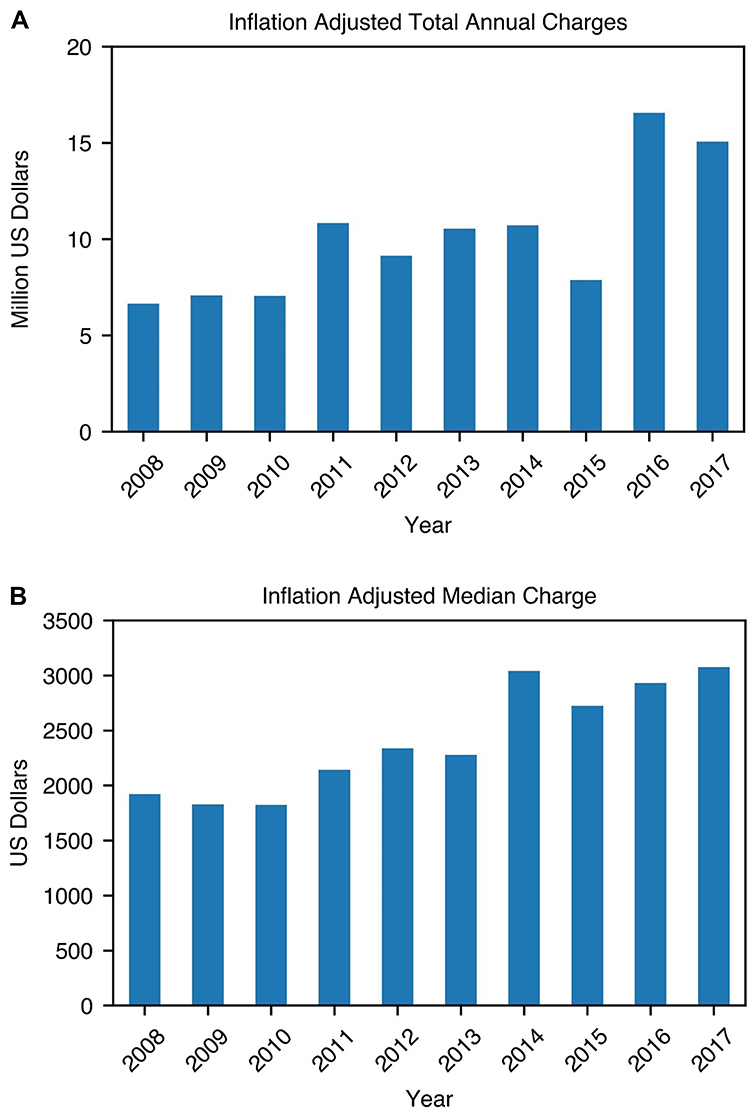 |
Figure 4 Trends in inflation-adjusted total annual charges and median charges per encounter for ED Visits with APAC as primary diagnosis, inflation adjusted total annual charges (A) and inflation adjusted median charge (B). |
Discussion
We present the largest nationwide study on the epidemiology, clinical characteristics, and healthcare utilization related to APAC in the United States. The incidence of APAC-related ED visits increased in the United States during the study period from 2008 to 2017, posing a risk of greater visual morbidity and healthcare costs.
The average age at presentation was 58.8 ± 16.2 years, with a median age of 60 years, with the highest proportion of patients in the sixth and seventh decades of life. This is similar to what has been previously reported in other populations. A 2009 study conducted in Singapore by Tan et al on acute primary angle closure reported a mean presenting age of 59.6 years; 93% of individuals included were of Chinese ethnicity.10 A 2020 study conducted in Southern China by Zhong et al reported a mean presenting age of 64.7 years.11 Sihota and Agarwal conducted a study in India and found that the highest proportion of APAC presentations was in the 50–59-year age range.12 Despite the number of ED presentations peaking in the 60–69-year age group in our study, the incidence within each age group continued to rise at older ages, with an incidence of 2.0 per 100,000 population in individuals ≥80 years. The strong association between advanced age and APAC is thought to be due to the continual expansion of the lens during aging.13
Our analysis found that females in the United States were 1.46 times more likely to present with APAC, confirming the often-reported association between female gender and angle closure.14 Nationwide studies in Korea and Scotland reported females comprising 72.6% and 64% of acute angle closure presentations.15,16 A smaller anterior chamber is a risk factor for APAC, and the higher prevalence of this ocular characteristic in females likely contributes to the higher incidence.17,18 Furthermore, female life expectancy is higher than that of males in the United States and worldwide, and the shift towards a female-predominant population in older age groups may be contributory.19,20
The increasing incidence of APAC seen in this study may be due to shifting demographics in the United States as well as improvements in ED diagnostics and reporting. An aging population likely results in increased incidence of APAC and other age-related diseases; one projection estimates that overall hospital utilization will expand 22% faster than population growth due to aging.21 Another possible demographic contributor is an increasingly diverse US population inclusive of ethnic groups with higher rates of APAC.22 Improvements in diagnostic technology, such as portable and easy-to-use tonometers,23 may allow for accurate measurement of elevated intraocular pressure by the ED providers, leading to a timely diagnosis of APAC, and improved documentation using electronic medical records may contribute to increased reporting of APAC.
Medicare was the primary payer in over a third of presentations, which is expected given the higher incidence of APAC in older individuals. Among adults younger than 65 (who generally do not qualify for Medicare), CDC data show that 69.6% were privately insured in 2017.24,25 Among patients in our cohort who were under 65 years and not utilizing Medicare, only 45% used private insurance, and 55% used Medicaid or self-pay. This suggests that patients under 65 presenting to the ED for APAC have lower private insurance coverage compared to the general population and are more likely to rely on Medicaid or self-pay. One explanation is that patients with private insurance may be more likely to visit an outpatient clinic rather than the ED due to differences in co-pays and deductibles; our study does not capture outpatient clinic presentations of APAC.
The incidence of ED presentations of APAC also decreased as the income quartile increased. Prior studies have demonstrated an association between angle-closure and social variables.26,27 In a Mongolian population, Yip et al27 found that 8 or more years of education was a protective factor, and in a Taiwanese population, Ko et al26 found that low socioeconomic status was a risk factor. One plausible explanation is that individuals of low socioeconomic status have less access to eye care, leading to delayed detection and treatment of predisposing risk factors (ie, anatomically narrow angles treated with laser peripheral iridotomy or cataract surgery). Another explanation is that individuals in higher-income quartiles are more likely to have private insurance and are more likely to present to an outpatient ophthalmologist rather than the ED.
The Northeast region had the highest incidence of ED visits for APAC, followed by the West, South, and Midwest. A portion of this effect may be explained by variations in demographics, as the Northeast and West have a far greater share of ethnically Asian residents compared to the South and Midwest.22 Another possible contributing factor is access to emergency care, as residents of the Northeast are more likely to have an emergency department within 30 minutes compared to residents of other regions.28 However, as associations between daily daylight hours, climate, and APAC have been reported, it is likely that other geographic factors play a role in regional disparities.29,30
Significant seasonal trends were observed in the national and regional incidence of ED visits for APAC. Nationally, a significant period of increased incidence was observed between August and January, with December accounting for the highest single monthly incidence, and April accounting for the lowest monthly incidence. Prior studies have reported significant associations between APAC and days with less sunlight, days with high temperatures, and the summer and winter months.30–32 As APAC is partly associated with pupillary dilation, these seasonal patterns are hypothesized to be due to an increase in time spent in dimmer indoor areas on hot days, and a decrease in sunlight during the winter months.33 Extending that hypothesis to this cohort, the highest incidence in December could be attributed to short daylight hours and increased time spent indoors, and lesser seasonal variation in the West could be attributed to the more temperate climate of the region. Economic and social factors influencing time spent in dim environments may differ across regions and contribute to variations in effect of seasonality across regions. The impact of environmental factors on other physiological mechanisms thought to cause APAC, such as choroidal expansion and iris volume retention, is currently unclear. However, further study of predisposing environmental factors may help identify groups at exceptionally increased risk and inform preventative strategies such as screening or lighting interventions.
Inflation adjusted total charges for APAC-related ED visits and associated hospitalizations averaged $10.2 million annually during the study period. Given that not all cases present to the ED and that procedural management is often performed in the outpatient settings by ophthalmologists, this figure likely underestimates the total charges associated with APAC. However, the trend of increasing charges over the 10-year study period suggests greater healthcare resource utilization associated with APAC presenting to the ED. The year 2014 was associated with a substantial increase in median charges per encounter. As a federal mandate requiring the use of electronic medical records went into effect that year, the rise in charges per encounter may be due to hospital billing departments having improved access to documentation and utilizing automated coding.
The strengths of this study include its large sample size and utilization of the NEDS sampling strategy that allows for national level estimates to be generated. As the database is representative of all ED visits in the United States, it is an ideal database to investigate the incidence of APAC, as these patients often present to the ED. The study has several limitations, most of which are common to studies conducted using large administrative databases. The NEDS lacks data on outpatient ophthalmologic visits, patient follow-up, and repeat ED visits, and thus, this information was not included in this study. Race or ethnicity data are not available in NEDS, and location data is limited to US census region; therefore, further study is needed to characterize the contribution of shifting racial demographics towards trends in APAC presentations. This study only captures patients who presented to the ED with APAC. Because coding was reliant primarily on ED providers who may not be trained in identifying and managing the full range of ophthalmologic diagnoses, limited data were available on ophthalmologic comorbidities and procedures.
Conclusion
ED presentations of APAC in the United States are on the rise. Gender and socioeconomic disparities exist, disproportionately affecting women, individuals in their 50s-70s, and individuals of low socioeconomic status. Preventive strategies should be targeted towards these high-risk groups. Ophthalmologists should also be aware of the significant regional and seasonal trends in the presentation of APAC in the United States.
Acknowledgments
The author Isaac G Freedman, MPH, has formal biostatistics training including a certificate in outcomes research.
Funding
Funding/support was provided by the Jean and David W. Wallace Family Foundation. This sponsor had no involvement in the study.
Disclosure
All authors report no conflicts of interest in this work.
References
1. Tham Y-C, Li X, Wong TY, Quigley HA, Aung T, Cheng C-Y. Global prevalence of glaucoma and projections of glaucoma burden through 2040: a systematic review and meta-analysis. Ophthalmology. 2014;121(11):2081–2090. doi:10.1016/j.ophtha.2014.05.013
2. Cheng J-W, Zong Y, Zeng -Y-Y, Wei R-L. The prevalence of primary angle closure glaucoma in adult asians: a systematic review and meta-analysis. PLoS One. 2014;9(7):e103222. doi:10.1371/journal.pone.0103222
3. Haring RS, Sheffield ID, Channa R, Canner JK, Schneider EB. Epidemiologic trends of chemical ocular burns in the United States. JAMA Ophthalmol. 2016;134(10):1119–1124. doi:10.1001/jamaophthalmol.2016.2645
4. Ramirez DA, Porco TC, Lietman TM, Keenan JD. Epidemiology of conjunctivitis in US emergency departments. JAMA Ophthalmol. 2017;135(10):1119–1121. doi:10.1001/jamaophthalmol.2017.3319
5. Mir TA, Canner JK, Zafar S, Srikumaran D, Friedman DS, Woreta FA. Characteristics of open globe injuries in the United States from 2006 to 2014. JAMA Ophthalmol. 2020;138(3):268–275. doi:10.1001/jamaophthalmol.2019.5823
6. Producing National HCUP Estimates. Agency for healthcare research and quality; 2018. Available from: https://hcup-us.ahrq.gov/tech_assist/nationalestimates/508_course/508course_2018.jsp.
7. Edwards JH. The recognition and estimation of cyclic trends. Ann Hum Genet. 1961;25(1):83–87. doi:10.1111/j.1469-1809.1961.tb01501.x
8. Rogerson PA. A generalization of Hewitt’s test for seasonality. Int J Epidemiol. 1996;25(3):644–648. doi:10.1093/ije/25.3.644
9. CPI for All Urban Consumers (CPI-U). U.S. bureau of labor statistics; 2020. Available from: https://data.bls.gov/timeseries/CUUR0000SA0.
10. Tan AM, Loon SC, Chew PTK. Outcomes following acute primary angle closure in an Asian population. Clin Experiment Ophthalmol. 2009;37(5):467–472. doi:10.1111/j.1442-9071.2009.02060.x
11. Zhong X, Li Y, Huang C, et al. Seasonal variations and climatic factors on acute primary angle-closure admission in southern China: a 5-year hospital-based retrospective study. Acta Ophthalmol. 2020;99(5):e761–e768. doi:10.1111/aos.14649
12. Sihota R, Agarwal HC. Profile of the subtypes of angle closure glaucoma in a tertiary hospital in north India. Indian J Ophthalmol. 1998;46(1):25–29.
13. Richdale K, Bullimore MA, Zadnik K. Lens thickness with age and accommodation by optical coherence tomography. Ophthalmic Physiol Opt. 2008;28(5):441–447. doi:10.1111/j.1475-1313.2008.00594.x
14. Ahram DF, Alward WL, Kuehn MH. The genetic mechanisms of primary angle closure glaucoma. Eye. 2015;29(10):1251–1259. doi:10.1038/eye.2015.124
15. Chua PY, Day AC, Lai KL, et al. The incidence of acute angle closure in Scotland: a prospective surveillance study. Br J Ophthalmol. 2018;102(4):539–543. doi:10.1136/bjophthalmol-2017-310725
16. Park SJ, Park KH, Kim TW, Park BJ. Nationwide incidence of acute angle closure glaucoma in Korea from 2011 to 2015. J Korean Med Sci. 2019;34(48):e306–e306. doi:10.3346/jkms.2019.34.e306
17. Fontana ST, Brubaker RF. Volume and depth of the anterior chamber in the normal aging human eye. Arch Ophthalmol. 1980;98(10):1803–1808. doi:10.1001/archopht.1980.01020040655013
18. Xu L, Cao WF, Wang YX, Chen CX, Jonas JB. Anterior chamber depth and chamber angle and their associations with ocular and general parameters: the Beijing eye study. Am J Ophthalmol. 2008;145(5):929–936.e921. doi:10.1016/j.ajo.2008.01.004
19. Ortman JM, Velkoff VA, Hogan H. An Aging Nation: The Older Population in the United States. USA: United States Census Bureau, Economics and Statistics Administration; 2014.
20. Teriokhin AT, Budilova EV, Thomas F, Guegan J. Worldwide variation in life-span sexual dimorphism and sex-specific environmental mortality rates. Hum Biol. 2004;76(4):623–641. doi:10.1353/hub.2004.0061
21. Pallin DJ, Espinola JA, Camargo CA Jr. US population aging and demand for inpatient services. J Hosp Med. 2014;9(3):193–196. doi:10.1002/jhm.2145
22. Elizabeth M, Hoeffel SR, Kim MO, Shahid H. The Asian Population: 2010. U.S: Department of Commerce, Economics and Statistics Administration; 2012.
23. Abraham LM, Epasinghe NCR, Selva D, Casson R. Comparison of the ICare® rebound tonometer with the Goldmann applanation tonometer by experienced and inexperienced tonometrists. Eye. 2008;22(4):503–506. doi:10.1038/sj.eye.6702669
24. Cohen RA, Martinez ME. Health Insurance Coverage: Early Release of Estimates from the National Health Interview Survey, 2008. Division of Health Interview Statistics, National Center for Health Statistics; 2009.
25. Cohen RA, Martinez ME, Zammitti EP. Health Insurance Coverage: Early Release of Estimates from the National Health Interview Survey, 2017. Division of Health Interview Statistics, National Center for Health Statistics; 2017.
26. Ko Y-C, Hwang D-K, Chen W-T, Lee C-C, Liu CJ, Gonzalez P. Impact of socioeconomic status on the diagnosis of primary open-angle glaucoma and primary angle closure glaucoma: a nationwide population-based study in Taiwan. PLoS One. 2016;11(2):e0149698. doi:10.1371/journal.pone.0149698
27. Yip JLY, Nolan WP, Davaatseren U, et al. Primary angle closure glaucoma in east asia: educational attainment as a protective factor. Ophthalmic Epidemiol. 2011;18(5):217–225. doi:10.3109/09286586.2011.602507
28. Carr BG, Branas CC, Metlay JP, Sullivan AF, Camargo CA
29. Hu -C-C, Lin H-C, Chen C-S. A 7-year population study of primary angle closure glaucoma admissions and climate in Taiwan. Ophthalmic Epidemiol. 2008;15(1):66–72. doi:10.1080/09286580701771997
30. Seah SKL, Foster PJ, Chew PTK, et al. Incidence of acute primary angle-closure glaucoma in Singapore: an island-wide survey. Arch Ophthalmol. 1997;115(11):1436–1440. doi:10.1001/archopht.1997.01100160606014
31. Bojić L, Vojniković B, Karelović D, Jukić-Lesina T. Acute angle-closure glaucoma and meteorological factors in Split, Croatia. Coll Antropol. 2001;25 Suppl:105–109.
32. David R, Tessler Z, Yassur Y. Epidemiology of acute angle-closure glaucoma: incidence and seasonal variations. Ophthalmologica. 1985;191(1):4–7. doi:10.1159/000309530
33. Subak-Sharpe I, Low S, Nolan W, Foster PJ. Pharmacological and environmental factors in primary angle-closure glaucoma. Br Med Bull. 2010;93(1):125–143. doi:10.1093/bmb/ldp042
 © 2022 The Author(s). This work is published and licensed by Dove Medical Press Limited. The
full terms of this license are available at https://www.dovepress.com/terms
and incorporate the Creative Commons Attribution
- Non Commercial (unported, 3.0) License.
By accessing the work you hereby accept the Terms. Non-commercial uses of the work are permitted
without any further permission from Dove Medical Press Limited, provided the work is properly
attributed. For permission for commercial use of this work, please see paragraphs 4.2 and 5 of our Terms.
© 2022 The Author(s). This work is published and licensed by Dove Medical Press Limited. The
full terms of this license are available at https://www.dovepress.com/terms
and incorporate the Creative Commons Attribution
- Non Commercial (unported, 3.0) License.
By accessing the work you hereby accept the Terms. Non-commercial uses of the work are permitted
without any further permission from Dove Medical Press Limited, provided the work is properly
attributed. For permission for commercial use of this work, please see paragraphs 4.2 and 5 of our Terms.