
Back to Journals » International Journal of Chronic Obstructive Pulmonary Disease » Volume 20
Elucidating the Relationship Between Body Fat Index and Pulmonary Health: Insights from Cross-Sectional Analysis and Mendelian Randomization
Authors Zhang Q  , Wang Z, Liu W, Cai G, Gao Y, Chen Y, Han Y, Nie A, Liang R, Cui F, Chen Y
Received 16 September 2024
Accepted for publication 23 February 2025
Published 31 March 2025 Volume 2025:20 Pages 869—882
DOI https://doi.org/10.2147/COPD.S488523
Checked for plagiarism Yes
Review by Single anonymous peer review
Peer reviewer comments 2
Editor who approved publication: Prof. Dr. Richard Russell
Qing Zhang,1,* Zihui Wang,1,* Weijuan Liu,1,* Guannan Cai,2,* Yuan Gao,2 Yilin Chen,1 Yuan Han,3 Anliu Nie,1 Ruan Liang,1 Fei Cui,1 Ying Chen1
1Guangzhou Institute of Respiratory Health, the First Affiliated Hospital of Guangzhou Medical University, Guangzhou, Guangdong, People’s Republic of China; 2Guangzhou Medical University, Guangzhou, Guangdong, People’s Republic of China; 3School of Nursing, Guangzhou Medical university, Guangzhou, Guangdong, People’s Republic of China
*These authors contributed equally to this work
Correspondence: Ying Chen, Guangzhou Institute of Respiratory Health, the First Affiliated Hospital of Guangzhou Medical University, No. 28 Qiaozhong Zhong Road, Guangzhou, Guangdong, 510000, People’s Republic of China, Email [email protected] Fei Cui, Guangzhou Institute of Respiratory Health, the First Affiliated Hospital of Guangzhou Medical University, No. 28 Qiaozhong Zhong Road, Guangzhou, Guangdong, 510000, People’s Republic of China, Email [email protected]
Objective: To evaluate the relationship between body fat index and pulmonary health.
Methods: In the multiethnic population-based cross-sectional study, a multivariable linear regression model was adapted to assess the association of fat mass/percentage with forced expiratory volume in 1 second (FEV1)/forced vital capacity (FVC). The Mendelian Randomization (MR) method was used to assess the causal associations of fat mass/percentage in specific body parts with FEV1 and COPD risk. Sensitivity analysis of MR was performed to assess the robustness of estimates.
Results: In the cross-sectional analysis, a non-linear relationship was observed between fat mass and FEV1 without adjustment. After multivariate adjustment, the negative associations of fat mass/percentage with FEV1/FVC were found. In the MR study, genetically determined fat presented a negative causal effect on FEV1 (e.g., estimate = − 0.170, P < 0.001 for left leg fat mass). The causal associations of genetically determined body fat with clinical diagnosis COPD were also determined (e.g., OR = 1.936, P < 0.001 per 1.9 kilograms increase in left leg fat mass).
Conclusion: We present strong evidence on the causal relationship between body fat mass/percentage and both the deterioration of lung function and the increased risk of COPD. Additional efforts are required to mitigate the negative effects of body fat.
Keywords: fat, lung function, chronic obstructive pulmonary disease, cross-section, Mendelian randomization
Introduction
Chronic obstructive pulmonary disease (COPD) is a long-term lung condition marked by consistent limitations in airflow and enduring respiratory symptoms. According to the Global Burden of Disease Study 2021, COPD is the third leading cause of mortality and the sixth leading cause of years of life lost (YLL) or disability-adjusted life years (DALYs).1 In addition, COPD is the most common cause of death and YLL attributable to chronic respiratory disease.1 Given the widespread occurrence and impact of COPD, it is crucial to engage in proactive management for those with COPD to alleviate the healthcare strain. Various approaches, such as smoking cessation and inhaled bronchodilators, are applied to manage COPD patients to protect lung function.2,3 However, several problems, such as the low success rate of smoking cessation and the deterioration of the disease under active treatments, plague the management of COPD patients. Hence, pinpointing risk elements associated with COPD and creating innovative intervention strategies are imperative to protect and enhance pulmonary function.
According to the World Health Organization, the global prevalence of obesity almost doubled from 1980 to 2008.4 Overweight and obesity are the fifth leading cause of death worldwide.5 Given the dramatic increase in disease prevalence of obesity, more and more researchers focus on the relationship between obesity and lung health. Several cross-sectional and cohort studies have observed the association of body fat mass/percentage with impaired lung function.6–12 However, several limitations still exist. First, given the unavoidable presence of potential confounding factors in observational studies, it’s impossible to establish a definitive causal link between body fat and the deterioration of lung function. Second, since it takes a long time to observe the emergence of COPD in the cohort study, there is no evidence to confirm whether fat can lead to COPD. Third, previous observational studies mostly adopted linear models that are not able to explore the potential non-linear exposure–response relationship. Lastly, the effect of body fat on lung function and COPD may vary across body parts (e.g., leg, arm, and trunk), but it has not been compared in previous studies.
Previous studies have suggested that body fat may be an important factor contributing to the decline in lung function. For instance, inflammatory factors secreted by adipose tissue may damage lung tissue and increase airway resistance. Increases in fat have been associated with changes in T cell and cytokine levels in COPD patients, potentially promoting the progression of COPD. However, there is currently no direct evidence to support this causal relationship.
In view of the existing problems, this study uses two methodologies to provide solid evidences. Population-based cross-section study was used to assess the associations of fat mass/percentage of various body parts with pre-bronchodilator forced expiratory volume in 1 second (FEV1) and post-bronchodilator FEV1/forced vital capacity (FVC). The Mendelian randomization (MR) study was conducted to determine the causal associations of fat mass/percentage with pre-bronchodilator FEV1 and clinical diagnosis COPD (post-bronchodilator FEV1/FVC < 0.7 after smoking exposure).13
Methods
Data Sources and Preparation for Epidemiological Observation
National Health and Nutrition Examination Survey (NHANES) is a cross-sectional survey carried out by the National Center for Health Statistics (NCHS) using multistage stratified random sampling, which could represent the entire US population (www.cdc.gov/nchs/nhanes/index.htm). The whole-body dual-energy x-ray absorptiometry (DXA) data were collected starting in 2011 to examine the body composition (including the fat mass/percentage of the arm, leg, trunk, and whole body). All individuals 8–59 years were eligible for the whole body DXA scan, with the exception of pregnant females. Spirometry is a widely used test that assesses the amount and speed of air in the inhale and exhale cycle and can be used to aid in the diagnosis of respiratory disorders. All participants aged 6–79 were eligible to access the spirometry component. The subset of participants whose FEV1/FVC < LLN (lower limits of normal) would receive repeated spirometry following the administration of a bronchodilator. Participants with valid whole-body DXA data, body measurements (weight and standing height), and pre-bronchodilator spirometry (n = 4127) were enrolled in the primary observational analysis (Figure 1). The report of cross-sectional analysis followed the Strengthening the Reporting of Observational Studies in Epidemiology (STROBE) reporting guideline.
 |
Figure 1 Flow chart of selecting eligible participants in the NHANES 2011–2012. Abbreviation: NHANES 2011–2012, National Health and Nutrition Examination Survey in 2011–2012. |
Statistical Analysis in the Epidemiological Observation Study
Demographic and clinical characteristics of the study population from NHANES were presented by mean ± standard deviation or count (percentage) according to their data types. Two-sample t-test or Chi-square test was used to detect differences in demographic and clinical characteristics between the overall population and subgroup. The arm/leg fat mass/percentage of participants was the average of corresponding left and right measures. The total fat percentage was determined by dividing the whole-body fat mass by the body weight. The relationship between the fat traits (including fat mass/percentage of arm, leg, trunk, and whole body) and pre-bronchodilator FEV1 or post-bronchodilator FEV1/FVC were evaluated using a multivariable linear regression model with a restricted cubic spline. Age, sex, ethnicity, height, and weight were adjusted as covariates to assess whether the fat measurement is a predictive factor for impaired lung function.
We conducted a post-hoc power analysis using the pwr package to assess the statistical power given the existing sample size. For the univariate regression before diastole (n = 4127, u = 1, f² = 0.1), the power was 1.0, indicating sufficient statistical power. The multivariate regression (u = 5, f² = 0.1) also showed a power of 1.0, supporting the validity of the model. In the case of a smaller sample size after diastole (n = 268), the powers of the univariate and multivariate regression models were 0.999 and 0.989, respectively, both close to 1.0, further confirming the statistical power and adequacy of the sample size in this study. We conducted a post-hoc power analysis to assess the statistical power under the existing sample size. For univariable regression prior to diastole (n = 4127, u = 1, f² = 0.1), the power was 1.0, indicating sufficient statistical capability. Similarly, for multivariable regression (u = 5, f² = 0.1), the power also demonstrated 1.0, supporting the validity of the model. In the case of a smaller sample size after diastole (n = 268), the power of the univariable and multivariable regression models was 0.999 and 0.989, respectively, both close to 1.0, further confirming the statistical power and adequacy of the sample size for the study.
The cross-sectional analysis mentioned above was performed in R (version 4.1, R Development Core Team) with “foreign”, “rms”, “pwr” and “ggplot2” packages.
Data Sources and Preparation for Mendelian Randomization Study
Single nucleotide polymorphisms (SNPs) that were significantly (P value < 5*10−8) associated with the exposure traits (i.e., fat mass/percentage of arm, leg, trunk, and whole body measured by DXA) were obtained from a large meta-analysis of genome-wide association study (GWAS) for fat measures in 454684 people of European descent reported by Ben Elsworth in 2018 (www.bristol.ac.uk/integrative-epidemiology). The clumping strategy was adapted to extract independent SNPs according to linkage disequilibrium (LD): the SNP with the smallest P-value in each 10000 kb window was retained, and all those in LD (r2 > 0.2) with this SNP were removed. Commonly accepted LD scores suitable for Europeans (www.github.com/bulik/ldsc) were adopted.
Two lung function-related phenotypes were assessed: pre-bronchodilator FEV1 and the clinical diagnosis of COPD according to ICD-10, as the former represented the severity of impaired lung function and the latter represented the spirometry-defined airflow limitation after smoking exposure. Summary statistics for pre-bronchodilator FEV1 were obtained from a GWAS meta-analysis of 321047 European individuals from the UK Biobank and SpiroMeta program.14 Summary statistics for COPD were obtained from a recent GWAS conducted in 193638 participants of European ancestry from FinnGen Biobank (www.risteys.finngen.fi/endpoints/J10_COPD).
Summary statistics of selected SNPs mentioned above were extracted from the outcome datasets. If the SNPs were not included in the outcome databases, proxies for the missing SNPs (r2>0.8) were identified from the corresponding databases. Palindromic SNPs were allowed, and the Minor Allele Frequency (MAF) threshold set to infer palindromic SNPs was 0.3. The report of two-sample Mendelian Randomization study also followed the STROBE reporting guideline.
Statistical Analysis in the Mendelian Randomization Study
Two-sample MR analysis was adapted to assess the causal association of fat mass/percentage on impaired lung function. Inverse variance weighted (IVW), MR Egger, and weighted median (WM) methods were used to estimate the causal effect. The random effect IVW model was used to pool the causal estimates of SNPs, and the results of the IVW method were regarded as primary interpretations.
To confirm the reliability of estimates from MR analysis,15 we adapted several validation steps: 1) heterogeneity test was used to assess the variability in the causal estimates among selected SNPs; 2) MR-Egger pleiotropy test was performed to detect potential horizontal pleiotropic and ensure that the causal estimates were not biased by pleiotropic effects; 3) sensitivity analysis with diverse databases on lung function (i.e., FEV1 predicted percentage, and FEV1 best measure) was performed to assess the robustness of the relationship of fat mass/percentage with lung function; 4) evaluate the strength of instrumental variables (F-statistics) to avoid weak instrument bias. We conducted a post-hoc power calculation based on the sample size of the included studies and the expected effect size of fat mass on lung function (Tables S1). The associations between genetically determined fat and COPD in the two-sample Mendelian Randomization were presented by odd ratio (OR).
The MR analysis mentioned above was performed in R (version 4.1, R Development Core Team) with “TwoSampleMR” packages. Statistical significance was determined as a two-side P value <0.05 in this paper.
Results
There were 4127 participants with valid DXA (i.e., arm, leg, trunk, and total body data), body measure (i.e., weight and standing height), and acceptable spirometry results in the NHANES 2011–2012 study finally enrolled into the primary analysis (Figure 1).
Demographic and clinical characteristics of the 4127 participants from NHANES 2011–2012 were presented in Table 1. Detailed information of LD-independent SNPs (after clumping process) for exposure (fat of arm, leg, trunk, whole-body) was listed in Tables S2.A to S2.R. Among the overall study population, 268 participants received post-bronchodilator spirometry. No statistical difference was found between the overall population and the post-bronchodilator spirometry subgroup on the demographic and fat measure data. However, the pre-bronchodilator FEV1 and FEV1/FVC in the post-bronchodilator subgroup were less than the corresponding indexes in the overall population (2682.6mL vs 3066.9mL in pre-bronchodilator FEV1, 0.7 vs 0.8 in pre-bronchodilator FEV1/FVC) (Table 1).
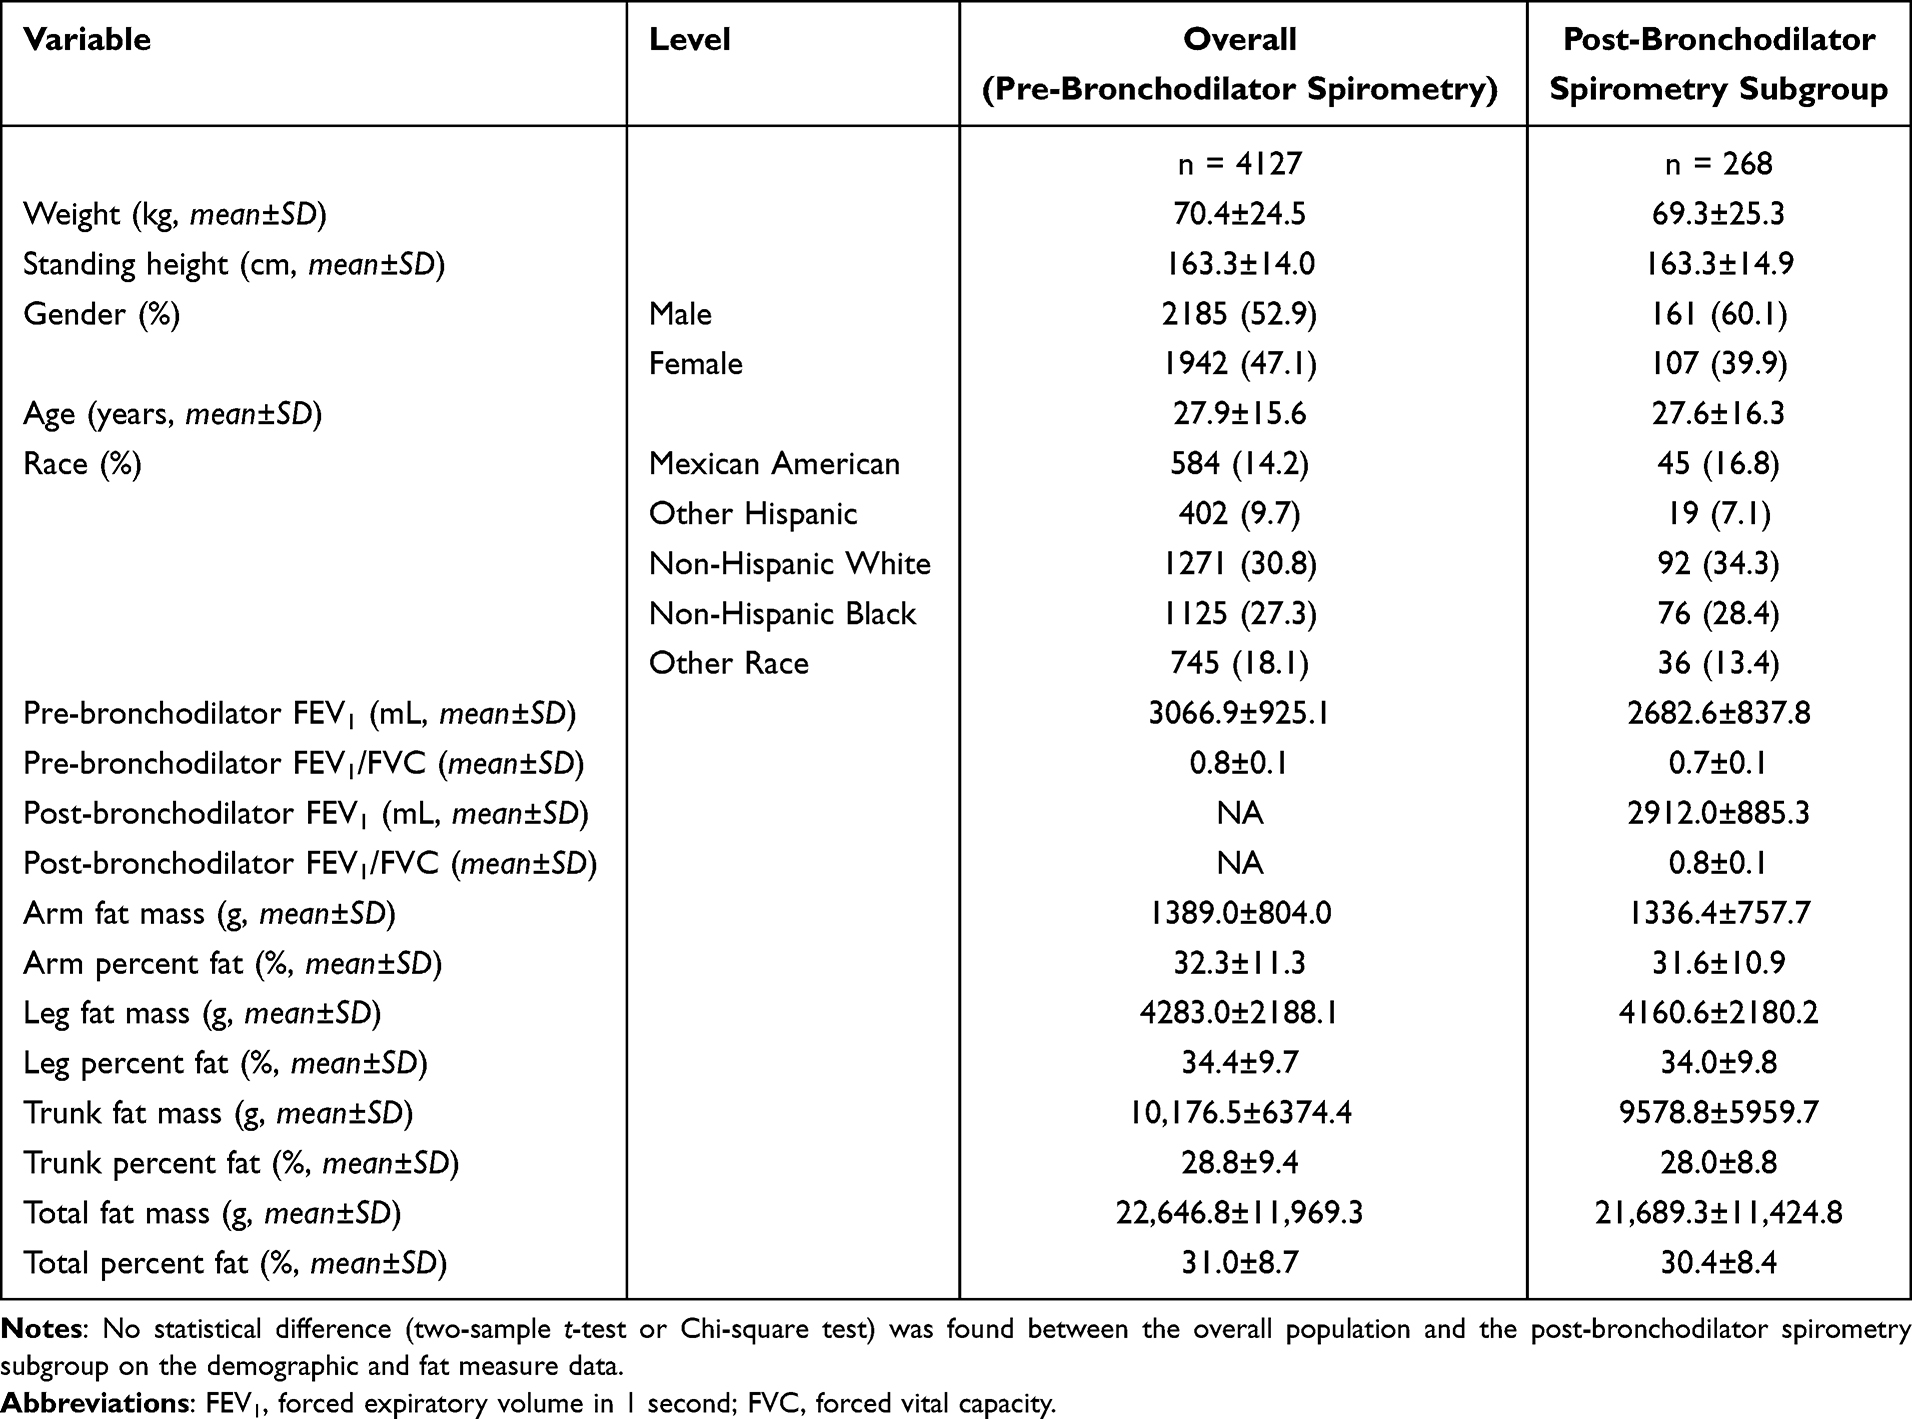 |
Table 1 Demographic and Clinical Characteristics of the Study Population from NHANES 2011–2012 |
Without adjustment, Figure 2A showed the non-linear relationship between fat mass and pre-bronchodilator FEV1. Extreme fat mass (i.e., too high or too low) was associated with lower pre-bronchodilator FEV1, and the median of fat mass was associated with higher pre-bronchodilator FEV1. After multivariate adjustment (i.e., weight, height, age, sex, and ethnicity), Figure 2B showed strong negative associations between fat mass/percentage and pre-bronchodilator FEV1. Negative relationships were also observed between fat mass/percentage and post-bronchodilator FEV1/FVC (Figure 3).
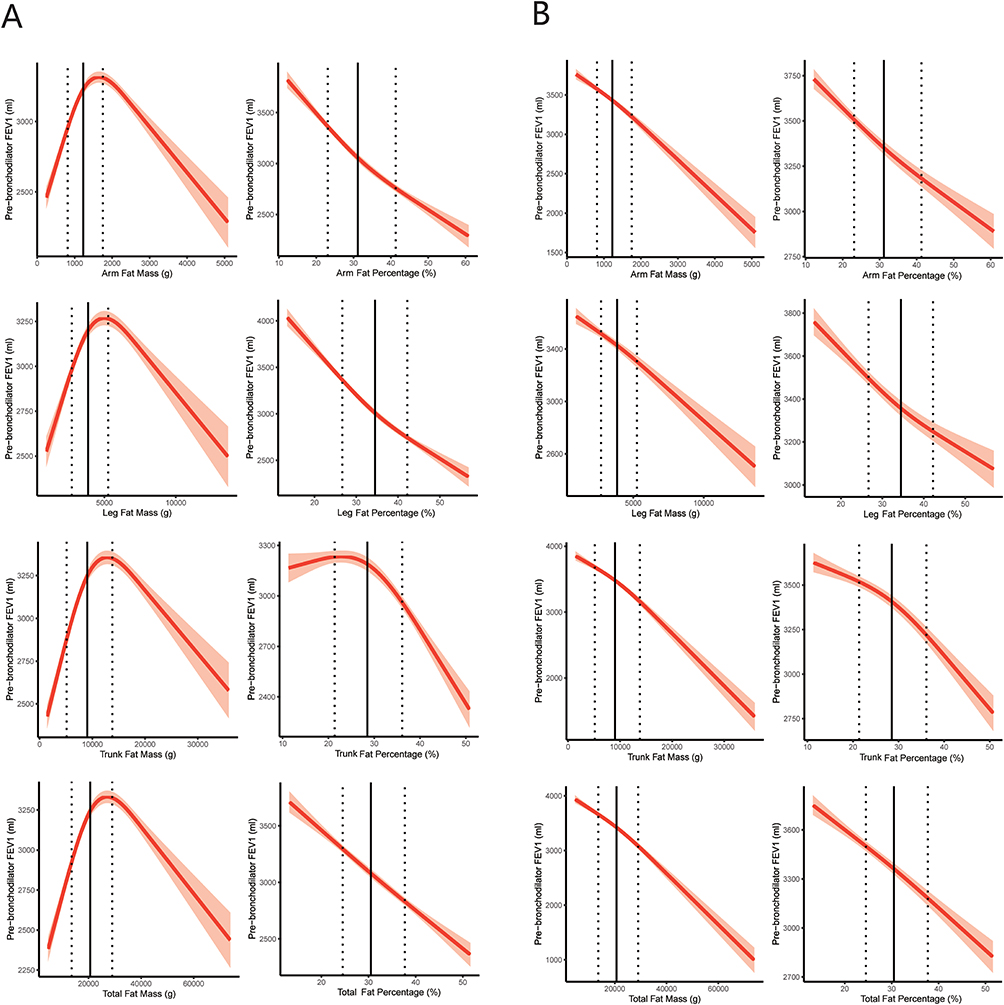 |
Figure 2 Relationship between fat mass/percentage and pre-bronchodilator FEV1 in the cross-sectional study. The relationships were assessed by multivariable linear regression models with restricted cubic spline. (A) Linear regression model without adjustment. (B) Linear regression model adjusted for age, sex, ethnicity, height, and weight. The vertical dashed line on the left is the 25th percentile. The vertical dashed line on the right is the 75th percentile. The vertical solid line is the 50th percentile. Fat mass/percentage was measured by dual-energy x-ray absorptiometry. Pre-bronchodilator FEV1 is a measure of spirometry to determine airflow. Abbreviation: FEV1, forced expiratory volume in 1 second. |
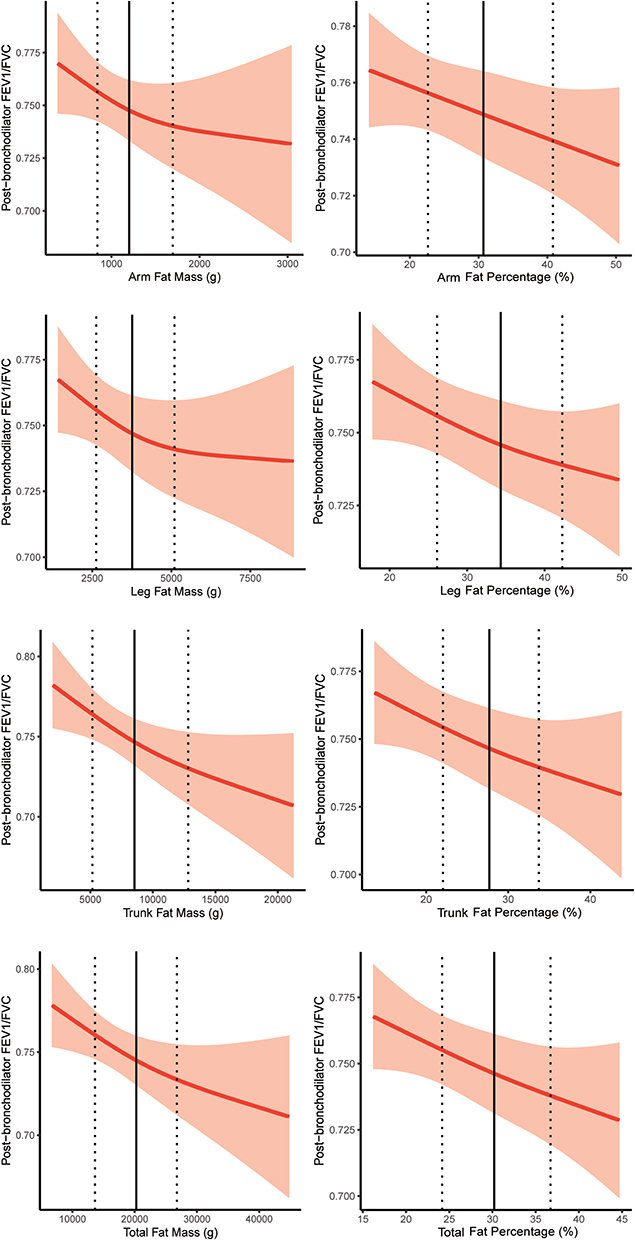 |
Figure 3 Relationship between fat mass/percentage and post-bronchodilator FEV1/FVC in the cross-sectional study. The relationships were assessed by multivariable linear regression models with restricted cubic spline and adjusted for age, sex, ethnicity, height, and weight. The vertical dashed line on the left is the 25th percentile. The vertical dashed line on the right is the 75th percentile. The vertical solid line is the 50th percentile. Fat mass/percentage was measured by dual-energy x-ray absorptiometry. Post-bronchodilator FEV1/FVC is a measure of spirometry to determine persistent airflow limitation. Abbreviations: FEV1, forced expiratory volume in 1 second; FVC, forced vital capacity. |
The causal effect of fat mass/percentage on lung function (i.e., pre-bronchodilator FEV1 and clinical diagnosis COPD according to ICD-10) was determined by a two-sample MR analysis. The details of databases included in the MR analysis are shown in Table 2.
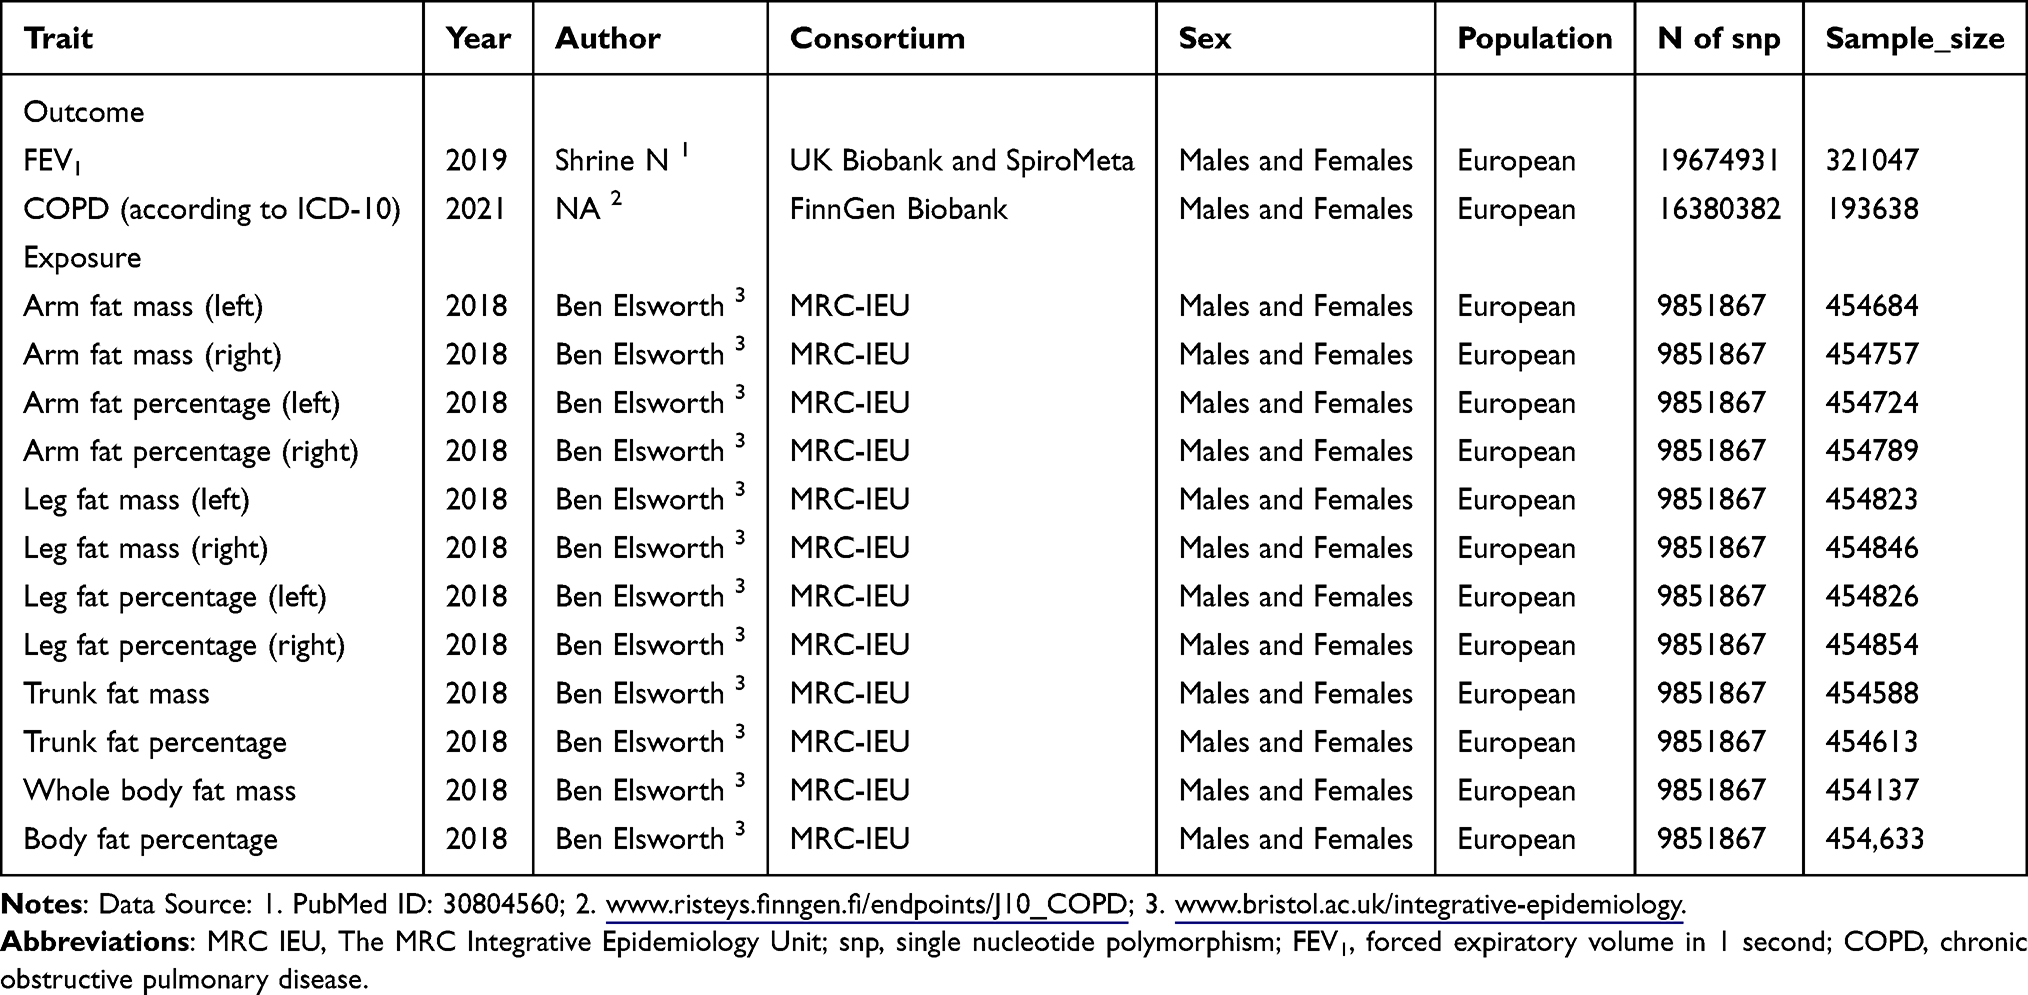 |
Table 2 Details of Databases Included in the Mendelian Randomization Analysis |
Genetically determined fat of arm, leg, trunk, and whole body presented negative causal effect on pre-bronchodilator FEV1 in IVW method (Figure 4). In WM analysis, per SD increase in genetically determined fat was also negatively (estimate < 0) and significantly (P < 0.001) associated with the pre-bronchodilator FEV1. What’s more, the increase in genetically predicted fat was also negatively (estimate < 0) associated with the pre-bronchodilator FEV1 in MR Egger analysis. In particular, the strongest association of fat with pre-bronchodilator FEV1 was found in the leg fat among several body parts.
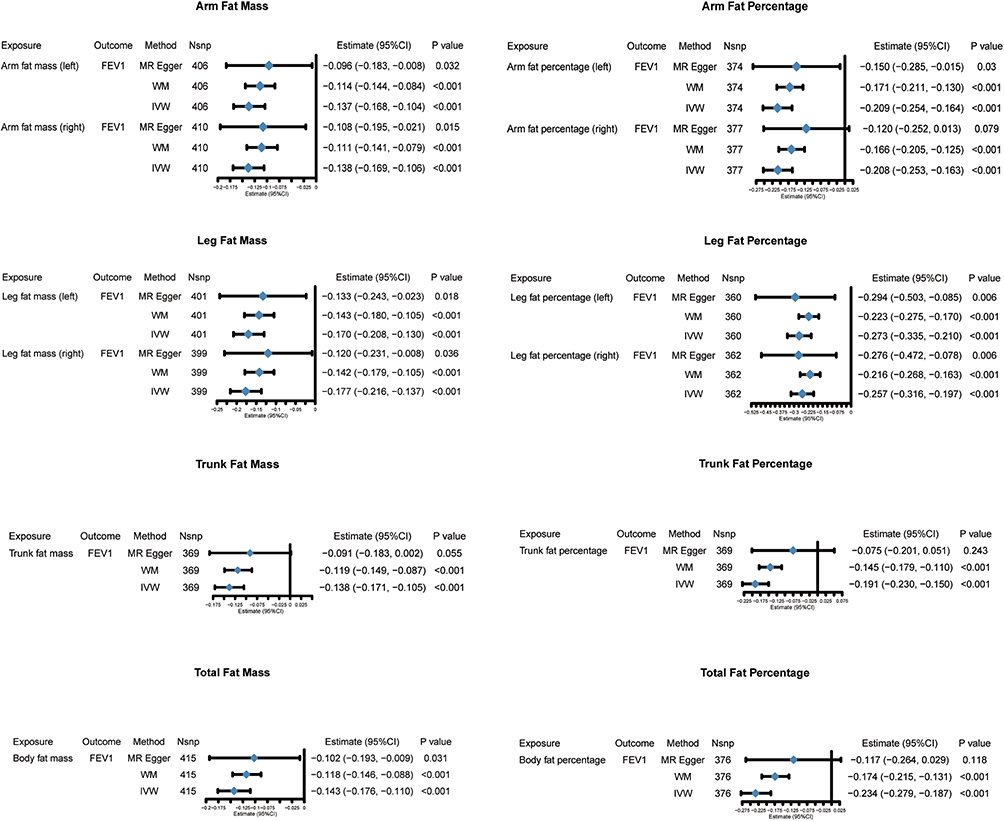 |
Figure 4 Causal effects of fat mass/percentage on pre-bronchodilator FEV1 in the Mendelian Randomization study. The causal estimates were assessed by two-sample Mendelian Randomization study with diverse methods. Pre-bronchodilator FEV1 is a measure of spirometry to determine airflow. Abbreviations: MR Egger, Egger method of Mendelian Randomization; MW, median weight method; IVW, inverse variance weighted method; FEV1, forced expiratory volume in 1 second; Nsnp, the number of single nucleotide polymorphism. |
The causal effects of genetically determined fat mass/percentage of the arm, leg, trunk, and whole body on COPD were determined in the IVW method (Figure 5). The effect of genetically determined fat mass/percentage on COPD was also found in WM and MR Egger analysis. It is worth pointing out that the strongest causal effect of the fat measure on COPD was found in the leg fat measures among several body parts.
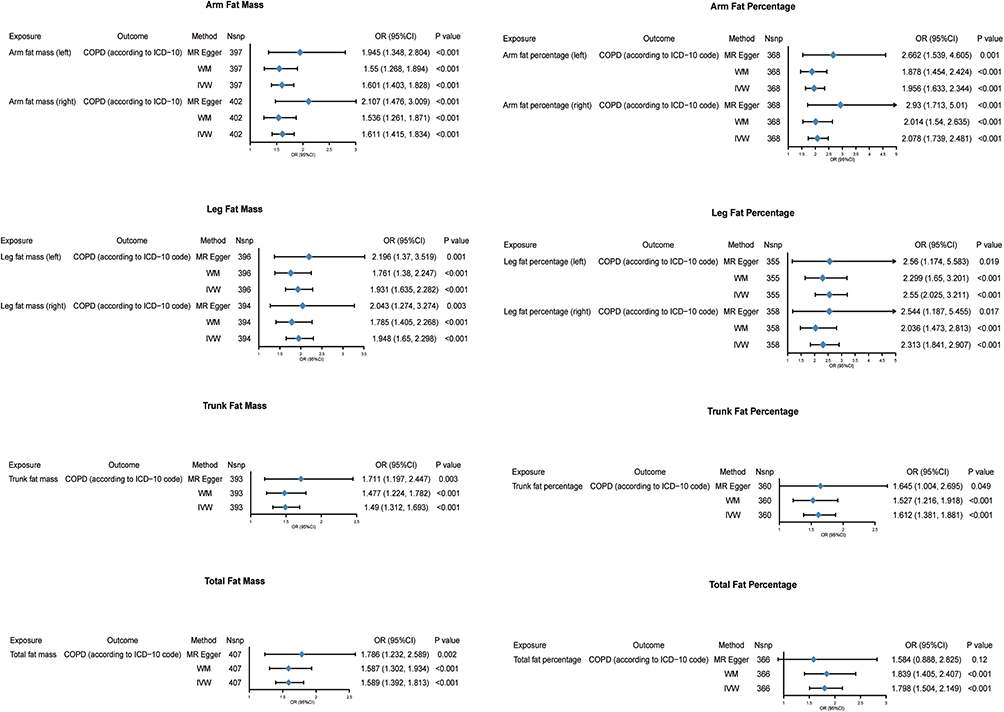 |
Figure 5 Causal effects of fat mass/percentage on clinical diagnosis COPD in the Mendelian Randomization study. The causal estimates were assessed by two-sample Mendelian Randomization study with diverse methods. COPD is a clinical diagnosis. Abbreviations: COPD, chronic obstructive pulmonary disease; MR Egger, Egger method of Mendelian Randomization; MW, median weight method; IVW, inverse variance weighted method; Nsnp, the number of single nucleotide polymorphisms used; OR, odds ratio. |
MR Heterogeneity test for the primary MR analysis (causal effect of body fat on lung function and COPD) showed that the heterogeneity of estimate was significant (Q_pval < 0.05 in Table S3). However, the estimates in IVW, WM, and MR-Egger methods did not change substantially (Figures 4 and 5). In addition, MR-Egger intercept tests presented no evidence of directional pleiotropy (Table S4). There were several large-population databases released by different authors on FEV1, FEV1 predicted percentage, and FEV1 best measure (Table S5). The scatter plots for estimated effect sizes of the SNPs on the exposure and outcomes (i.e., preFEV1 and COPD) were displayed in the Figures S1 and S2. Similar results were observed using IVW, MR‐Egger and WM methods in sensitivity analyses. We adapted other public-available databases on FEV1 into the sensitivity analysis, and the results of diverse databases are consistent with the primary MR analysis (Figures S3 and S4).
Discussion
This study identified the associations of fat mass/percentage (i.e., fat mass/percentage of arm, leg, trunk, and whole body) with lung function and the risk of clinical diagnosis COPD. Cross-sectional studies found that fat mass/percentage was inversely associated with pre-bronchodilator FEV1 and post-bronchodilator FEV1/FVC (persistent airflow limitation) after adjustment. The Two-sample Mendelian Randomization study confirmed the causal associations of fat mass/percentage with the decrease in pre-bronchodilator FEV1 and the increased risk of COPD (persistent airflow limitation after smoking exposure). It is worth mentioning that leg fat mass/percentage has the most significant association with lung function and COPD compared with other body parts. More specifically, per 1.9 kilograms (kg) increase in left leg fat mass was associated with a 93.1% higher risk of COPD, per 10.6% increase in the left fat percentage was associated with a 155.0% higher risk of COPD.
Overweight and obesity, defined by BMI, are the fifth leading cause of death worldwide.5 The 2012 South Carolina Behavioral Risk Factor Surveillance System Survey assessed the association between BMI and respiratory disease in 11868 adults and showed a higher prevalence of COPD in people with extreme BMI (i.e., too high or too low).16 Conversely, a study assessed the association between BMI and chronic airflow limitation in 18606 participants from 26 sites in 23 countries, and suggested that obesity was less common in subjects with airflow limitation.17 The inconsistency of conclusions in large studies often indicates the existence of confounding factors. One possible explanation is that BMI is affected by fat and fat-free (e.g., muscle) mass, but fat and fat-free may have different effects on lung function.18 Therefore, it is necessary to investigate the impact of fat distribution instead of BMI on lung function and COPD. The first part of this study examined the relationship between fat mass/percentage and lung function in a cross-sectional study. The extreme fat mass (i.e., too high or too low) was associated with lower pre-bronchodilator FEV1 when weight was not taken into account. After adjusting for the effects of height, weight, sex, age, and race, fat mass/percentage showed robust and inverse associations with pre-bronchodilator FEV1 and post-bronchodilator FEV1/FVC (Figures 2 and 3). This suggests that fat mass/percentage is a risk factor for persistent airflow limitation.
In recent years, several cross-sectional studies also explored the relationships between fat mass and lung function. A cross-sectional study from Japan measured body fat mass and lung function in 399 boys and 46 girls and found a significant inverse association between fat mass and lung function parameters in boys, and a similar trend was shown among girls.19 A cross-sectional study in China suggested that obesity-related parameters, including fat percentage, were negatively associated with adult lung function.6 The conclusions of these studies were consistent with the findings of our cross-sectional study (Figures 2 and 3).
Previous cross-sectional studies showed the association of trunk or abdominal fat with lung function. A cross-sectional study recruited 305 healthy adults, discovering that abdominal fat is negatively correlated with FEV1 in women and breast as well as abdominal fat is inversely associated with lung function in men.20 However, there was no study on the relationship between leg/arm fat and lung function. Our study found that fat mass/percentage of multiple body parts was associated with decreased lung function, suggesting the effect of fat on lung function is not limited to trunk fat. Furthermore, this study discovered that the strongest association exists between leg fat mass/percentage and lung function as well as COPD compared to other body parts (Figures 4 and 5), which reminds us that we need to pay more attention to the effect of leg fat on respiratory health.
In addition to cross-sectional studies, previous cohort studies further investigated the causal relationship between fat change and lung function. A population-based cohort study with over six years of follow-up of 15476 adults found that an increase in fat mass was significantly associated with an accelerated decline in FEV1, suggesting that changes in body composition over time can be used to identify high-risk individuals with a rapid decline in FEV1.9 However, to date, there is no cohort study to determine whether fat mass contributes to the development of COPD, perhaps because the emergence of COPD requires long-term observation in large populations. Furthermore, observational studies (i.e., cross-sectional and cohort studies) often present controversial findings due to potential confounders, reverse causality, and many other challenges.21 Therefore, it is almost impossible to clarify the causal effect of fat mass on lung function and COPD through observational studies. In the second part of this study, the MR method, an approach that could avoid the issues of potential confounders and reverse causality, was used to investigate whether fat mass/percentage could lead to a decline in pulmonary function and the development of COPD. The results of the second part suggested that the increased fat mass/percentage of the whole body, arm, trunk, and leg are the causal factors for the decline of pre-bronchodilator FEV1 and clinical diagnosis COPD (Figures 4 and 5).
Several potential mechanisms could explain the association between body fat and accelerated lung function decline. First, fat mass in the abdominal and thoracic may reduce lung capacity and result in expiratory flow restriction by limiting the space for the lungs to expand during inspiration.22 Second, the increase of fat mass can impair lung function through systemic inflammation, as adipose tissue is a source of inflammatory mediators that can damage lung tissue and increase airway resistance.22 Third, the increase of fat mass is associated with the T-cell profile and systemic cytokine levels of the immune system. Numerous studies have confirmed that adipose tissue disorders, such as obesity and lipodystrophy, lead to alterations in adipose tissue distribution and function, causing widespread effects on the expression of cytokines, chemokines, and hormones, lipid storage, and the composition of resident immune cell populations in adipose tissue. Changes in the immune system may be engaged in the development of COPD.23–25
One of the previous studies reached conflicting conclusions. An observational study of US Veterans found that overweight and obese patients were less likely to have COPD determined by pulmonary function testing among patients with empirically diagnosed COPD.26 There are several explanations for this difference. First, the participants of the studies were different. The population of the Veterans study was symptomatic people with empirically diagnosed COPD, but the subjects of our study was population-based. Second, as a cross-sectional study, the research design of Veterans study could not avoid confounders, so it cannot explain the causal associations between obesity and COPD. Third, the exposure of that study was overweight, and obesity defined by BMI was not completely consistent with the fat mass/percentage measured by DXA in our research.
The results of another previous study need appropriate discussion. An observational study carried out among COPD patients with sarcopenia showed that increased abdominal fat could be a protective factor for physical functioning.27 There are explanations for this different conclusion. First, we chose population-based databases to assess the relationship of fat with lung function. Thus, the result of our study could not be applied to patients with specific conditions. What’s more, the outcome of that observational study was physical functioning but not the change of lung function. Therefore, the results could not negate the effect of fat on lung function.
There are several important strengths in our study. First, the cross-sectional study is based on NHANES, a multi-stage stratified random sampling study across the US, which could be a good representation of the diverse multiethnic population, reflecting the impact of fat mass/percentage on lung function across the population. What’s more, multivariate linear regression with restricted cubic spline is applied in the analysis method, which allows us to explore the potential non-linear relationships. Most importantly, we conducted MR studies to clarify the causal relationship between fat mass/percentage and pulmonary function/COPD. Human genotypes are randomly obtained from the previous generation according to the principle of Mendelian inheritance. In the MR-designed study, participants were grouped by genotype, which solved the baseline imbalance issue between the exposure and control groups in the observational study. A large sample size summarized genetic data, and robust instrumental variables were used in this research, so there was enough power to come out with a robust causal effect estimation.
Some limitations should also be pointed out in our study. First, only the non-pregnant people aged 8–59 were examined by DXA in NHANES, so the conclusion of this cross-sectional analysis is not applicable to the elderly. Second, we chose clinical diagnosis COPD, defined via ICD-10 records in medical institutes, as the outcome of the MR study. Therefore, the causal effect estimation of fat mass/percentage on COPD in this study is not applicable to the spirometry defined COPD in the context of community. Third, as an observational study, the conclusions drawn from our results are subject to potential confounding factors that cannot be completely controlled. Although Mendelian Randomization (MR) analysis is a powerful tool for addressing some of these confounders by leveraging genetic variants as instrumental variables, it cannot fully account for all potential biases or reverse causality. Additionally, this study does not provide information on the long-term effects of body fat on lung function or the progression of chronic obstructive pulmonary disease (COPD). Further longitudinal studies are needed to assess how changes in body fat over time may influence lung health and whether these associations hold in the long term.
Based on existing knowledge of fat mass/percentage, we propose some points of future prospects. First, while DXA permits precise quantification of fat mass or body fat percentage, its utilization is encumbered by operational complexities and concerns pertaining to radiation exposure, thereby constraining its widespread application. Bioelectrical impedance analysis (BIA) is an easy-to-operate, portable, non-radioactive approach with excellent repeatability and consistency.28 Developing and promoting BIA detection methods for leg fat mass may help manage the effects of body fat on lung health. Second, previous studies showed interventions, including pulmonary rehabilitation, weight management, and bariatric surgery, could improve lung function as well as reduce body fat.29–31 However, whether the intervention on reducing fat could directly improve lung function demands further experimental confirmation by randomized controlled trials.
Our study has important clinical implications. First, recognizing that increased fat mass, particularly in the legs, is associated with a higher risk of COPD, clinicians should consider body composition, beyond just BMI, when assessing patients at risk for lung diseases. The clinical practice of evaluating lung function should integrate measurements of body fat distribution, as this could help identify individuals who might benefit from early interventions aimed at managing both fat accumulation and lung health. Furthermore, the findings of this study suggest that targeted weight management, potentially focusing on reducing leg fat mass, could be a strategy to mitigate the decline in lung function and the risk of COPD progression. Clinical programs, such as pulmonary rehabilitation and weight management interventions, should take body fat distribution into account to optimize treatment outcomes.
Conclusion
In conclusion, our study highlights the significant association between body fat distribution, particularly leg fat mass, and lung function. These findings suggest that body fat, especially in the arm and leg, may be an important factor in the early detection and management of lung diseases such as COPD. By incorporating body fat measurements into routine clinical assessments, healthcare providers can better identify individuals at risk of impaired lung function. This could lead to more personalized and effective interventions aimed at managing both obesity and respiratory health.
Abbreviations
COPD, Chronic obstructive pulmonary disease; BMI, Body Fat Index; FEV1, Forced expiratory volume in 1 second; FVC, Forced vital capacity; MR, Mendelian Randomization; YLL, Years of life lost; DALYs, Disability-adjusted life years; NHANES, National Health and Nutrition Examination Survey; NCHS, National Center for Health Statistics; DXA, Dual-energy x-ray absorptiometry; LLN, Lower limits of normal; STROBE, The Strengthening the Reporting of Observational Studies in Epidemiology; MAF, The Minor Allele Frequency; SNPs, Single nucleotide polymorphisms; OR, Odd ratio; LD, Linkage disequilibrium; BIA, Bioelectrical impedance analysis.
Data Sharing Statement
The dataset generated and/or analyzed during the current study is available on the open GWAS project website (https://gwas.mrcieu.ac.uk/datasets/ieu-b-106/), which was curated by Higbee D from the original data obtained from the UK Biobank and SpiroMeta consortium. Data generated in this study are available upon reasonable request directed to the corresponding author.
Ethics Statement
The Ethics Committee of the First Affiliated Hospital of Guangzhou Medical University allows researchers to use publicly available databases containing human data without the need for special approval.
Acknowledgments
The authors thank the NHANES, the Meta-Analysis of GWAS reported by Ben Elsworth in 2018, the Meta-Analysis of GWAS from the UK Biobank and SpiroMeta program, and a recent GWAS from FinnGen Biobank. The researcher’s institution does not impose ethical restrictions or reviews on the analysis of public databases.
Author Contributions
All authors made a significant contribution to the work reported, whether that is in the conception, study design, execution, acquisition of data, analysis and interpretation, or in all these areas; took part in drafting, revising or critically reviewing the article; gave final approval of the version to be published; have agreed on the journal to which the article has been submitted; and agree to be accountable for all aspects of the work.
Funding
This study was funded by Markers for Early Diagnosis of Lung Cancer and Early Intervention Strategies (SRPG22-017).
Disclosure
The authors declared no conflict of interest in this work.
References
1. Causes of Death Collaborators. Global burden of 288 causes of death and life expectancy decomposition in 204 countries and territories and 811 subnational locations, 1990-2021: a systematic analysis for the global burden of disease study 2021, Lancet. 2024;403(10440):2100–2132. PubMed PMID: 38582094. doi:10.1016/S0140-6736(24)00367-2
2. Tønnesen P. Smoking cessation and COPD. Eur Respir Rev. 2013;22(127):37–43. PubMed PMID: 23457163. doi:10.1183/09059180.00007212
3. Riley CM, Sciurba FC. Diagnosis and outpatient management of chronic obstructive pulmonary disease: a review. JAMA. 2019;321(8):786–797. PubMed PMID: 30806700. doi:10.1001/jama.2019.0131
4. Organization WH. Obesity and Overweight. World Health Organization Web Site. 2021;2.
5. Organization WH. The top 10 causes of death. World Health Organization Web Site. 2020.
6. Zeng X, Liu D, An Z, Li H, Song J, Wu W. Obesity parameters in relation to lung function levels in a large Chinese rural adult population. Epidemiol Health. 2021;43:e2021047. PubMed PMID: 34353001; PubMed Central PMCID: PMCPMC8602009. doi:10.4178/epih.e2021047
7. Hagenburg J, Bertin E, Salmon JH, et al. Association between obesity-related dyspnea in daily living, lung function and body composition analyzed by DXA: a prospective study of 130 patients. BMC Pulm Med. 2022;22(1):103. PubMed PMID: 35337302; PubMed Central PMCID: PMCPMC8957162. doi:10.1186/s12890-022-01884-5
8. Higbee DH, Granell R, Davey Smith G, Dodd JW. Prevalence, risk factors, and clinical implications of preserved ratio impaired spirometry: a UK Biobank cohort analysis. Lancet Respir Med. 2022;10(2):149–157. PubMed PMID: 34739861. doi:10.1016/s2213-2600(21)00369-6
9. Park HK, Lee SH, Lee SY, Kim SS, Park HW. Relationships between lung function decline and skeletal muscle and fat mass changes: a longitudinal study in healthy individuals. J Cachexia Sarcopenia Muscle. 2021;12(6):2145–2153. PubMed PMID: 34612015; PubMed Central PMCID: PMCPMC8718064. doi:10.1002/jcsm.12821
10. Fenger RV, Gonzalez-Quintela A, Vidal C, et al. The longitudinal relationship of changes of adiposity to changes in pulmonary function and risk of asthma in a general adult population. BMC Pulm Med. 2014;14(1):208. PubMed PMID: 25532602; PubMed Central PMCID: PMCPMC4364582. doi:10.1186/1471-2466-14-208
11. Muñoz-Cofré R, Lizana PA, Cabello ME, García-Herrera C, Del Sol M. Association between air flow limitation and body composition in young adults. J Physiol Anthropol. 2021;40(1):2. PubMed PMID: 33468239; PubMed Central PMCID: PMCPMC7816486. doi:10.1186/s40101-021-00252-2
12. Chen YY, Kao TW, Fang WH, et al. Body fat percentage in relation to lung function in individuals with normal weight obesity. Sci Rep. 2019;9(1):3066. PubMed PMID: 31217470; PubMed Central PMCID: PMCPMC6584631. doi:10.1038/s41598-019-38804-3
13. Emdin CA, Khera AV, Kathiresan S. Mendelian Randomization. JAMA. 2017;318(19):1925–1926. PubMed PMID: 29164242. doi:10.1001/jama.2017.17219
14. Shrine N, Guyatt AL, Erzurumluoglu AM, et al. New genetic signals for lung function highlight pathways and chronic obstructive pulmonary disease associations across multiple ancestries. Nat Genet. 2019;51(3):481–493. PubMed PMID: 30804560; PubMed Central PMCID: PMCPMC6397078. doi:10.1038/s41588-018-0321-7
15. Zhou H, Zhang Y, Liu J, et al. Education and lung cancer: a Mendelian randomization study. Int J Epidemiol. 2019;48(3):743–750. PubMed PMID: 31219597. doi:10.1093/ije/dyz121
16. Hanson C, LeVan T. Obesity and chronic obstructive pulmonary disease: recent knowledge and future directions. Curr Opin Pulm Med. 2017;23(2):149–153. PubMed PMID: 27906857. doi:10.1097/mcp.0000000000000354
17. Vanfleteren LE, Lamprecht B, Studnicka M, et al. Body mass index and chronic airflow limitation in a worldwide population-based study. Chron Respir Dis. 2016;13(2):90–101. PubMed PMID: 26768010; PubMed Central PMCID: PMCPMC5734599. doi:10.1177/1479972315626012
18. Myung J, Lee H, Kim TH, Han E. Relationships between self-reported asthma and pulmonary function and various measures of obesity. J Asthma. 2018;55(7):741–749. PubMed PMID: 28800274. doi:10.1080/02770903.2017.1362701
19. Kapuš O, Fellnerová I, Chaloupková P, Martišová K. Relationship between body composition and pulmonary function in healthy adolescents. Pediatr Int. 2022;64(1):e15114. PubMed PMID: 35704449. doi:10.1111/ped.15114
20. Martin Holguera R, Turrion Nieves AI, Rodriguez Torres R, Alonso MC. The effects of truncal adiposity in forced spirometry: sex differences. Respir Physiol Neurobiol. 2018;247:167–173. PubMed PMID: 29111228. doi:10.1016/j.resp.2017.10.009
21. Smith GD, Ebrahim S. Data dredging, bias, or confounding. BMJ. 2002;325(7378):1437–1438. PubMed PMID: 12493654; PubMed Central PMCID: PMCPMC1124898. doi:10.1136/bmj.325.7378.1437
22. Salome CM, King GG, Berend N. Physiology of obesity and effects on lung function. J Appl Physiol. 2010;108(1):206–211. PubMed PMID: 19875713. doi:10.1152/japplphysiol.00694.2009
23. Peres A, Dorneles GP, Dias AS, Vianna P, Chies JAB, Monteiro MB. T-cell profile and systemic cytokine levels in overweight-obese patients with moderate to very-severe COPD. Respir Physiol Neurobiol. 2018;247:74–79. PubMed PMID: 28963085. doi:10.1016/j.resp.2017.09.012
24. Makki K, Froguel P, Wolowczuk I. Adipose tissue in obesity-related inflammation and insulin resistance: cells, cytokines, and chemokines. ISRN Inflamm. 2013;2013:139239. PubMed PMID: 24455420. doi:10.1155/2013/139239
25. Trim W, Turner JE, Thompson D. Parallels in Immunometabolic Adipose Tissue Dysfunction with Ageing and Obesity. Front Immunol. 2018;9:169. PubMed PMID: 29479350. doi:10.3389/fimmu.2018.00169
26. Collins BF, Feemster LC, Rinne ST, Au DH. Factors predictive of airflow obstruction among veterans with presumed empirical diagnosis and treatment of COPD. Chest. 2015;147(2):369–376. PubMed PMID: 25079684; PubMed Central PMCID: PMCPMC4314814. doi:10.1378/chest.14-0672
27. van de Bool C, Rutten EP, Franssen FM, Wouters EF, Schols AM. Antagonistic implications of sarcopenia and abdominal obesity on physical performance in COPD. Eur Respir J. 2015;46(2):336–345. PubMed PMID: 25882802. doi:10.1183/09031936.00197314
28. Cruz Rivera PN, Goldstein RL, Polak M, Lazzari AA, Moy ML, Wan ES. Performance of bioelectrical impedance analysis compared to dual X-ray absorptiometry (DXA) in Veterans with COPD. Sci Rep. 2022;12(1):1946. PubMed PMID: 35121763; PubMed Central PMCID: PMCPMC8816927. doi:10.1038/s41598-022-05887-4
29. Huivaniuk O, Stupnytska H, Fediv O, Bocharov A. The effectiveness of short-term pulmonary rehabilitation program in patients with comorbid asthma, chronic obstructive pulmonary disease and obesity. J Med Life. 2022;15(2):196–201. PubMed PMID: 35419107; PubMed Central PMCID: PMCPMC8999100. doi:10.25122/jml-2021-0050
30. Chew K, Carey K, Ho G, Mallitt KA, Widger J, Farrar M. The relationship of body habitus and respiratory function in Duchenne muscular dystrophy. Respir Med. 2016;119:35–40. PubMed PMID: 27692145. doi:10.1016/j.rmed.2016.08.018
31. Campos EC, Peixoto-Souza FS, Alves VC, et al. Improvement in lung function and functional capacity in morbidly obese women subjected to bariatric surgery. Clinics. 2018;73:e20. PubMed PMID: 29561930; PubMed Central PMCID: PMCPMC5833013. doi:10.6061/clinics/2018/e20
 © 2025 The Author(s). This work is published and licensed by Dove Medical Press Limited. The
full terms of this license are available at https://www.dovepress.com/terms
and incorporate the Creative Commons Attribution
- Non Commercial (unported, 4.0) License.
By accessing the work you hereby accept the Terms. Non-commercial uses of the work are permitted
without any further permission from Dove Medical Press Limited, provided the work is properly
attributed. For permission for commercial use of this work, please see paragraphs 4.2 and 5 of our Terms.
© 2025 The Author(s). This work is published and licensed by Dove Medical Press Limited. The
full terms of this license are available at https://www.dovepress.com/terms
and incorporate the Creative Commons Attribution
- Non Commercial (unported, 4.0) License.
By accessing the work you hereby accept the Terms. Non-commercial uses of the work are permitted
without any further permission from Dove Medical Press Limited, provided the work is properly
attributed. For permission for commercial use of this work, please see paragraphs 4.2 and 5 of our Terms.