Back to Journals » International Journal of General Medicine » Volume 14
Elevated Serum Cyclophilin D Level is Associated with Nonalcoholic Fatty Liver Disease and Higher Fibrosis Scores in Patients with Diabetes Mellitus
Authors Naguib M ![]() , Abou Elfotouh M, Wifi MN
, Abou Elfotouh M, Wifi MN
Received 4 June 2021
Accepted for publication 21 July 2021
Published 18 August 2021 Volume 2021:14 Pages 4665—4675
DOI https://doi.org/10.2147/IJGM.S322986
Checked for plagiarism Yes
Review by Single anonymous peer review
Peer reviewer comments 2
Editor who approved publication: Dr Scott Fraser
Mervat Naguib,1 Mahmoud Abou Elfotouh,2 Mohamed-Naguib Wifi2
1Diabetes and Endocrinology Unite, Internal Medicine Department, Faculty of Medicine, Kasr Al-Ainy Hospital, Cairo University, Cairo, Egypt; 2Hepatology Unite, Internal Medicine Department, Faculty of Medicine, Kasr Al-Ainy Hospital, Cairo University, Cairo, Egypt
Correspondence: Mervat Naguib
Diabetes and Endocrinology Unite, Internal Medicine Department, Faculty of Medicine, Kasr Al-Ainy Hospital, 41 Manial Street, Cairo 11451, Egypt
Tel +20 25729584
Fax +20 2628884
Email [email protected]
Background: Cyclophilin D (CypD) is a mitochondrial matrix protein involved in liver steatosis and fibrosis in vitro. However, the role of CypD in the development of fatty liver and liver fibrosis in humans has not been determined.
Purpose: To measure the serum level of CypD in patients with type 2 diabetes (T2DM) and nonalcoholic fatty liver disease (NAFLD) and to assess its relation to the presence of hepatic steatosis and fibrosis in this group of patients.
Patients and Methods: In this cross-sectional study, 30 patients with diabetes and NAFLD were compared to 30 patients with diabetes without NAFLD and 30 age- and sex-matched healthy subjects. Abdominal ultrasound was used to diagnose NAFLD. Serum CypD was measured using ELISA. Fibrosis-4 (FIB-4) index, AST to platelet ratio index (APRI), and NAFLD fibrosis score (NFS) were used as markers of liver fibrosis in patients with NAFLD. Patients with NAFLD were divided into two subgroups based on FIB-4 index: patients with liver fibrosis (FIB-4 > 1.45) and patients without liver fibrosis (FIB-4 < 1.45). CypD and other clinical and biochemical parameters were validated as predictors of NAFLD and liver fibrosis in diabetic patients in multivariate logistic regression analysis.
Results: Diabetic patients with NAFLD had higher serum CypD levels than those without NAFLD (11.65± 2.96 vs 6.58± 1.90 ng/mL, respectively, P < 0.001). Correlation analysis revealed a significant positive correlation between CypD and FIB-4 index (P=0.001), APRI (P=0.013) and NFS (P< 0.001). GGT and CypD were the only predictors of NAFLD. For the prediction of significant fibrosis, AUROC of CypD was 0.835 with a cutoff > 14.05 ng/mL provides specificity of 81.8% and sensitivity of 75%.
Conclusion: Serum CypD is related to hepatic steatosis and fibrosis in diabetic patients. Serum CypD may thus provide a novel marker and therapeutic target of NAFLD and liver fibrosis.
Keywords: cyclophilin D, fatty liver, fibrosis, type 2 diabetes
Introduction
Nonalcoholic fatty liver disease (NAFLD) is a major health problem worldwide. NAFLD affects up to 25% of the general population with highest prevalence among the Middle East population.1 NAFLD is usually recognized as the hepatic presentation of the metabolic syndrome.2 About 30% of patients with NAFLD were discovered to have type 2 diabetes mellitus (T2DM), and up to 80% of NAFLD cases have insulin resistance.3
The disease begins with hepatic steatosis and may advance to steatohepatitis that may progress to liver fibrosis and cirrhosis.4 Various factors are involved in the pathogenesis of NAFLD. Systemic insulin resistance is a key driver of hepatic steatosis in NAFLD.5 The initial insult of lipid excess is followed by multiple pathogenic processes including lipotoxicity, oxidative stress and immune system derangement.6
Mitochondrion is a key player in the metabolic homeostasis and mitochondrial dysfunction is related to hepatic insulin resistance and hepatic steatosis.7 NAFLD and diabetes are associated with changes in mitochondrial structure and impaired respiratory chain function leading to decreased adenosine triphosphate (ATP) synthesis, accumulation of triglycerides in hepatocytes and increased reactive oxygen levels. These changes lead to insulin resistance and hepatocyte inflammation that promotes cell death and development of fibrosis.8
Mitochondrial permeability transition pore (mPTP) is an important regulator of mitochondrial homeostasis and so the cellular metabolism. The mPTP extends between the outer and inner mitochondrial membranes and allows the passage of different molecules when it opens.9 Different stimuli like excess active oxygen species and increased calcium level promote opening of mPTP.10 Transient opening of mPTP is essential to maintain mitochondrial function, however, permanent opening of these channels under conditions of extreme cellular stress leads to the rapid passage of ions and large molecules that can lead to cell death.11
Cyclophilin D (CypD), is an 22 kDa chaperone protein which is the product of the PPIF gene. CypD is a member of the cyclophilin family of peptidyl-prolyl, cis-trans isomerases (PPIases) that are present in the mitochondrial matrix.12 CypD has an important role in the regulation of mitochondrial function. CyPD controls the opening of mPTP to decrease ATP and increase production of reactive oxygen radicals.13 It was reported that CypD is related to ischemia reperfusion injury in the heart, lung, and kidney.13
Accumulating evidence suggest that CypD plays an important role in the development of hepatic steatosis and possibly will provide a new opportunity for the treatment of NAFLD. Increased CypD expression in hepatocytes stimulates mPTP excessive opening, subsequently causing endoplasmic reticulum stress and resulting in enhanced sterol regulatory element–binding protein-1c transcription and hepatic steatosis.14
However, CypD shows tissue-specific effects on metabolic homeostasis, for example, deletion of muscle CypD did not change the whole body glucose metabolism, while the loss of liver CypD was associated with development of obesity and altered the whole body metabolic dysfunction.12 Moreover, most of the previous studies were experimental and are based on the effect of CypD at mitochondrial level but no data about serum levels of this protein are available.13,14 The aim of this study was to investigate the serum level of CypD in diabetic patients with NAFLD and its relation to presence of hepatic fibrosis.
Materials and Methods
Study Design
This study was a case-control study conducted in a tertiary care referral hospital between January 2017 and January 2018 after approval of the institutional ethical committee. We assigned 90 age and sex matched subjects included; 30 patients with T2DM and NAFLD, 30 patients with T2DM without NAFLD and 30 healthy controls. All subjects provided informed consent to participate in this study. The study protocol and procedures conform to the ethical guidelines of the 1975 Declaration of Helsinki. This study was approved by the Research Ethical Committee of Faculty of Medicine—Cairo University.
Subjects and Methods
Patients with diagnosis of T2DM based on ADA criteria were eligible for inclusion in this study.15 Exclusion criteria included patients with (1) diabetes other than T2DM; (2) chronic liver disease other than NAFLD; (3) history of alcohol intake or medications that might affect liver function; (4) history of cardiac or neurological diseases. Clinical data obtained included age, sex, waist circumference, BMI [weight (kg)/height (m2)], and duration of diabetes. Blood samples were collected from each individual after a period of 10–12 h fasting for measurement of fasting blood glucose (FBG), glycated hemoglobin (HbA1C), alanine aminotransferase (ALT), aspartate aminotransferase (AST), gamma-glutamyl transpeptidase (GGT), international normalized ratio (INR), hemoglobin, platelet count, total cholesterol (TC), triglycerides (TG) and CypD.
Serum CypD level was measured using ELISA kit applies the competitive enzyme immunoassay technique utilizing a monoclonal anti-CypD antibody and an CypD-HRP conjugate (MyBioSource, Inc., CA, USA) according to manufacturer’s instructions. Samples were collected in EDTA tubes; centrifugation was done for 15 min at 1000×g at 2–8°C within 30 min of collection and samples stored at −80°C. Before carrying out the test, serum samples were brought to room temperature and centrifuged. Absorbance measurements were carried out in a microplate reader at 450 nm and the concentrations were calculated using a standard curve.
Assessment of hepatic steatosis was done using abdominal ultrasound (US) after fasting overnight. All US scans were performed by the same sonographer using a high-resolution multifrequency B-mode scanner (SDD-5500; Aloka, Tokyo, Japan) 2.5–5.0 MHz transducer. NAFLD was identified by the presence of at least two of the three following abnormal findings: diffusely increased echogenicity of the liver relative to the right kidney; attenuation of the ultrasound beam; poor visualization of intrahepatic architectural details.16
The fatty liver index score (FLI) was calculated in each participant using the following formula FLI = (e0.953×loge(triglycerides)+0.139×BMI+0.718×loge(GGT)+0.053×waist circumference−15.745)/(1+e0.953×loge(triglycerides)+0.139×BMI+0.718×loge(GGT)+0.053×waist circumference−15.745)×100.17 To assess liver fibrosis in patients with NAFLD fibrosis-4 (FIB-4) index was calculated using the formula: FIB-4=Age (years)×AST (U/L)/[Platelet count (109/L)×ALT1/2 (U/L)].18 Diabetic patients with NAFLD were divided into two subgroups based on FIB-4 index: patients with liver fibrosis (FIB-4 >1.45) and patients without liver fibrosis (FIB-4 <1.45). The aspartate aminotransferases (AST) to platelet ratio index (APRI) score APRI=(AST in IU/L)/(AST upper limit of normal in IU/L)/(Platelets in 109/L) and NAFLD fibrosis score (NFS)= −1.675 + (0.037*age [years])+(0.094*BMI [kg/m2])+(1.13*IFG/diabetes [yes=1, no=0])+(0.99*AST/ALT ratio)–(0.013*platelet count [×109/L])–(0.66*albumin [g/dL]) were calculated in all patients with NAFLD.19,20
Statistical Analysis
Data was summarized using mean and standard deviation for quantitative variables and frequencies (number of cases) and relative frequencies (percentages) for categorical variables. Comparisons between groups were done using analysis of variance (ANOVA) with multiple comparisons post hoc test in normally distributed quantitative variables while nonparametric Kruskal–Wallis test and Mann–Whitney test were used for non-normally distributed quantitative variables. For comparing categorical data, chi-squared (v2) test was performed. Exact test was used instead when the expected frequency is less than five. Correlations between quantitative variables were done using Pearson's correlation coefficient. Univariate and multivariate logistic regression were done to detect independent predictors of fatty liver and fibrosis. Receiver operating characteristics (ROC) analysis was used to evaluate the diagnostic value of CypD to identify patients NAFLD and liver fibrosis. Area under the curve was generated using nonparametric assumption. Sensitivity and specificity values of CypD were profiled by curves. Data were coded and entered using the statistical package SPSS version 24. P-values less than 0.05 were considered as statistically significant.
Results
Baseline Characteristics
A total of 60 patients with T2DM (30 patients with NAFLD and 30 patients without NAFLD) and 30 healthy control subjects were enrolled in this study. By using ANOVA, there was no statistically significant difference between healthy control, diabetic patients without NAFLD and those with NAFLD regarding age (46.60±9.61; 50.10±8.29; 50.10±8.45, P=0.212), BMI (28.66±4.31; 28.48±5.40; 27.51±5.15, P=0.633), waist circumference (91.34±17.98; 96.50±16.72; 98.18±17.52, P=0.289), ALT (32.40±8.58; 33.90±8.85; 47.30±32.29, P=0.173) and AST (33.23±6.67; 34.03±6.52; 49.10±40.34, P=0.417). Patients with NAFLD had significantly higher GGT (78.67±31.42 vs 38.60+13.26; P<0.001), HbA1c (8.61±1.51% vs 5.04±0.80%; P<0.001), TC (6.97±0.75 vs 4.56±0.74; P<0.001) and TG (2.78±0.51 vs 1.69±0.4; P<0.001) than control. However, the difference was not statistically significant between patients with NAFLD and those without NAFLD regarding HbA1c (8.61±1.51% vs 8.38±1.34; P=0.541), TC (6.97±0.75 vs 6.94±0.84; P=0.908) and TG (2.78±0.51 vs 2.58±0.55; P<0.001). Patients with NAFLD compared to those without NAFLD had longer duration of diabetes (8.47±2.98 vs 5.62±2.14; P<0.001), higher GGT level (78.67±31.42 vs 43.03±16.19; P<0.001) and FLI (78.67±31.42 vs 43.96±15.51; P<0.001). In patients with NAFLD mean FIB-4 index (1.173±0.65), and APRI (0.47±0.40). Table 1 shows clinical characteristics and laboratory parameters of T2DM patients and control group.
 |
Table 1 Baseline Clinical Parameters of the Study Groups |
Serum Levels of CypD in the Studied Population
Serum CypD was significantly higher in T2DM patients compared to control subjects (11.65±2.96 vs 6.58±1.90; P<0.001) (Table 1). Moreover, T2DM patients with NAFLD had significantly higher CypD level (11.65±2.96 ng/mL) compared to those without NAFLD (6.58+1.90 ng/mL, P<0.001) (Figure 1). Patients NAFLD with FIB-4 >1.45 had significantly higher CypD level (14.27±2.77 ng/mL) than those with FIB-4 <1.45 (10.70±2.44 ng/mL, P=0.01) (Figure 2).
 |
Figure 1 Serum level of cyclophilin D was significantly higher in T2DM patients without NAFLD compared to control subjects (6.58±1.90 vs 3.51±1.47 ng/mL, respectively, P<0.001). T2DM patients with NAFLD had significantly higher cyclophilin D level than those without NAFLD (11.65±2.96 vs 6.58±1.90 ng/mL, respectively, P<0.001). |
 |
Figure 2 Cyclophilin D was significantly elevated in NAFLD patients with fibrosis as identified by FIB-4 compared with those without fibrosis (14.27±2.77 vs 10.70+2.44, respectively, P=0.010). |
Correlations of Serum CypD and Different Variables in Diabetic Patients with NAFLD
Pearson’s correlation was used to assess the correlation between CypD and different variables. There was significant positive correlation between CypD and FIB-4 index (P=0.001), APRI (P=0.013) and NFS (P<0.001). However, there was no significant correlation between CypD level and age (P=0.877), BMI (P=0.117), ALT (P=0.693), HbA1c (P=0.313), total cholesterol (P=0.888) (Table 2).
 |
Table 2 Correlations of Serum Cyclophilin D with Different Variables in Diabetic Patients with NAFLD |
Uni- and Multivariable Logistic Regression Analyses of Determinants of NAFLD
Using presence or absence of NAFLD as state variable univariate regression analysis revealed a significant positive association between NAFLD and GGT [OR, 1.068 (1.033–1.104); P<0.001], CypD [OR, 2.492 (1.594–3.895); P<0.001] and FLI [OR, 1.131 (1.062–1.204); P<0.001]. No association was found between NAFLD and BMI (P=0.476), HbA1C (P=0.541), TC (P=0.908), TG (P=0.345) (Table 3). The association between CypD and NAFLD remained significant when adjusted for GGT and FLI [OR, 1.968 (1594–2.540); P<0.001]. In a multivariate logistic regression model, which included variables significantly associated with NAFLD in the univariate analyses, only CypD [OR, 2.027 (1.128–3.642); P=0.018] and GGT [OR, 1.057 (1.002–1.116); P=0.041].
 |
Table 3 Univariate Analyses of Determinants of NAFLD |
Uni- and Multivariable Logistic Regression Analyses of Determinants of Liver Fibrosis in Patients with NAFLD
Patients with NAFLD were divided into two groups based on FIB-4 index: patients with FIB-4 >1.45 (patients with fibrosis) and patients with FIB-4 <1.45 (patients with no fibrosis). CypD [OR, 1.687 (1.130–2.517); P=0.010], age [OR, 1.142 (1.005–1.298); P=0.042] were independent prognostic factors of liver fibrosis in univariate analysis (Table 4). In multivariable analysis CypD was significant independent predictor for liver fibrosis [OR, 1.992 (1.171–3.391); P=0.011]
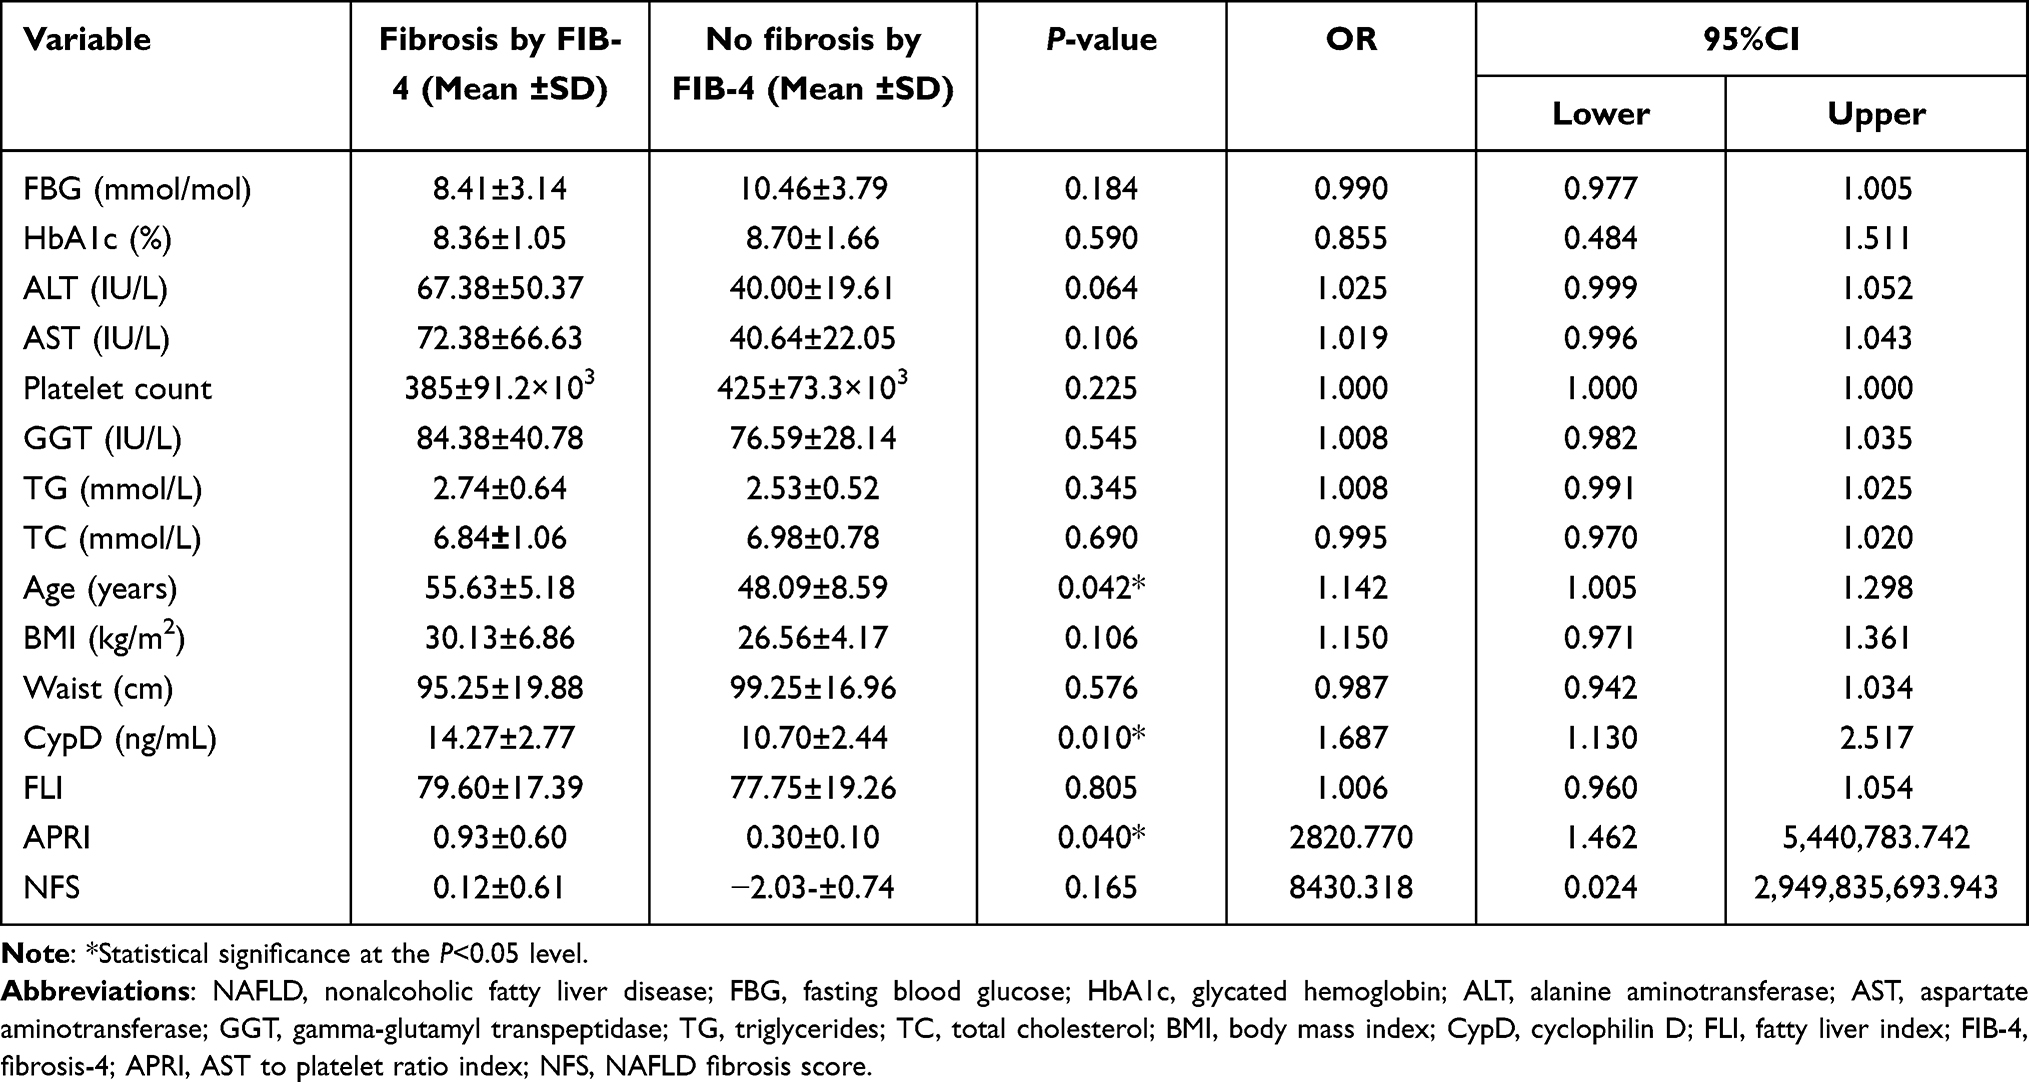 |
Table 4 Univariate Logistic Regression for Predictors of Fibrosis in Patients with NAFLD |
CypD as Predictor of Fatty Liver and Liver Fibrosis
ROC curve was calculated on the basis of CypD level and FLI using NAFLD presence or absence as state variable. CypD had higher sensitivity but lower specificity than FLI in diagnosis of NAFLD. The AUC was 0.922 (95% confidence interval (CI); 0.853–0.992, P<0.001) with the best cutoff value of CypD was 7.55 (Figure 3).
 |
Figure 3 Receiver-operating-characteristic curves (ROC) describing cyclophilin D (CypD) as predictor of nonalcoholic fatty liver disease compared to FLI in patients with diabetes. CypD, the AUC was 0.922 (95% confidence interval (CI):, 0.853–0.992, P< .001), cut-ff: 7.55 ng/mL, sensitivity: 96.7%, specificity: 83.3%. FLI, the AUC was 0.927 (95%CI: 0.842–1.011, P<0.001), cutoff value: 62.50, sensitivity: 60%, specificity: 100%. |
ROC curves of CypD, APRI and NFS for detecting fibrosis as defined by FIB-4 showed that the AUROC was highest for NFS at 0.989, followed by the CypD (AUROC=0.835) at 14.055 ng/mL and APRI (AUROC=0.886) at 0.339. The sensitivity of CypD (75%) as a predictor of liver fibrosis was lower than APRI (87.5%) and NFS (100%). However, the specificity of CypD (81.8%) in prediction of hepatic fibrosis was higher than APRI (77.3%) but, lower than NFS (95.5%) (Figure 4).
 |
Figure 4 Receiver-operating-characteristic curves (ROC) describing cyclophilin D (CypD) as predictor of liver fibrosis as identified by FIB-4 >1.45 compared to AST to platelet ratio index (APRI) and NAFLD fibrosis score (NFS) in patients with nonalcoholic fatty liver disease. CypD, AUROC=0.835 (95%CI: 0.672–0.998, P<0.001), cutoff = 14.05 ng/mL, specificity=81.1%, sensitivity=75%. APRI, AUROC=0.886 (95%CI: 0.745–1.028, P<0.001), cutoff=0.339, specificity=77.3%, sensitivity=87. %. NFS, AUROC=0.989 (95%CI: 0.960–1.018, P<0.001), cutoff = −0.710, specificity=95.5%, sensitivity=100%. |
Discussion
CypD is a main regulator of the mitochondrial permeability, and it is localized in the mitochondria.21 A growing body of evidence points to the role of mitochondrial dysfunction and disorder of mitophagy homeostasis in the development of insulin resistance, metabolic derangement and hepatic steatosis and fibrosis.22,23,24 However, most of it came from investigations on the cellular and molecular levels.12,14,22 Recently, Alfonso et al reported a significant association between serum level of CypC, CypA, and CypB, but not CypD and coronary artery disease and several metabolic parameters.25 Also, Mutlu et al found that serum levels of CypA are elevated in patients with NAFLD, particularly those with diabetes.26 Whether serum CypD could be a surrogate marker of hepatic expression of this ubiquitous protein needs to be addressed. The main finding of the current study was significant elevation of serum CypD in T2DM patients with NAFLD and CypD level more than 7.55 (ng/mL) was able to identify diabetic patients with NAFLD with a higher sensitivity than FLI. Furthermore, there was statistically significant correlation of CypD and different fibrosis scores in patients with NAFLD.
Various experimental studies have shown the role of CypD in the development of hepatic steatosis.12,14,26,27 In mice fed a high-fat diet, CypD expression increased and preceded the accumulation of hepatic triglycerides and the development of hepatic steatosis.27 Moreover, in mice administered a normal diet overexpression of CypD induced hepatic steatosis and hepatic TG accumulation without change in serum level of fatty acids or TG suggesting a direct causal relationship between CypD and NAFLD.14,27 In contrast, CypD deletion decreased or totally prevented steatosis and weight gain in mice following a high fat diet.26–28
Liver fibrosis invariably results from persistent hepatocyte injury and inflammation, and halting fibrosis is a major target in treating nonalcoholic steatohepatitis (NASH). CypD was found to play a principle role in the fibrotic process in multiple parenchymal organs such as kidney, lung, and heart.13,29 We observed that CypD levels were significantly increased in NAFLD patients with hepatic fibrosis as defined by FIB-4 than those without fibrosis. Moreover, we found significant positive correlation between serum level CypD and NFS and APRI in patients with NAFLD.
A number of studies investigated the relation between CypD and liver fibrosis.30–32 Suppression both of CypD-induced mitochondrial permeability transition and CypA and B-associated inflammatory events inhibited the development of cirrhosis in animal models of liver fibrosis.30 Another study found that inhibition of CypB and D reduced collagen type III and attenuated liver fibrosis in a CCl4-induced rat liver fibrosis model.31 Furthermore, CRV431 which is a nonselective cyclophilin—A, B, D, and G inhibitor decreased liver fibrosis in a mouse model of NASH.32
Although there are many good noninvasive tools to assess fibrosis in patients with NAFLD, continued research is needed to identify more markers that evaluate the different molecular mechanisms involved in liver fibrosis. In the present study, serum CypD was a significant marker in identifying patients with higher fibrosis scores with CypD level more than 14.05 (ng/mL) had 75% sensitivity and 81.1% specificity in prediction of hepatic fibrosis. Although, we found serum CypD was a more specific predictor of liver fibrosis than APRI, serum CypD was less sensitive than APRI and NFS.
In our study although serum CypD levels were higher in patients with diabetes than the healthy control group, we failed to demonstrate a significant correlation between CypD and blood glucose. Moreover, the relation of CypD and NAFLD and fibrosis scores was independent from blood glucose, lipid and BMI. Previous studies showed that CypD levels are elevated in animal models of obesity and metabolic syndrome and reduce when the disease is reversed.13,14,33 Similar to our results, a recent study of patients with coronary artery disease found no correlation between serum CypD and blood glucose, cholesterol, or TG.25 Recent study showed that CypD promotes nonglucose-stimulated insulin secretion, but not glucose-stimulated insulin secretion, through enhancing mitochondrial proton leak which could explain the absence of significant correlation between Hba1c and CypD in our study.34 Another study reported a significant correlation between the serum CypA and blood glucose levels, but there was no significant correlation with other metabolic parameters in patients with NAFLD.26 Furthermore, CypD has a tissue-specific effect in the metabolic homeostasis that the liver mitochondria are more dependent on CypD for mPTP opening than skeletal muscle mitochondria.12 The data in this study could point to a direct effect of CypD in the development of liver steatosis and fibrosis irrespective of change of systemic metabolism.
Some limitations can be discussed in the present study. First, ultrasound was used to identify patients with NAFLD which is an operator-dependent technique. However, we used previously validated diagnostic criteria and the examination was performed by one sonographer. In addition, we calculated FLI for all patients. Second, noninvasive scores were used to define patients with fibrosis. Although liver biopsy is the most accurate method in diagnosis of NAFLD and liver fibrosis; it is an invasive technique with possible serious complications. Other noninvasive imaging techniques that measure liver stiffness such as elastography could not be used because of the cost. Nevertheless, we calculated multiple fibrosis scores that correlate well with the results of liver biopsy. Third, CypD primarily exerts its action at mitochondrial level and there is no data about the serum levels of CypD as a surrogate of hepatic expression. However, CypD can be measured in serum and we found a significant difference in serum levels of CypD in healthy subjects and patients with and without NAFLD. Fourth, the relatively small number of the studied population; a larger study is needed to confirm the results.
Conclusion
This was the first study that assessed the serum CypD in diabetic patients with NAFLD and we found that serum CypD levels were higher in diabetic patients with NAFLD than those without NAFLD. In addition, CypD was a highly sensitive predictor of NAFLD. Furthermore, CypD had significant correlation with different fibrosis scores in diabetic patients with NAFLD irrespective of the other metabolic parameters. Consequently, CypD can be used as a noninvasive marker for diagnosis and assessing the severity of NAFLD. Also, CypD may serve as a potential novel therapeutic strategy for NAFLD, and CypD inhibitors could decrease liver fibrosis in patients with NAFLD.
Acknowledgment
All authors acknowledge their gratitude to the staff members of diabetes and endocrine clinic for their help and support.
Funding
The authors received no specific funding for this work.
Disclosure
The authors report no conflicts of interest in this work.
References
1. Mitra S, De A, Chowdhury A. Epidemiology of non-alcoholic and alcoholic fatty liver diseases. Transl Gastroenterol Hepatol. 2020;5:16. doi:10.21037/tgh.2019.09.08
2. Buzzetti E, Pinzani M, Tsochatzis EA. The multiple-hit pathogenesis of non-alcoholic fatty liver disease (NAFLD). Metabolism. 2016;65(8):1038–1048. doi:10.1016/j.metabol.2015.12.012
3. Pappachan JM, Babu S, Krishnan B, Ravindran NC. Non-alcoholic fatty liver disease: a clinical update. J Clin Transl Hepatol. 2017;5(4):384–393. doi:10.14218/JCTH.2017.00013
4. Bataller R, Rombouts K, Altamirano J, Marra F. Fibrosis in alcoholic and nonalcoholic steatohepatitis. Best Pract Res Clin Gastroenterol. 2011;25(2):231–244. doi:10.1016/j.bpg.2011.02.010
5. Parthasarathy G, Revelo X, Malhi H. Pathogenesis of nonalcoholic steatohepatitis: an overview. Hepatol Commun. 2020;4(4):478–492. doi:10.1002/hep4.1479 PMID: 32258944; PMCID: PMC7109346.
6. Haas JT, Francque S, Staels B. Pathophysiology and mechanisms of nonalcoholic fatty liver disease. Annu Rev Physiol. 2016;78(1):181–205. PMID: 26667070. doi:10.1146/annurev-physiol-021115-105331
7. Rieusset J, Fauconnier J, Paillard M, et al. Disruption of calcium transfer from ER to mitochondria links alterations of mitochondria-associated ER membrane integrity to hepatic insulin resistance. Diabetologia. 2016;59(3):614–623. PMID: 26660890. doi: 10.1007/s00125-015-3829-8
8. Mansouri A, Gattolliat CH, Asselah T. Mitochondrial dysfunction and signaling in chronic liver diseases. Gastroenterology. 2018;155(3):629–647. PMID: 30012333. doi:10.1053/j.gastro.2018.06.083
9. Zorov DB, Juhaszova M, Yaniv Y, Nuss HB, Wang S, Sollott SJ. Regulation and pharmacology of the mitochondrial permeability transition pore. Cardiovasc Res. 2009;83(2):213–225. PMID: 19447775; PMCID: PMC2701724. doi:10.1093/cvr/cvp151
10. Giorgi C, Agnoletto C, Bononi A, et al. Mitochondrial calcium homeostasis as potential target for mitochondrial medicine. Mitochondrion. 2012;12(1):77–85. PMID: 21798374; PMCID: PMC3281195. doi: 10.1016/j.mito.2011.07.004
11. Wacquier B, Combettes L, Dupont G. Dual dynamics of mitochondrial permeability transition pore opening. Sci Rep. 2020;10(1):3924. PMID: 32127570; PMCID: PMC7054270. doi:10.1038/s41598-020-60177-1.
12. Laker RC, Taddeo EP, Akhtar YN, Zhang M, Hoehn KL, Yan Z. The mitochondrial permeability transition pore regulator cyclophilin D exhibits tissue-specific control of metabolic homeostasis. PLoS One. 2016;11(12):e0167910. doi:10.1371/journal.pone.0167910
13. Porter GA
14. Wang X, Du H, Shao S, et al. Cyclophilin D deficiency attenuates mitochondrial perturbation and ameliorates hepatic steatosis. Hepatology. 2018;68(1):62–77. doi:10.1002/hep.29788
15. American Diabetes Association. Diagnosis and classification of diabetes mellitus. Diabetes Care. 2010;33 Suppl 1(Suppl 1):S62–S69. doi:10.2337/dc10-S062.
16. Palmentieri B, de Sio I, La Mura V, et al. The role of bright liver echo pattern on ultrasound B-mode examination in the diagnosis of liver steatosis. Dig Liver Dis. 2006;38(7):485–489. doi:10.1016/j.dld.2006.03.021
17. Bedogni G, Bellentani S, Miglioli L, et al. The fatty liver index: a simple and accurate predictor of hepatic steatosis in the general population. BMC Gastroenterol. 2006;6(1):33. doi:10.1186/1471-230X-6-33
18. Sun W, Cui H, Li N, et al. Comparison of FIB-4 index, NAFLD fibrosis score and BARD score for prediction of advanced fibrosis in adult patients with non-alcoholic fatty liver disease: a meta-analysis study. Hepatol Res. 2016;46(9):862–870. doi:10.1111/hepr.12647
19. Wai CT, Greenson JK, Fontana RJ, et al. A simple noninvasive index can predict both significant fibrosis and cirrhosis in patients with chronic hepatitis C. Hepatology. 2003;38(2):518–526. doi:10.1053/jhep.2003.50346
20. Angulo P, Hui JM, Marchesini G, et al. The NAFLD fibrosis score: a noninvasive system that identifies liver fibrosis in patients with NAFLD. Hepatology. 2007;45(4):846–854. doi:10.1002/hep.21496
21. Naoumov NV. Cyclophilin inhibition as potential therapy for liver diseases. J Hepatol. 2014;61(5):1166–1174. doi:10.1016/j.jhep.2014.07.00
22. Zhou H, Zhu P, Wang J, Toan S, Ren J. DNA-PKcs promotes alcohol-related liver disease by activating Drp1-related mitochondrial fission and repressing FUNDC1-required mitophagy. Signal Transduct Target Ther. 2019;4(1):56. doi:10.1038/s41392-019-0094-1
23. Gao A, Jiang J, Xie F, Chen L. Bnip3 in mitophagy: novel insights and potential therapeutic target for diseases of secondary mitochondrial dysfunction. Clin Chim Acta. 2020;506:72–83. doi:10.1016/j.cca.2020.02.024
24. Tavecchio M, Lisanti S, Bennett MJ, Languino LR, Altieri DC. Deletion of cyclophilin D impairs β-oxidation and promotes glucose metabolism. Sci Rep. 2015;5(1):15981. PMID: 26515038; PMCID: PMC4626838. doi:10.1038/srep15981
25. Alfonso A, Bayón J, Gegunde S, et al. High Serum cyclophilin C levels as a risk factor marker for coronary artery disease. Sci Rep. 2019;9(1):10576. doi:10.1038/s41598-019-46988-x
26. Mutlu HH, Caklili OT, Coskunpinar E. Serum concentrations of cyclophilin A in patients with nonalcoholic fatty liver disease. Acta Gastroenterol Belg. 2017;80(1):3–7.
27. Su X, Lin D, Luo D, et al. Cyclophilin D participates in the inhibitory effect of high-fat diet on the expression of steroidogenic acute regulatory protein. J Cell Mol Med. 2019;23(10):6859–6871. PMID: 31373170; PMCID: PMC6787510. doi: 10.1111/jcmm.14569
28. Tubbs E, Theurey P, Vial G, et al. Mitochondria-associated endoplasmic reticulum membrane (MAM) integrity is required for insulin signaling and is implicated in hepatic insulin resistance. Diabetes. 2014;63(10):3279–3294. PMID: 24947355. doi: 10.2337/db13-1751
29. Hou W, Leong KG, Ozols E, Tesch GH, Nikolic-Paterson DJ, Ma FY. Cyclophilin D promotes tubular cell damage and the development of interstitial fibrosis in the obstructed kidney. Clin Exp Pharmacol Physiol. 2018;45(3):250–260. PMID: 29230844. doi:10.1111/1440-1681.12881
30. Ure DR, Trepanier DJ, Mayo PR, Foster RT. Cyclophilin inhibition as a potential treatment for nonalcoholic steatohepatitis (NASH). Expert Opin Investig Drugs. 2020;29(2):163–178. PMID: 31868526. doi:10.1080/13543784.2020.1703948
31. Wang H, Zhang Y, Wang T, You H, Jia J. N-methyl-4-isoleucine cyclosporine attenuates CCl -induced liver fibrosis in rats by interacting with cyclophilin B and D. J Gastroenterol Hepatol. 2011;26(3):558–567. PMID: 21332552. doi:10.1111/j.1440-1746.2010.06406.x
32. Kuo J, Bobardt M, Chatterji U, et al. A pan-cyclophilin inhibitor, CRV431, decreases fibrosis and tumor development in chronic liver disease models. J Pharmacol Exp Ther. 2019;371(2):231–241. PMID: 31406003; PMCID: PMC6815936. doi: 10.1124/jpet.119.261099
33. Jiang M, Wang C, Meng Q, et al. Cyclosporin A attenuates weight gain and improves glucose tolerance in diet-induced obese mice. Mol Cell Endocrinol. 2013;370(1–2):96–102. PMID: 23499865. doi: 10.1016/j.mce.2013.02.018
34. Taddeo EP, Alsabeeh N, Baghdasarian S, et al. Mitochondrial proton leak regulated by cyclophilin D elevates insulin secretion in islets at nonstimulatory glucose levels. Diabetes. 2020;69(2):131–145. doi:10.2337/db19-0379
 © 2021 The Author(s). This work is published and licensed by Dove Medical Press Limited. The
full terms of this license are available at https://www.dovepress.com/terms
and incorporate the Creative Commons Attribution
- Non Commercial (unported, 3.0) License.
By accessing the work you hereby accept the Terms. Non-commercial uses of the work are permitted
without any further permission from Dove Medical Press Limited, provided the work is properly
attributed. For permission for commercial use of this work, please see paragraphs 4.2 and 5 of our Terms.
© 2021 The Author(s). This work is published and licensed by Dove Medical Press Limited. The
full terms of this license are available at https://www.dovepress.com/terms
and incorporate the Creative Commons Attribution
- Non Commercial (unported, 3.0) License.
By accessing the work you hereby accept the Terms. Non-commercial uses of the work are permitted
without any further permission from Dove Medical Press Limited, provided the work is properly
attributed. For permission for commercial use of this work, please see paragraphs 4.2 and 5 of our Terms.