Back to Journals » Neuropsychiatric Disease and Treatment » Volume 14
Elevated peripheral blood glutamate levels in major depressive disorder
Authors Inoshita M, Umehara H ![]() , Watanabe S, Nakataki M
, Watanabe S, Nakataki M ![]() , Kinoshita M, Tomioka Y, Tajima A
, Kinoshita M, Tomioka Y, Tajima A ![]() , Numata S, Ohmori T
, Numata S, Ohmori T ![]()
Received 14 December 2017
Accepted for publication 16 February 2018
Published 6 April 2018 Volume 2018:14 Pages 945—953
DOI https://doi.org/10.2147/NDT.S159855
Checked for plagiarism Yes
Review by Single anonymous peer review
Peer reviewer comments 2
Editor who approved publication: Professor Taro Kishi
Masatoshi Inoshita,1 Hidehiro Umehara,1 Shin-ya Watanabe,1 Masahito Nakataki,1 Makoto Kinoshita,1 Yukiko Tomioka,1 Atsushi Tajima,2 Shusuke Numata,1 Tetsuro Ohmori1
1Department of Psychiatry, Graduate School of Biomedical Sciences, Tokushima University, Tokushima, Japan; 2Department of Bioinformatics and Genomics, Graduate School of Advanced Preventive Medical Sciences, Kanazawa University, Ishikawa, Japan
Purpose: There is growing evidence that glutamatergic signaling may be involved in major depressive disorder (MDD). In regard to peripheral blood glutamate changes in MDD, inconsistent findings have been reported. The purpose of the present study was to evaluate whether blood glutamate levels differed between MDD patients and control participants.
Materials and methods: We conducted a systematic review and meta-analysis of 12 association studies between blood glutamate levels and MDD in a total of 529 MDD patients and 590 controls. Subsequently, we conducted subgroup analyses and a meta-regression analysis to examine the sources of potential heterogeneity.
Results: A random effects model showed that blood glutamate levels were significantly higher in MDD patients than in controls (standardized mean difference=0.54, 95% CI=0.27–0.82, p=8.5×10⁻⁵) with high heterogeneity (I2=75.0%, p<0.05). Subgroup analyses showed elevated glutamate levels in MDD patients compared with controls in plasma, but not serum studies, and in studies using high-performance liquid chromatography but not with mass spectrometry for glutamate assay. A meta-regression analysis showed no effects of age, gender, medication use, sample size, and published year on blood glutamate levels.
Conclusion: Our findings suggest that altered glutamate levels may be implicated in MDD, which provides further evidence of glutamatergic dysfunction in MDD.
Keywords: glutamate, major depressive disorder, blood, association study, meta-analysis
Introduction
Major depressive disorder (MDD) is a common neuropsychiatric disorder with high prevalence.1 Several pathophysiological mechanisms have been proposed to underlie this disorder, such as altered monoamines, increased inflammation, and abnormalities of the hypothalamic–pituitary–adrenal axis.2,3
There is growing evidence that glutamatergic signaling may be involved in the pathophysiology of MDD.4–6 Dysregulation between the main excitatory glutamatergic and inhibitory gamma-aminobutyric acid-ergic neurotransmission results in cellular damage called “excitotoxicity,” and this phenomenon is thought to be the cause of MDD.7 Glutamate is one of the major excitatory amino acid neurotransmitters. It plays a major role in brain development, affecting neuronal migration, neuronal differentiation, axon genesis, and neuronal survival.5 Under normal conditions, glutamate has a prominent role in synaptic plasticity, learning, and memory, while it is also known to be a potent neuronal excitotoxin, triggering either rapid or delayed neurotoxicity in pathological conditions.4 Further, glutamate neurotoxicity results from excessive flux of Ca2 via ionotropic receptors, and uncontrolled elevation of intracellular Ca2 leads to a cascade of events that contribute to cell damage and death.8 Glutamate may also play an important role in the treatment of MDD.9,10 For example, a significant decrease in blood glutamate levels has been observed in MDD after treatment with antidepressants.11,12 In a recent meta-analysis of 6 randomized, double-blind, and placebo-controlled trials of ketamine, an N-methyl-D-aspartate glutamate receptor antagonist, a rapid antidepressant action of ketamine was observed for MDD during 1 week period.13 Moreover, a number of studies have shown antidepressant-like effects of glutamatergic agents on behavioral models of MDD.10
Recently, we demonstrated elevated plasma glutamate levels in individuals with MDD, using capillary electrophoresis-time-of-flight mass spectrometry.14 However, with regard to peripheral blood glutamate levels in MDD, inconsistent findings have been reported. Although some clinical studies have shown elevated plasma or serum levels of glutamate in MDD,11,14–19 others did not observe any differences between MDD patients and control subjects.12,20–24 Besides, it is still unclear whether peripheral blood glutamate levels can reflect brain glutamate levels, since inconsistent findings of central and peripheral glutamate levels in MDD have been reported. A previous postmortem brain study reported increased levels of glutamate in the frontal cortex of patients with MDD.25 One previous study demonstrated increased levels of glutamate in the occipital cortex in MDD by using proton magnetic resonance spectroscopy,26 while a recent meta-analysis of proton magnetic resonance spectroscopy studies showed no change in glutamate levels in the prefrontal cortex in MDD along with decreased levels of glutamate and glutamine combined.27 Another study demonstrated increased levels of glutamate in the cerebrospinal fluid in depressed patients,28 whereas other studies have reported decreased levels or no significant differences.29–31
In this study, we conducted a systematic review and meta-analysis of association studies to evaluate whether peripheral blood glutamate levels differed between MDD patients and controls.
Materials and methods
Study selection process for a meta-analysis
Eligible studies were identified in September 2017 with PubMed and Scopus databases, using the keywords (“Major depressive disorder” OR “depression” OR “depressive disorder”) AND (“glutamate” OR “glutamic acid”) AND (“serum” OR “plasma”). We also conducted an additional manual search of reference lists in the included publications. Studies meeting the following criteria were included for further meta-analysis: 1) studies assessing peripheral blood (serum or plasma) glutamate levels; 2) studies comparing glutamate levels in MDD patients and control subjects; and 3) studies written in English. Three reviewers (Inoshita M, Tomioka Y, and Watanabe SY) selected the articles independently according to the inclusion criteria. The flow chart of the present study’s selection is shown in Figure S1.
Data extraction
The following data were extracted from eligible studies: ethnicity, sample size, gender distribution, mean age, mean glutamate concentrations and SD, unit of measure, blood sampling, glutamate assay, medication use, and diagnostic criteria.
Statistical methods
Statistical analyses were performed with the “metafor” package in R (version 3.2.3). A meta-analysis of association studies was performed on standardized mean differences (SMD) using the data of sample size and mean and SD of glutamate concentration.32,33 When the data were presented as a subgroup, we combined these data into one group and calculated the composite mean using the formula: Composite mean 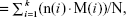 where n(i) was the sample size of ith group, M(i) was the mean of ith group, k was the number of groups, and N was the overall sample size; and composite variance using the formula: Composite variance = (ess+gss)/(N−1), where ess was the overall error sum of squares and gss was the overall group sum of squares. When the data were presented as median and interquartile range, we calculated the mean and SD.34 When the data were presented with standard error (SE) of the mean, we calculated the SD as √n×SE, where n was the sample size. Heterogeneity across studies was quantified with the I2 statistic, with 25%, 50%, and 75% indicating small, moderate, and high levels of heterogeneity, respectively.35 If heterogeneity across studies was found, then an inverse-weight variance random-effects model was applied; otherwise, a fixed-effects model was applied. Publication bias was assessed using a regression test for funnel plot asymmetry.36 The influence of each selected study on the outcome was assessed using a leave-one-out sensitivity analysis.37 Subgroup analyses were performed on the basis of blood sampling (plasma or serum), glutamate assay (high-performance liquid chromatography [HPLC] or mass spectroscopy), medication use, fasting or nonfasting sample, and ethnicity (Asian or non-Asian). Meta-regression analysis was performed to examine the effects of age, gender (% male), medication exposure (% medication-received patients), sample size, and published year.
Results
Meta-analysis
Eleven studies met our inclusion criteria for our meta-analysis12,14,15–22,24 (Figure S1), and the characteristics of these 11 studies are shown in Table 1. Among the 11 studies, 6 studies reported elevated glutamate levels in MDD,14,15–19 and the other 5 studies did not find significant differences in glutamate levels between MDD patients and control subjects.12,20–22,24
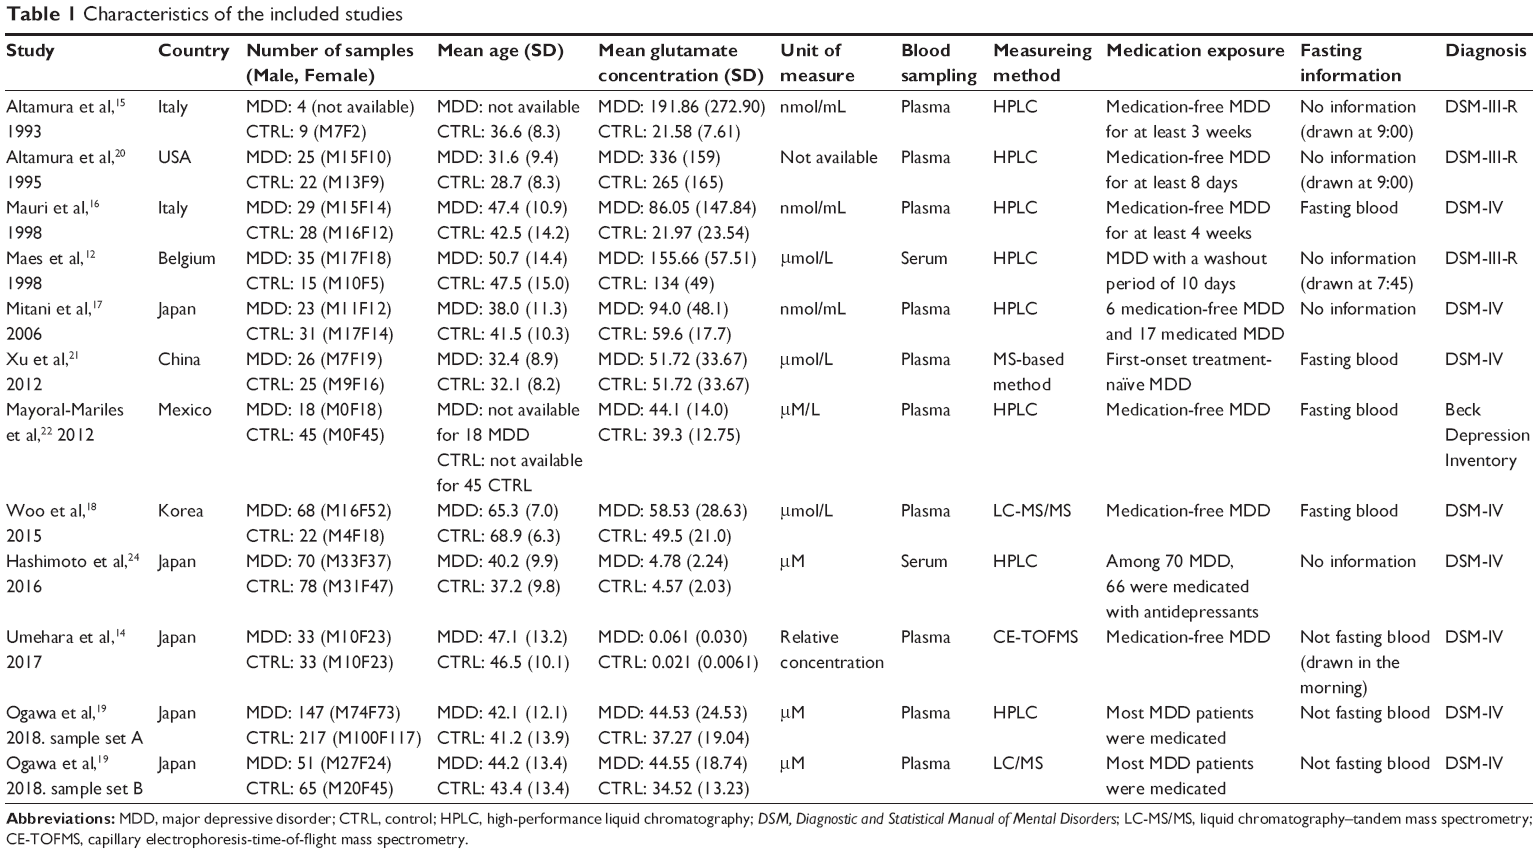 | Table 1 Characteristics of the included studies |
When we conducted a meta-analysis of these 12 association studies between blood glutamate levels and MDD from 11 studies in a total of 529 patients with MDD and 590 control participants, a random effects model showed that blood glutamate levels were significantly higher in patients with MDD than in controls, with high heterogeneity (SMD=0.54, 95% CI=0.27–0.82, p=8.5×10⁻⁵, I2=75.0%, p<0.05, Figure 1). A funnel plot analysis indicated no evidence of publication bias in the association studies (p>0.05, Figure 2). A leave-one-out sensitivity analysis indicated our result was not driven by any single study (p<0.05, Table S1).
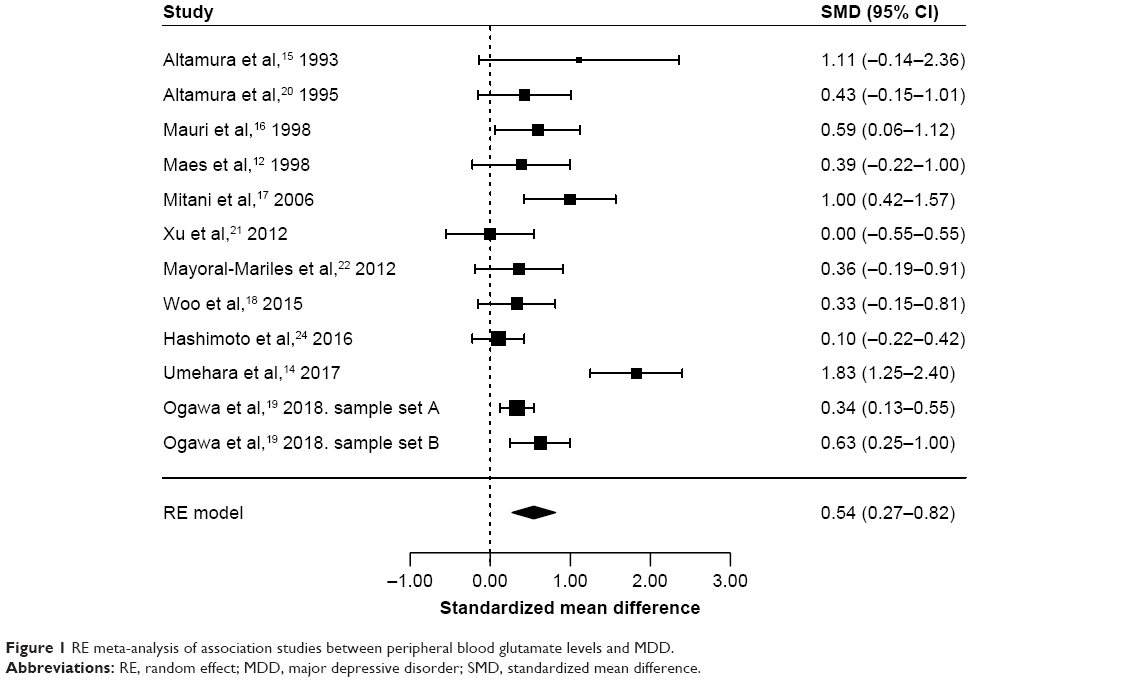 | Figure 1 RE meta-analysis of association studies between peripheral blood glutamate levels and MDD. |
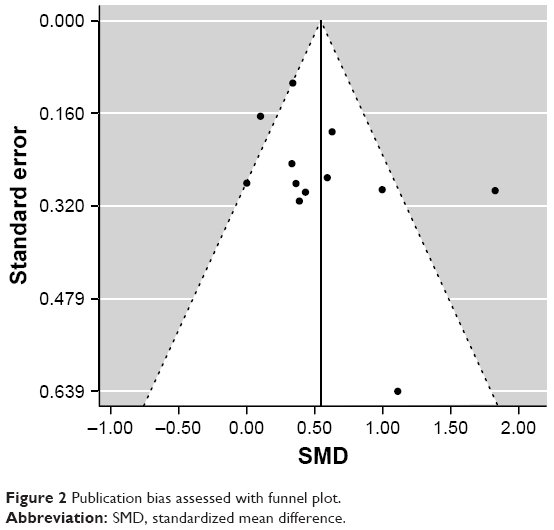 | Figure 2 Publication bias assessed with funnel plot. |
Subgroup analyses
We conducted subgroup analyses according to blood sampling, glutamate assay, medication use, fasting or nonfasting sample, and ethnicity (Table 2). The pooled SMD from 10 plasma14,15–22 and 2 serum studies12,24 was 0.62 (95% CI=0.31–0.93, p=1.0×10⁻⁴, I2=75.9%, p<0.05) and 0.16 (95% CI=−0.12–0.45, p=0.26, I2=0%, p=0.42), respectively. The pooled SMD from 8 studies using HPLC assay12,15–17,19–20,22,24 and 4 studies using MS14,18,19,21 was 0.41 (95% CI=0.22–0.60, p<1.0×10⁻⁴, I2=28.5%, p=0.22) and 0.69 (95% CI=−0.069–1.45, p=0.075, I2=89.7%, p<0.05), respectively. The pooled SMD from 8 studies using medication-free samples12,14–16,18,20–22 was 0.59 (95% CI=0.19–1.00, p=4.0×10⁻³, I2=72.9%, p<0.05). The pooled SMD from 4 studies using fasting samples16,18,21,22 and 3 studies using nonfasting samples14,19 was 0.33 (95% CI=0.063–0.59, p=0.015, I2=0%, p=0.51) and 0.90 (95% CI=0.031–1.77, p=0.042, I2=94.1%, p<0.05), respectively. The pooled SMD from 7 Asian studies14,17–19,21,24 and 5 non-Asian studies12,15,16,20,22 was 0.58 (95% CI=0.14–1.02, p=0.01, I2=88.6%, p<0.05) and 0.48 (95% CI=0.21–0.76, p=6.0×10⁻⁴, I2=0%, p=0.84), respectively.
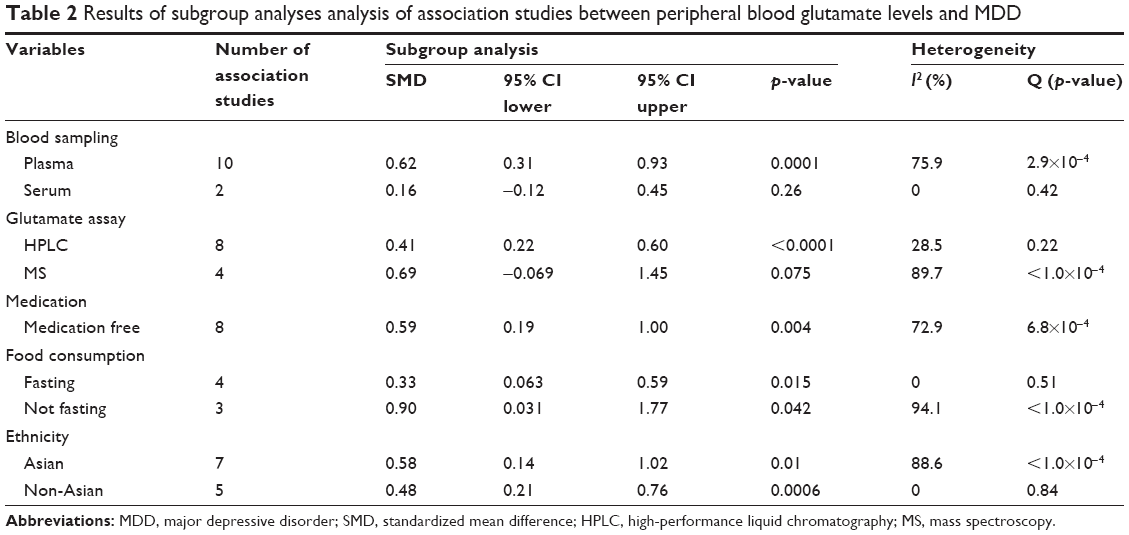 | Table 2 Results of subgroup analyses analysis of association studies between peripheral blood glutamate levels and MDD |
Meta-regression analysis
When we conducted a meta-regression analysis to examine the effects of age, gender, medication use, sample size, and published year on the glutamate levels, we found no effects of these variables on blood glutamate levels (p>0.05) (Table 3).
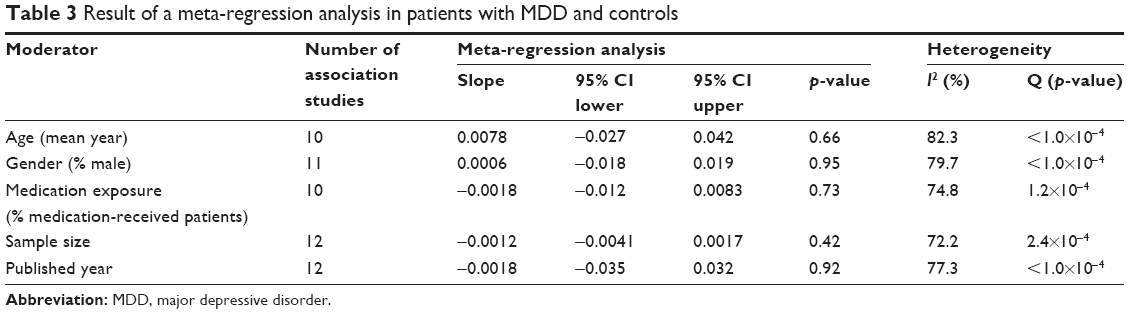 | Table 3 Result of a meta-regression analysis in patients with MDD and controls |
Discussion
This is the first systematic review and meta-analysis of association studies between peripheral blood glutamate levels and MDD, and we demonstrated elevated glutamate levels in MDD in the pooled data set (529 patients with MDD and 590 controls). A high level of heterogeneity was observed in this meta-analysis of all studies (I2=75.0%). To examine the sources of potential heterogeneity, we subsequently conducted subgroup analyses and a meta-regression analysis.
In the subgroup analyses, we classified studies into those that involved the use of glutamate assays (HPLC or mass spectroscopy) and those that involved food consumption (fasting or nonfasting). We also classified studies into groups based on ethnicity (Asian or non-Asian). We revealed significantly elevated glutamate levels in MDD with remarkably reduced levels of heterogeneity when we considered studies that involved only HPLC assays (SMD=0.41 and I2=28.5%), only fasting samples (SMD=0.33 and I2=0%), and only non-Asian samples (SMD=0.48 and I2=0%). These results suggest that the differences of glutamate assay, food consumption, and ethnicity might contribute to the heterogeneity observed in this study. On the other hand, subgroup analysis using studies involving medication-free samples showed significantly elevated glutamate levels in MDD without reduction of heterogeneity level (I2=72.9%). However, these results from our subgroup analyses must be viewed with caution because of the small sample size.
In the meta-regression analysis, we found no significant effects of age, gender, medication exposure, sample size, and publication year on blood glutamate levels in MDD patients. However, a significant decrease in blood glutamate levels has been reported in MDD after treatment with antidepressants.11,12 Besides, a recent study showed significant positive correlations of daily doses of benzodiazepine derivatives and antidepressants with plasma glutamate levels in MDD patients.19 These studies suggest that medications, such as antidepressants and benzodiazepines, may affect blood glutamate levels in MDD patients. In this meta-regression analysis of medication exposure, the sample size was small (only two studies17,24 out of ten used medicated MDD samples), and we were unable to analyze the effect of medication in detail due to insufficient information on drugs used in these included studies. Further studies assessing the effects of medication on blood glutamate levels according to types and dosages of antidepressants will be needed.
Our study has several limitations. First, the sample size was relatively small. Second, there was high heterogeneity among the studies in this meta-analysis. Larger studies with detailed information on participants, such as severity of symptoms, existence of psychosis, types of antidepressants and doses, and metabolic parameters, will be needed to validate our findings and reveal hidden factors that could explain the heterogeneity. Finally, it is still unclear whether peripheral blood glutamate levels can reflect brain levels of glutamate in MDD. Shulman et al38 examined the relation between plasma and medial prefrontal cortical glutamate levels in healthy male volunteers, and they found no correlation between them. However, they measured glutamate levels in the limited brain region, and they assessed glutamate levels of healthy subjects, not patients with MDD. Further studies will be needed to examine this relationship between them.
Conclusion
We conducted a systematic review and meta-analysis of association studies between peripheral blood glutamate levels and MDD, and we demonstrated elevated blood glutamate levels in MDD. Our findings suggest that changes in glutamate levels may be implicated in MDD and provide further support for the glutamatergic dysfunction hypothesis of MDD.
Acknowledgment
This work was supported in part by Japan Agency for Medical Research and Development, AMED (Tetsuro Ohmori), Grant-in-Aid for Scientific Research (C) (No 15K09809) (Shusuke Numata), and Grant-in-Aid for Young Scientists (B) (No 16K19769) (Shin-ya Watanabe).
Author contribution
Shusuke Numata designed the study. Tetsuro Ohmori and Shusuke Numata managed the research. Masatoshi Inoshita, Yukiko Tomioka, and Shin-ya Watanabe collected the data. Makoto Kinoshita, Masahito Nakataki, Atsushi Tajima, and Hidehiro Umehara undertook the statistical analysis. Masatoshi Inoshita, Masahito Nakataki, and Shusuke Numata wrote the draft. All authors contributed toward data analysis, drafting and critically revising the paper and agree to be accountable for all aspects of the work.
Disclosure
The authors report no conflicts of interest in this work.
References
Kessler RC, Berglund P, Demler O, et al. National Comorbidity Survey Replication. The epidemiology of major depressive disorder: results from the National Comorbidity Survey Replication (NCS-R). JAMA. 2003;289(23):3095–3105. | ||
Dean J, Keshavan M. The neurobiology of depression: an integrated view. Asian J Psychiatr. 2017;27:101–111. | ||
Lang UE, Borgwardt S. Molecular mechanisms of depression: perspectives on new treatment strategies. Cell Physiol Biochem. 2013;31(6):761–777. | ||
Sanacora G, Zarate CA, Krystal JH, et al. Targeting the glutamatergic system to develop novel, improved therapeutics for mood disorders. Nat Rev Drug Discov. 2008;7(5):426–437. | ||
Hashimoto K. Emerging role of glutamate in the pathophysiology of major depressive disorder. Brain Res Rev. 2009;61(2):105–123. | ||
Murrough JW, Abdallah CG, Mathew SJ. Targeting glutamate signalling in depression: progress and prospects. Nat Rev Drug Discov. 2017;16(7):472–486. | ||
Mlyniec K. Zinc in the glutamatergic theory of depression. Curr Neuropharmacol. 2015;13(4):505–513. | ||
Duman RS. Neuronal damage and protection in the pathophysiology and treatment of psychiatric illness: stress and depression. Dialogues Clin Neurosci. 2009;11(3):239–255. | ||
Hashimoto K. The role of glutamate on the action of antidepressants. Prog Neuropsychopharmacol Biol Psychiatry. 2011;35(7):1558–1568. | ||
Tokita K, Yamaji T, Hashimoto K. Roles of glutamate signaling in preclinical and/or mechanistic models of depression. Pharmacol Biochem Behav. 2012;100(4):688–704. | ||
Küçükibrahimoğlu E, Saygin MZ, Calişkan M, et al. The change in plasma GABA, glutamine and glutamate levels in fluoxetine- or S-citalopram-treated female patients with major depression. Eur J Clin Pharmacol. 2009;65(6):571–577. | ||
Maes M, Verkerk R, Vandoolaeghe E, et al. Serum levels of excitatory amino acids, serine, glycine, histidine, threonine, taurine, alanine and arginine in treatment-resistant depression: modulation by treatment with antidepressants and prediction of clinical responsivity. Acta Psychiatr Scand. 1998;97(4):302–308. | ||
Romeo B, Choucha W, Fossati P, et al. Meta-analysis of short- and mid-term efficacy of ketamine in unipolar and bipolar depression. Psychiatry Res. 2015;230(2):682–688. | ||
Umehara H, Numata S, Watanabe SY, et al. Altered KYN/TRP, Gln/Glu, and Met/methionine sulfoxide ratios in the blood plasma of medication-free patients with major depressive disorder. Sci Rep. 2017;7(1):4855. | ||
Altamura CA, Mauri MC, Ferrara A, et al. Plasma and platelet excitatory amino acids in psychiatric disorders. Am J Psychiatry. 1993;150(11):1731–1733. | ||
Mauri MC, Ferrara A, Boscati L, et al. Plasma and platelet amino acid concentrations in patients affected by major depression and under fluvoxamine treatment. Neuropsychobiology. 1998;37(3):124–129. | ||
Mitani H, Shirayama Y, Yamada T, et al. Correlation between plasma levels of glutamate, alanine and serine with severity of depression. Prog Neuropsychopharmacol Biol Psychiatry. 2006;30(6):1155–1158. | ||
Woo HI, Chun MR, Yang JS, et al. Plasma amino acid profiling in major depressive disorder treated with selective serotonin reuptake inhibitors. CNS Neurosci Ther. 2015;21(5):417–424. | ||
Ogawa S, Koga N, Hattori K, et al. Plasma amino acid profile in major depressive disorder: analyses in two independent case-control sample sets. J Psychiatr Res. 2018;96:23–32. | ||
Altamura C, Maes M, Dai J, et al. Plasma concentrations of excitatory amino acids, serine, glycine, taurine and histidine in major depression. Eur Neuropsychopharmacol. 1995;(5 Suppl):71–75. | ||
Xu HB, Fang L, Hu ZC, et al. Potential clinical utility of plasma amino acid profiling in the detection of major depressive disorder. Psychiatry Res. 2012;200(2–3):1054–1057. | ||
Mayoral-Mariles A, Cruz-Revilla C, Vega-Manriquez X, et al. Plasma amino acid levels discriminate between control subjects and mildly depressed elderly women. Arch Med Res. 2012;43(5):375–382. | ||
Lu YR, Fu XY, Shi LG, et al. Decreased plasma neuroactive amino acids and increased nitric oxide levels in melancholic major depressive disorder. BMC Psychiatry. 2014;14:123. | ||
Hashimoto K, Yoshida T, Ishikawa M, et al. Increased serum levels of serine enantiomers in patients with depression. Acta Neuropsychiatr. 2016;28(3):173–178. | ||
Hashimoto K, Sawa A, Iyo M. Increased levels of glutamate in brains from patients with mood disorders. Biol Psychiatry. 2007;62(11):1310–1316. | ||
Sanacora G, Gueorguieva R, Epperson CN, et al. Subtype-specific alterations of gamma-aminobutyric acid and glutamate in patients with major depression. Arch Gen Psychiatry. 2004;61(7):705–713. | ||
Arnone D, Mumuni AN, Jauhar S, et al. Indirect evidence of selective glial involvement in glutamate-based mechanisms of mood regulation in depression: meta-analysis of absolute prefrontal neuro-metabolic concentrations. Eur Neuropsychopharmacol. 2015;25(8):1109–1117. | ||
Levine J, Panchalingam K, Rapoport A, et al. Increased cerebrospinal fluid glutamine levels in depressed patients. Biol Psychiatry. 2000;47(7):586–593. | ||
Hashimoto K, Bruno D, Nierenberg J, et al. Abnormality in glutamine-glutamate cycle in the cerebrospinal fluid of cognitively intact elderly individuals with major depressive disorder: a 3-year follow-up study. Transl Psychiatry. 2016;6:e744. | ||
Frye MA, Tsai GE, Huggins T, et al. Low cerebrospinal fluid glutamate and glycine in refractory affective disorder. Biol Psychiatry. 2007;61(10):162–166. | ||
Garakani A, Martinez JM, Yehuda R, et al. Cerebrospinal fluid levels of glutamate and corticotropin releasing hormone in major depression before and after treatment. J Affect Disord. 2013;146(2):262–265. | ||
Nishi A, Numata S, Tajima A, et al. Meta-analyses of blood homocysteine levels for gender and genetic association studies of the MTHFR C677T polymorphism in schizophrenia. Schizophr Bull. 2014;40(5):1154–1163. | ||
Tomioka Y, Numata S, Kinoshita M, et al. Decreased serum pyridoxal levels in schizophrenia: meta-analysis and Mendelian randomization analysis. J Psychiatry Neurosci. 2018;43(2):170053. | ||
Wan X, Wang W, Liu J, et al. Estimating the sample mean and standard deviation from the sample size, median, range and/or interquartile range. BMC Med Res Methodol. 2014;14:135. | ||
Higgins JP, Thompson SG, Deeks JJ, et al. Measuring inconsistency in meta-analyses. BMJ. 2003;327(7414):557–560. | ||
Egger M, Davey Smith G, Schneider M, et al. Bias in meta-analysis detected by a simple, graphical test. BMJ. 1997;315(7109):629–634. | ||
Patsopoulos NA, Evangelou E, Ioannidis JP. Sensitivity of between-study heterogeneity in meta-analysis: proposed metrics and empirical evaluation. Int J Epidemiol. 2008;37(5):1148–1157. | ||
Shulman Y, Grant S, Seres P, et al. The relation between peripheral and central glutamate and glutamine in healthy male volunteers. J Psychiatry Neurosci. 2006;31(6):406–410. |
Supplementary materials
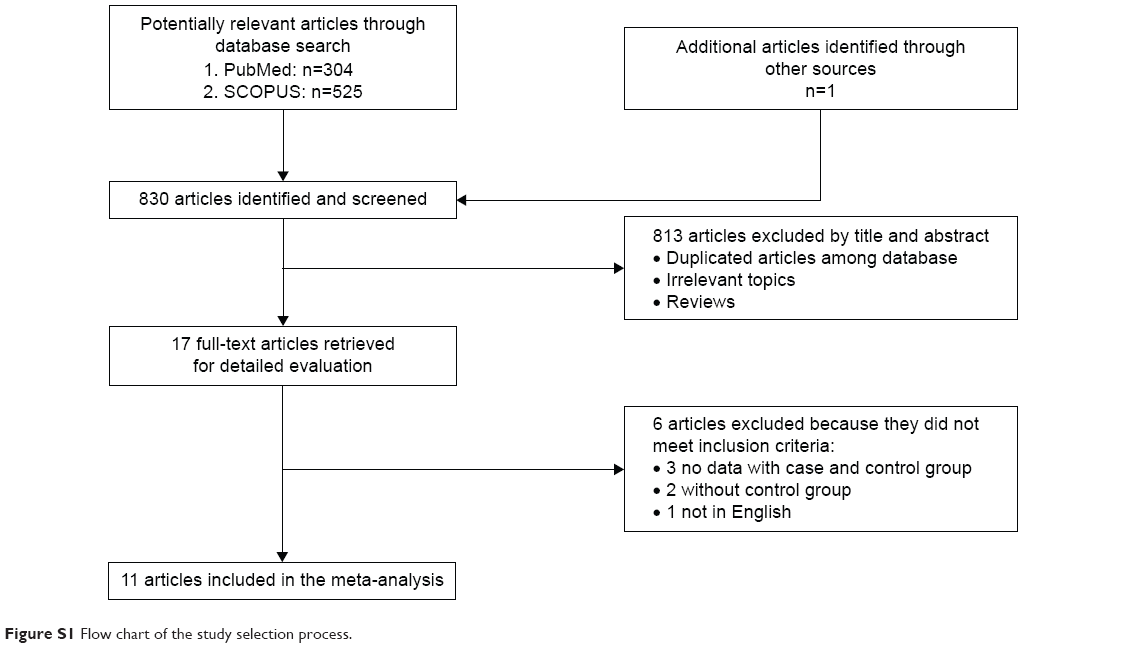 | Figure S1 Flow chart of the study selection process. |
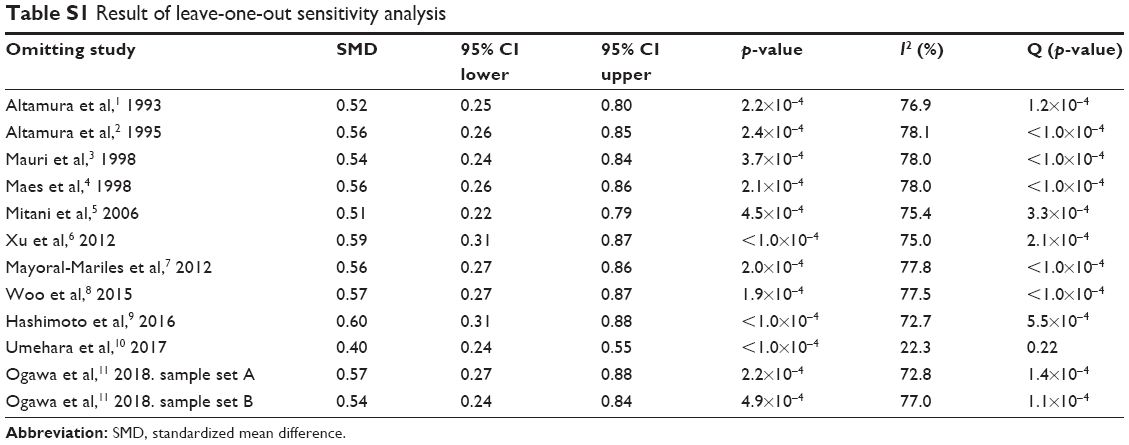 | Table S1 Result of leave-one-out sensitivity analysis |
References
Altamura CA, Mauri MC, Ferrara A, et al. Plasma and platelet excitatory amino acids in psychiatric disorders. Am J Psychiatry. 1993;150(11):1731–1733. | ||
Altamura C, Maes M, Dai J, et al. Plasma concentrations of excitatory amino acids, serine, glycine, taurine and histidine in major depression. Eur Neuropsychopharmacol. 1995;(5 Suppl):71–75. | ||
Mauri MC, Ferrara A, Boscati L, et al. Plasma and platelet amino acid concentrations in patients affected by major depression and under fluvoxamine treatment. Neuropsychobiology. 1998;37(3):124–129. | ||
Maes M, Verkerk R, Vandoolaeghe E, et al. Serum levels of excitatory amino acids, serine, glycine, histidine, threonine, taurine, alanine and arginine in treatment-resistant depression: modulation by treatment with antidepressants and prediction of clinical responsivity. Acta Psychiatr Scand. 1998;97(4):302–308. | ||
Mitani H, Shirayama Y, Yamada T, et al. Correlation between plasma levels of glutamate, alanine and serine with severity of depression. Prog Neuropsychopharmacol Biol Psychiatry. 2006;30(6):1155–1158. | ||
Xu HB, Fang L, Hu ZC, et al. Potential clinical utility of plasma amino acid profiling in the detection of major depressive disorder. Psychiatry Res. 2012;200(2–3):1054–1057. | ||
Mayoral-Mariles A, Cruz-Revilla C, Vega-Manriquez X, et al. Plasma amino acid levels discriminate between control subjects and mildly depressed elderly women. Arch Med Res. 2012;43(5):375–382. | ||
Woo HI, Chun MR, Yang JS, et al. Plasma amino acid profiling in major depressive disorder treated with selective serotonin reuptake inhibitors. CNS Neurosci Ther. 2015;21(5):417–424. | ||
Hashimoto K, Yoshida T, Ishikawa M, et al. Increased serum levels of serine enantiomers in patients with depression. Acta Neuropsychiatr. 2016;28(3):173–178. | ||
Umehara H, Numata S, Watanabe SY, et al. Altered KYN/TRP, Gln/Glu, and Met/methionine sulfoxide ratios in the blood plasma of medication-free patients with major depressive disorder. Sci Rep. 2017;7(1):4855. | ||
Ogawa S, Koga N, Hattori K, et al. Plasma amino acid profile in major depressive disorder: analyses in two independent case-control sample sets. J Psychiatr Res. 2018;96:23–32. |
 © 2018 The Author(s). This work is published and licensed by Dove Medical Press Limited. The
full terms of this license are available at https://www.dovepress.com/terms
and incorporate the Creative Commons Attribution
- Non Commercial (unported, 3.0) License.
By accessing the work you hereby accept the Terms. Non-commercial uses of the work are permitted
without any further permission from Dove Medical Press Limited, provided the work is properly
attributed. For permission for commercial use of this work, please see paragraphs 4.2 and 5 of our Terms.
© 2018 The Author(s). This work is published and licensed by Dove Medical Press Limited. The
full terms of this license are available at https://www.dovepress.com/terms
and incorporate the Creative Commons Attribution
- Non Commercial (unported, 3.0) License.
By accessing the work you hereby accept the Terms. Non-commercial uses of the work are permitted
without any further permission from Dove Medical Press Limited, provided the work is properly
attributed. For permission for commercial use of this work, please see paragraphs 4.2 and 5 of our Terms.