Back to Journals » Psychology Research and Behavior Management » Volume 14
Electroencephalographic Theta-Band Oscillatory Dynamics Represent Attentional Bias to Subjective Preferences in Value-Based Decisions
Authors Diao L ![]() , Li W, Zhang W
, Li W, Zhang W ![]() , Ma Q, Jin J
, Ma Q, Jin J ![]()
Received 20 November 2020
Accepted for publication 14 January 2021
Published 15 February 2021 Volume 2021:14 Pages 149—158
DOI https://doi.org/10.2147/PRBM.S292172
Checked for plagiarism Yes
Review by Single anonymous peer review
Peer reviewer comments 2
Editor who approved publication: Professor Mei-Chun Cheung
Liuting Diao,1,2 Wenping Li,3 Wuke Zhang,1,2 Qingguo Ma,1,2,4 Jia Jin5
1Business School, Ningbo University, Ningbo, People’s Republic of China; 2Academy of Neuroeconomics and Neuromanagement, Ningbo University, Ningbo, People’s Republic of China; 3Prudence College, Zhejiang Business Technology Institute, Ningbo, People’s Republic of China; 4School of Management, Zhejiang University, Hangzhou, People’s Republic of China; 5School of Business and Management, Shanghai International Studies University, Shanghai, People’s Republic of China
Correspondence: Qingguo Ma; Jia Jin Email [email protected]; [email protected]
Background: Previous studies have shown that people always pay more attention to highly preferred items of choice, which is well defined by behavioral measurements and eye-tracking. However, less is known about the neural dynamics underlying the role that visual attention plays in value-based decisions, especially in those characterized by the “relative value” (ie, value difference) between two items displayed simultaneously in a binary choice.
Purpose: This study examined the neural temporal and neural oscillatory features underlying selective attention to subjective preferences in value-based decision making.
Methods: In this study, we recorded electroencephalography (EEG) measurements while participants performed a binary choice task in which they were instructed to respond to their preferred snack in high value difference (HVD) or low value difference (LVD) conditions.
Results: Behaviorally, participants showed faster responses and lower error rates in the HVD condition than in the LVD condition. In parallel, participants exerted a reduced prefrontal N2 component and attenuated frontal theta-band synchronization in the HVD condition as opposed to the LVD condition. Crucially, participants showed greater N2pc component and theta-band synchronization over the human posterior cortex in the HVD condition than in the LVD condition. Moreover, there was a direct correlation between frontal and posterior theta-band synchronization.
Conclusion: The results show that theta-band oscillatory dynamics may represent attentional bias to subjective preferences, and this effect can be modulated by the level attentional bias to subjective preferences, and this effect can be modulated by the level of value difference. Our research provides insights into a new avenue via which the processing of selective attention and value representation in the value-based decisions can be implicated in an integrative neural oscillatory mechanism.
Keywords: theta-band synchronization, attentional bias, subjective preferences, value-based decision making, consumer neuroscience
Introduction
There is a growing consensus in the research on decision making that committing a purchasing decision is generally based on personal preferences, especially in circumstances where many consumer goods are displayed simultaneously. For example, when ordering a cake at a cake shop, one needs to choose his or her favorite taste from a series of options. Previous studies using the drift-diffusion model have posited that in this process, all options are characterized by a subjective evaluation of “economics value” computationally and experimentally, and an internal decision boundary is finally reached via evidence accumulation.1,2 The process of assigning subjective value to all options according to subjective preferences is considered the key input for deliberating value-based decisions.3–5 Recently, electroencephalographic (EEG) studies have suggested that the neural dynamics of subjective value processes can be indicated by a negative-going event-related potential (ERP) component over the human frontal cortex occurring 200–300 ms after the onset of the target (ie, the N200 component), which can be modulated by subjective preferences during purchasing decisions.6–8 For instance, in a virtual shopping task, Goto and colleagues7 observed that the frontal N200 component was induced by the presentation of consumer goods and participants elicited reduced N200 component for the goods they preferred more. This suggests that the frontal N200 component is an effective neural marker that mirrors the subjective preferences of candidates. Moreover, functional magnetic resonance imaging (fMRI) studies have shown that the resources of subjective value processes mainly involve the ventromedial prefrontal cortex (vmPFC) and ventral striatum (vStr), which are known to be closely related to reward processing and value representation.9–12
However, increasing evidence has proposed that purchasing decision processes are more sophisticated and always require selective attention in daily life.1,2,10 Consider, for instance, a typical customer needs to choose between two flavors of cakes at the same cake shop. When one flavor is what he or she likes, and the other is not, the individual’s attention may be consistently captured by the more attractive cake throughout the purchasing process. In contrast, when he or she likes or dislikes both flavors, the individual’s gaze may shift repeatedly between the candidates until one of them is selected.10 Thus, it has been suggested that selective attention toward goal-relevant information plays an important role in value-based decisions.3,11 Previous studies on consumer purchasing decisions supporting this notion have held that consumer products drawing great attention are more likely to be chosen within a choice-set,13,14 while consumers are likely to allocate more selective attention to these preferred items, which increases the likelihood of their purchasing choice.7 However, the neural dynamics underlying selective attention in value-based decisions remain an open question.
Previous electrophysiological studies on selective attention have developed a set of visual attention tasks (eg, visual search task, dot-probe task, and two-alternative-choice task) to investigate the neural basis of selective attention in emotional process and reward pursuit and shown that goal-relevant stimuli (eg, life-threatening stimuli, such as spiders and angry faces, or rewarding stimuli, such as money and soft drinks) always trigger a negative-going ERP component over the human posterior contralateral regions occurring 200–300 ms after the onset of target, which is referred to as the “N2pc component”.15–17 This demonstrates that the N2pc component may generally represent an attention bias to more salient and valuable goals in the human visual space, which may play an important role in value-based decision making.
However, it is noteworthy that the aforementioned ERP components (eg, the frontal N200 component, which is associated with subjective value representation, and the posterior N2pc component, which is associated with selective attention) underlying decision making are significantly distinct in terms of spatial-temporal characteristics, earlier studies have attempted to separately interpret their underlying mental processes, in spite of their interaction in human decision making. There is still a lack of an integrative mechanism via which different mental processes associated with decision making can be well detected and interpreted. The good news is that unraveling the neural oscillatory features may be one of the best candidates to reconcile different mental processes related to value-based decision making.18 Compared to traditional ERP components (a type of evoked cortical response that is characterized by phase-locked to the stimulus), the neural oscillatory features (also called “event-related oscillation [ERO]” a type of induced cortical response that is characterized by non-phase-locked to the stimulus) have been widely thought to reveal more abundant and exact information about neural activity patterns associated with attentional, emotional, motivational, and cognitive processes.19–21 Notably, several previous studies have shown that both the neural oscillatory features underlying subjective value representation and selective bias are related to theta-band oscillation synchronization (4–8 Hz).6,22,23 For instance, in a purchasing task, Telpaz et al6 observed that the frontal N200 component as well as the frontal theta-band power were associated with human preferences for consumer goods and could predict the subsequent consumer good choices. Additionally, several previous studies have established that theta-band synchronization has been implicated in the selective attention process, as indicated by increased posterior theta-band power occurring contralaterally to the hemifield of the target position, and this effect was modulated by the extent of stimulus prominence,24 subjective preferences,22 and valence of emotional faces.23 More importantly, it has been stated that information from distinct regions (eg, frontal and posterior regions) in the human brain can communicate and interact with each other through theta-band synchronization.18,25 The specific functions of theta-band synchronization in human brain activity may provide an opportunity to establish an integrative mechanism to consolidate different mental processes in value-based decision making.
In this study, we adopted a binary choice task in which participants had to choose the preferred snack while their EEG signals were recorded. All EEG data were entered into ERP and time-frequency analysis to illustrate the neural temporal and neural oscillatory dynamics of attention-dependent subject value assessment in decision making. Building on the aforementioned evidence, we hypothesized that theta-band synchronization may represent human attentional bias toward subjective preferences in value-based decisions. Specifically, we hypothesized that the frontal N200 component and frontal theta-band synchronization could be modulated by subjective preferences. Next, we hypothesized that the N2pc component and posterior theta-band synchronization associated with selective attention could be determined by subjective preferences. Finally, we hypothesized that frontal theta-band synchronization is correlated with posterior theta-band synchronization.
Methods
Participants
Twenty-four normal weight (mean BMI = 20.37, SD = 2.13) undergraduate students at Ningbo University (16 females, age range = 18‒23 years, M = 19.25 years, SD = 1.33) participated in the experiment for 40 CNY in remuneration. All participants were self-reported right-handed, had normal or corrected-to-normal vision, and had no reported history of psychiatric or neurological problems. Participants were asked to avoid eating food or drinking sweetened beverages for 3 h before the experiment. To control the influence of the human circadian system on the attention to food-related stimuli, all participants were tested between 11 am and 12 pm, or between 4 pm and 5 pm. Each participant provided written informed consent before the experiment. This study was approved by the Ethics Committee of the Academy of Neuroeconomics and Neuromanagement at Ningbo University.
Stimuli and Procedure
Stimuli were equated to luminance and contrast and were presented at the center of a 16-inch ViewSonic CRT monitor (ViewSonic, Inc., Walnut, California, refresh rate: 60 Hz, resolution: 1024 × 768 pixels) using the E-prime 3.0 software package (Psychology Software Tools, Inc., Pittsburgh, PA, USA). The distance between the participants and the computer screen was approximately 80 cm.
The experimental task consisted of two steps: a rating test and a binary choice task. In the rating test, participants were asked to rate the subjective values of 40 different snack items. Participants evaluated how much they would like to eat each snack at that moment, using an on-screen Likert scale ranging from −3 (extremely dislike) to 3 (extremely like).
The binary choice task began after a two-minute rest period. Each trial started with the presentation of a central fixation (subtending approximately 0.6° × 0.6° of visual angle) for 800–1200 ms, followed by a probe screen consisting of two snack items displayed simultaneously to the left and right of the fixation cross (subtending approximately 3° × 3° of visual angle) for 500 ms. Participants were instructed to choose their preferred snack item and press the “f” key for the left-side item or “j” key for the right-side item. Participants were asked to press the correct button as accurately and quickly as possible. The central fixation was dimmed when the response was implemented (Figure 1).
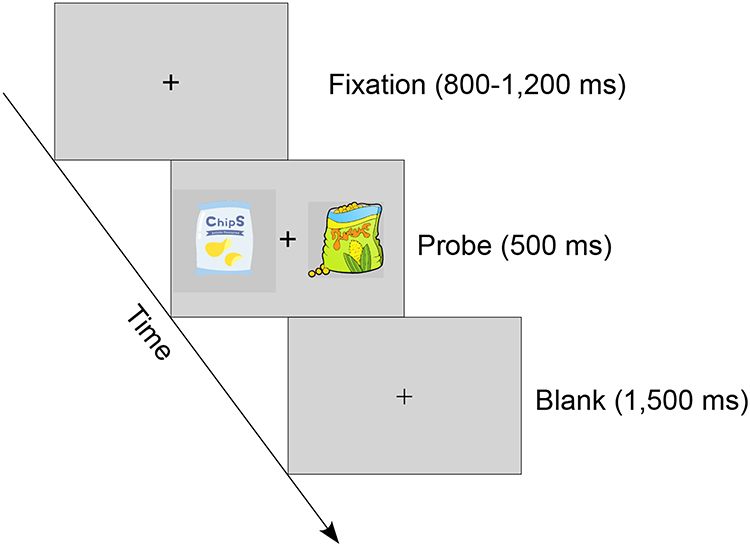 |
Figure 1 Schematic representation of the binary choice task. After a variable central fixation (800–1200 ms), two snack items were presented simultaneously on the screen for 500 ms and participants were asked to choose their preferred item by pressing a button. The central fixation become dimmed when a response was made. |
By constructing random pairs of items and controlling the value difference between the two snack items in the probe screen, the task was divided into two conditions: the high value difference (HVD) condition (4, 5, and 6 points of value difference) and the low value difference (LVD) condition (1, 2, and 3 points of value difference). The binary choice task contained 432 trials (216 trials for the HVD condition and 216 trials for the LVD condition), divided into six blocks of 72 trials each.
EEG Data Collection
EEG data were collected at 500 Hz with a SynAmps2 amplifier system and Curry 8 recorder software (Neuroscan Inc., Herndon, VA, USA). The EEG cap included 64 Ag/AgCl scalp electrodes arranged based on the international 10–20 system, with the reference electrode located between the Fpz and Fz electrodes and the ground electrode located between the Cz and Cpz electrodes. The vertical electrooculogram (EOG) was recorded using electrodes placed supra- and infraorbitally to the left eye and the horizontal EOG was recorded from the left and right orbital rims. The impedance of all electrodes was maintained below 5 KΩ throughout the experiment.
EEG data preprocessing was performed using the EEGLAB toolbox26 for MATLAB (R2009a, The MathWorks, Inc., Natick, MA). First, EEG data were bandpass filtered to a range of 0.1–30 Hz, re-referenced to the average of the left and right mastoids, and epoched from −1.5 s to +2 s surrounding the probe screen onset. Independent component analysis was computed using the EEGLAB toolbox. ICs representing eye blinks or other artifacts were removed from the EEG data (mean number of removed ICs across subjects = 5.24, SD = 1.32). Next, the current source density (CSD) transformed was carried out with the CSD toolbox (spline flexibility (m) = 4, λ = 1.0 × 10⁻⁵, with 50 iterations for all EEG scalp sites).27 The purpose of the CSD transformation was to minimize the volume conduction effect and identify the electrodes sufficiently representing task-relevant cognitive processes.22,23,28
Data Analysis
Behavioral Analysis
Trials with incorrect responses were removed, and trials with RTs deviating more than three SDs from the respective mean were discarded as outliers. We performed paired samples t-tests to compare the mean RTs and error rates between the HVD and LVD conditions.
ERP Analysis
Frontal N2 Component (290–340 ms)
The epoch of the ERP analysis was 700 ms (from 200 ms before to 500 ms after the onset of the probe screen). Then, the mean amplitude of the N2 component was computed at the frontal region of interest (ROI, including F1, Fz, F2, FC1, FCz, and FC2 electrodes). The average waveforms of the frontal ROIs were calculated for the HVD and LVD conditions. A paired samples t-test was then performed to compare the mean amplitude of the N2 component (time range: 290–340 ms) between the HVD and LVD conditions.
Posterior N2pc Component (230–280 ms)
The amplitude of N2pc was computed at the posterior ROI (including P5, P7, PO5, PO7, P6, P8, PO6, and PO8 electrodes). Average waveforms were calculated as a function of the value difference (HVD vs LVD) and contralaterality (contralateral vs ipsilateral to the target location). Specifically, the ipsilateral waveform was calculated as the average of the left-side electrodes in the posterior ROI (ie, P5, P7, PO5, and PO7) to the right-side targets and the right-side electrodes in the posterior ROI (ie, P6, P8, PO6, and PO8) to the left-side targets. In contrast, the contralateral waveform was computed as the average of the right-sided electrodes in the posterior ROI (ie, P6, P8, PO6, and PO8) to the right-side targets and the left-side electrodes in the posterior ROI (ie, P5, P7, PO5, and PO7) to the left-side targets. We conducted a repeated measures analysis of variance (rm-ANOVA) on the amplitude of the negative waveform (time range: 230–280 ms), with value difference (HVD vs LVD) and contralaterality (contralateral vs ipsilateral) as within-subject factors.
Time-Frequency Decomposition and Analysis
All analyses were implemented in MATLAB. Each trial of EEG data was first decomposed into its time-frequency representation by multiplying the power spectrum of each EEG trial by the power spectrum of complex Morlet wavelets ( . In this analysis, t denotes time, f denotes frequency, which increases from 1 to 30 Hz in 30 logarithmically spaced steps, and σ denotes the width of each frequency band (σ was set as 3–10 logarithmically spaced cycles in this study). Next, the inverse fast Fourier transform was applied, and the oscillatory power was defined as the squared magnitude of the convolution Z(real[z(t)]2+imag[z(t)])2. To ensure that the oscillatory power across all conditions and participants were comparable, they were normalized in decibel (dB) scale (conversion equation: dB power = 10 × log10 (power/baseline)), where the baseline activity was taken from −350 ms to −150 ms preceding the target.
Frontal Theta-Band Oscillation (3–7 Hz, 300–350 ms)
The magnitudes of theta-band activity (frequency range: 3–7 Hz, time range: 300–350 ms) for the HVD and LVD conditions were entered into a paired samples t-test.
Posterior Theta-Band Oscillation (3–7 Hz, 300–450 ms)
The magnitudes of theta-band activity (frequency range: 3–7 Hz, time range: 300–450 ms) were delivered with an rm-ANOVA, with “value difference” and “contralaterality” as within-subject factors.
Correlation Analysis
Building on prior research,24 we carried out a series of Spearman correlation analyses to detect the relationship between the differences in behavioral performance (ie, the difference in the mean RTs and error rates, HVD condition minus LVD condition), the difference in ERP activities (ie, the difference in the prefrontal N2 and posterior N2pc components, HVD condition minus LVD condition), and the difference in neural oscillatory activities (ie, the difference in the prefrontal and posterior theta-band oscillations, HVD condition minus LVD condition).
Results
Behavior Results
Mean Reaction Times (RTs)
Participants showed a faster response in the HVD condition (M = 690.13 ms, SD = 121.20) than in the LVD condition (M = 786.83 ms, SD = 120.46; t = 13.46, p < 0.001, Cohen’s d = 0.80).
Error Rates
Participants showed lower error rates in the HVD condition (M = 4.54%, SD = 4.99) than in the LVD condition (M = 20.04%, SD = 6.13; t = 19.62, p < 0.001, Cohen’s d = 2.74).
ERP Results
Frontal N2 Component (290–340 ms)
Participants elicited a smaller amplitude of the N2 component in the HVD condition (M = −18.78 μV/m2, SD = 12.05) than in the LVD condition (M = – 20.17 μV/m2, SD = 11.78; t = 2.73, p = 0.012, Cohen’s d = 0.12; Figure 2A and B).
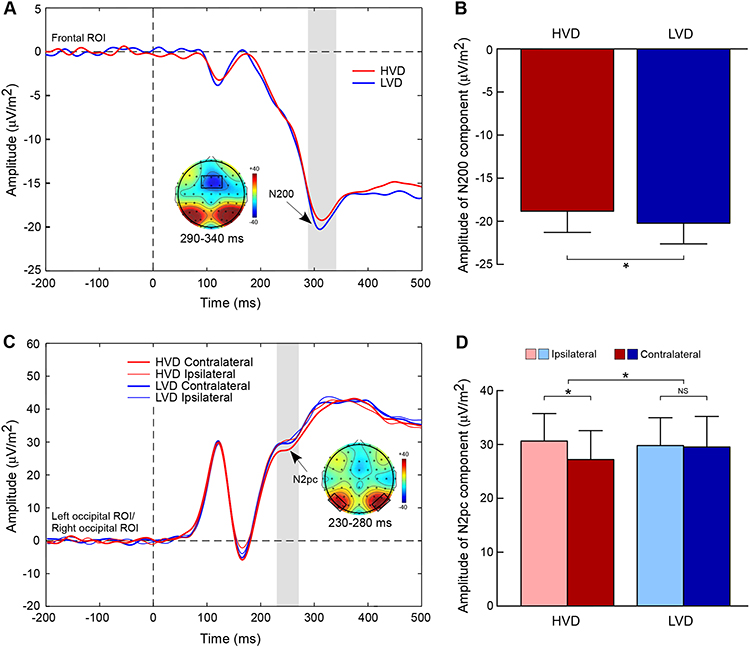 |
Figure 2 Grand-averaged ERP results. (A) Illustration of ERP waveforms located at the frontal cortex for higher value difference (HVD, red line) and lower value difference (LVD, blue line) conditions. The grey box represents the N200 component (290–340 ms), and the scalp topographic map delineates the frontal region of interest (ROI) comprised of the F1, Fz, F2, FC1, FCz, and FC2 electrodes. (B) Amplitude of the N200 component for the HVD and LVD conditions. (C) Illustration of ERP waveforms at contralateral location, ipsilateral location for the HVD and LVD conditions. The grey box represents the N2pc component (230–280 ms), and the scalp topographic map delineates the posterior ROI comprised of P5, P7, PO5, PO7, P6, P8, PO6, and PO8 electrodes. (D) Amplitude of the N2pc component as function of value difference (VD) level and contralaterality. Error bars denote standard error across participants. Asterisk denotes significant difference (p < 0.05). Abbreviation: NS, non-significant difference. |
Posterior N2pc Component (230–280 ms)
The results showed a significant value difference condition × contralaterality interaction effect, F(1, 23) = 6.24, p = 0.02,  = 0.21. Post-hoc comparisons showed that participants elicited a more negative N2pc component for the contralateral-to-target location (Mcontralateral = 27.22 μV/m2, SD = 26.21) than for the ipsilateral-to-target location (Mipsilateral = 30.65 μV/m2, SD = 24.99) in the HVD condition (F(1, 23) = 8.84, p = 0.007,
  = 0.28), but the effect was not found in the LVD condition (Mcontralateral = 29.54, SD = 27.82; Mipsilateral = 29.82, SD = 25.22; F < 1; Figure 2C and D).
Time-Frequency Results
Frontal Theta-Band Oscillation (3–7 Hz, 300–350 ms)
Participants elicited a larger magnitude of theta-band activity in the HVD condition (M = 1.21 dB; SD = 1.18) than in the LVD condition (M = 0.90 dB; SD = 1.24; t = 2.35, p = 0.028, Cohen’s d = 0.23; Figure 3A and B).
 |
Figure 3 Neural oscillation results. (A) Illustration of theta-band oscillations over the frontal ROI on the HVD condition (left panel), LVD condition (middle panel), and difference condition (LVD minus HVD, right panel), respectively. (B) Magnitude of theta-band oscillations over the frontal ROI for the HVD and LVD conditions. (C) Illustration of theta-band oscillations over the posterior ROI for the contralateral-to-target location (left panel), ipsilateral-to-target location (middle panel), and the difference (Contralateral minus Ipsilateral, right panel) on the HVD (top panel) and LVD (bottom panel) conditions, respectively. (D) Magnitude of theta-band oscillations over the posterior ROI as the function of value difference and contralaterality. (E) Scalp topographic map delineates the theta-band oscillations synchronously appeared at the frontal and the posterior ROIs. Error bars represent standard error across participants. Asterisk denotes significant difference (p < 0.05). Abbreviation: NS, non-significant difference. |
Posterior Theta-Band Oscillation (3–7 Hz, 300–450 ms)
The results showed a significant value difference condition × contralaterality interaction effect, F(1, 23) = 4.77, p = 0.039,  = 0.17. Post-hoc comparisons showed that participants elicited a larger magnitude of theta-band activity for the contralateral-to-target location (Mcontralateral = 2.87 dB, SD = 1.77) than for the ipsilateral-to-target location (Mipsilateral = 2.56 dB, SD = 1.79) in the HVD condition (F(1, 23) = 6.09, p = 0.021,
  = 0.21), but the effect was also not found in the LVD condition (Mcontralateral = 2.73, SD = 1.61; Mipsilateral = 2.74, SD = 1.68; F < 1; Figure 3C and D).
Correlation Results
Results showed that the difference in the prefrontal theta-band synchronization (HVD minus LVD) was negatively correlated with the difference in the N2 component (HVD minus LVD) (rho = – 0.49, p = 0.015), suggesting that the theta-band activity may be the oscillatory mechanism underlying the N2 component in the human prefrontal cortex. Moreover, the difference in the posterior theta-band oscillation (HVD minus LVD) was negatively correlated with the difference in the N2pc component (HVD minus LVD) (rho = – 42, p = 0.042), indicating that theta-band activity may be the oscillatory mechanism underlying the N2pc component over the posterior region in the human brain. Crucially, we observed that the difference in the frontal theta-band synchronization implicated in subjective value representation was negatively correlated with the difference in the posterior theta-band synchronization associated with visual attentional bias (rho = – 0.45, p = 0.027; Figure 3E), demonstrating that highly valuable items may recruit more attention resources, implying that theta-band synchronization may represent visual attentional bias to subjective preferences.
Discussion
In this study, we adopted a binary choice task in which participants needed to choose one snack they preferred, to detect the neural temporal and neural oscillatory features underlying attentional bias to subjective preferences in value-based decisions. The results showed that participants had a faster response and lower error rates in the HVD condition than in the LVD condition. In parallel, participants exhibited reduced prefrontal N200 component and prefrontal theta-band activity in the HVD condition compared to that in the LVD condition, and greater (more negative) posterior N2pc component and posterior theta-band activity in the HVD condition than that in the LVD condition. Notably, the prefrontal theta-band activity was observed to correlate with posterior theta-band activity. These findings suggest that theta-band synchronization may represent attentional bias to subjective preferences in value-based decisions.
Compared to previous studies emphasizing that the frontal N200 component reflects the “absolute value” of single consumer goods,6,7 our study adopted a binary choice task in which two consumer goods were presented simultaneously and indicated that the frontal N200 component may represent the “relative value” between two candidates.10,29 Similar to previous studies,6,7 the frontal N200 component diminished in the HVD condition compared to that in the LVD condition, suggesting that the frontal N200 component was modulated by subjective preferences. We proposed that the frontal N200 component may reflect the processing of assigning subjective values to each candidate and comparing them according to personal preferences.3–5
Furthermore, we observed that participants exerted a greater amplitude of the N2pc component in the HVD condition than in the LVD condition. Compared to prior studies, our results suggest that the N2pc component may not only represent individual attentional bias to life-threatening or rewarding stimuli15–17 but may mirror individual attentional bias to stimuli assigned with higher subjective value. This proposition is also supported by the behavioral results that participants exhibited faster response times and lower error rates in the HVD condition than in the LVD condition. Such preferential processing in the HVD condition might be derived from more rapid and accurate detection of the value difference in the HVD condition, compared to that in the LVD condition. These behavioral and neural results were consistent with the evolutionary theory, which posited that recruiting more attention resources and facilitating the detection of life-threatening or valuable stimuli benefit individuals’ adaptive responses to changing environments, which is conducive to human survival.30,31
Interestingly, we found that the effect of N2pc (ie, the amplitude of the negative waveform in the contralateral-to-target location condition was greater (more negative) than that in the ipsilateral-to-target location condition) only existed in the HVD condition (but not observed in the LVD condition), which suggests that the attention process involved in the HVD and LVD conditions may be distinct. These observations can be interpreted using a biased competition model.32,33 According to the biased competition model, attention resources are limited and selective attention operates in parallel on competitive interactions between multiple stimuli in the visual space toward one stimulus or another, so that the goal-relevant stimuli can be eventually captured by attention and processed in the brain, whereas goal-irrelevant stimuli are filtered out. In the HVD condition, the subjective value of one item is much more than the other; thus, the more valuable item has an overwhelming competitive advantage against the other and can attract individuals’ attention rapidly and strongly, leading to the existence of the N2pc effect. In contrast, in the LVD condition, the subjective value disparities between the two items are relatively narrow, and individuals’ attention may shift repeatedly between the candidates until a deliberate decision is made, resulting in the absence of the N2pc effect and behaviorally prolonged decision time.10
We further detected the neural oscillatory features underpinning the prefrontal N2 and posterior N2pc components. We observed that the prefrontal theta-band activity, which correlated with the frontal N200 component, was reduced in the HVD condition compared to that in the LVD condition, indicating that value representation-related theta-band synchronization over the human frontal cortex was modulated by subjective preferences. Interestingly, we observed a counterintuitive finding that there was reduced frontal theta-band power in the HVD condition compared to that in the LVD condition. These results were consistent with the observations of Telpazet et al6, who found that there was attenuated frontal theta-band power for the more preferred goods compared to the less preferred goods. It has been suggested that prefrontal theta-band synchronization is mainly associated with the vmPFC, which is widely implicated in reward processing and value representation in decision making.9,11,12 Meanwhile, as a critical part of the default mode network (DMN) in the human brain,34 the vmPFC was also observed to be negatively correlated with frontal theta-band synchronization in a recent attention task,35 because of the deactivation of the DMN in tasks requiring external attention.36 This further implies that frontal theta-band synchronization may (partly) be implicated in attentional processes. Consistent with this proposition, we speculated that reduced frontal theta-band power for the HVD condition in our study may represent greater activation of the vmPFC when participants complete the HVD trials (in this study) or are rarely confronted with more preferred goods. Given the importance of the counterintuitive observations in previous studies and in our research, the natural relationship between frontal theta-band synchronization and the vmPFC deserves further investigation (for example, using simultaneous EEG-fMRI).
Following the previous studies,22–24 we observed that the posterior contralateral theta-band activities were greater than the ipsilateral ones upon presentation of the probe screen, and posterior theta-band activity was correlated with the posterior N2pc component, suggesting that the posterior contralateral visual cortex may be implicated in visual lateralization (attentional bias) to visual points of interest.22,37,38 Similar to the N2pc component, a significant difference in theta-band activity between the contralateral-to-target location and the ipsilateral-to-target location can be observed in the HVD condition (but not observed in the LVD condition), confirming that theta-band synchronization may represent distinct process patterns underlying attentional bias to subjective preferences in HVD and LVD conditions.
Crucially, our findings showed that prefrontal theta-band activity correlated significantly with posterior theta-band activity. Theta-band synchronization is widely thought to be indicative of connections between multiple brain regions involved in task-relevant information processes via long-distance synchronizations.18,39,40 Under this unique characteristic, theta-band synchronization may provide a neural oscillatory integrative mechanism to link the prefrontal cortex related to value representation with the posterior cortex associated with selective attention to subjective preference, which is consistent with several earlier studies and frameworks that delineate that there is a close relationship between attention and preference.14,22 Based on previous studies and our findings, we speculated that the frontal cortex and the posterior cortex may interact with each other in value-based decisions and theta-band synchronization may mediate reciprocal frontal-posterior interactions in human attentional bias toward subjective preferences.
To our knowledge, this study is the first to investigate the neural oscillatory dynamics underlying attentional bias to individual preferences in value-based decisions.
Our findings have important implications for the research fields of neuromarketing and consumer neuroscience. For the theoretical implication, our findings suggest that theta-band synchronization can be an integrative mechanism to reconcile separate mental processes (eg, selective attention and subjective value representation) related to value-based decision making, which is conducive to identifying the underlying mechanisms of value-based decision making.3 For practical implications, our results emphasize the importance of “relative value” between consumer goods and the modulation of selective attention on the relative value signals in binary choices in daily life,1,10 which may provide a new avenue for consumer behavior researchers.
Funding
This work was supported by the National Natural Science Foundation of China (Grant No. 71942002), the Philosophy and Social Science Project of Zhejiang Province of China (Grant No. 21NDQN225YB), and the K. C. Wong Magna Fund in Ningbo University.
Disclosure
The authors report no conflicts of interest related to this work.
References
1. Pisauro MA, Fouragnan E, Retzler C, Philiastides MG. Neural correlates of evidence accumulation during value-based decisions revealed via simultaneous EEG-fMRI. Nat Commun. 2017;8(1). doi:10.1038/ncomms15808
2. Krajbich I, Armel C, Rangel A. Visual fixations and the computation and comparison of value in simple choice. Nat Neurosci. 2010;13(10):1292–1298. doi:10.1038/nn.2635
3. Plassmann H, Venkatraman V, Huettel S, Yoon C. Consumer neuroscience: applications, challenges, and possible solutions. J Market Res. 2015;52(4):427–435. doi:10.1509/jmr.14.0048
4. Rangel A, Hare T. Neural computations associated with goal-directed choice. Curr Opin Neurobiol. 2010;20(2):262–270. doi:10.1016/j.conb.2010.03.001
5. Rangel A, Camerer C, Montague PR. A framework for studying the neurobiology of value-based decision making. Nat Rev Neurosci. 2008;9(7):545–556. doi:10.1038/nrn2357
6. Telpaz A, Webb R, Levy DJ. Using EEG to predict consumers’ future choices. J Market Res. 2015;52(4):511–529. doi:10.1509/jmr.13.0564
7. Goto N, Mushtaq F, Shee D, et al. Neural signals of selective attention are modulated by subjective preferences and buying decisions in a virtual shopping task. Biol Psychol. 2017;128:11–20. doi:10.1016/j.biopsycho.2017.06.004
8. Tyson-Carr JA, Kokmotou K, Soto V, et al. The neural correlates of economic value and valuation context: an event-related potentials study. J Neurophysiol. 2018;119(5):1924–1933. doi:10.1152/jn.00524.2017
9. Brosch T, Sander D. Neurocognitive mechanisms underlying value-based decision-making: from core values to economic value. Front Hum Neurosci. 2013;7(398). doi:10.3389/fnhum.2013.00398
10. Lim S-L, O’Doherty J, Rangel A. The decision value computations in the vmPFC and striatum use a relative value code that is guided by visual attention. J Neurosci. 2011;31:13214–13223. doi:10.1523/JNEUROSCI.1246-11.2011
11. Hare T, Malmaud J, Rangel A. Focusing attention on the health aspects of foods changes value signals in vmPFC and improves dietary choice. J Neurosci. 2011;31:11077–11087. doi:10.1523/JNEUROSCI.6383-10.2011
12. Levy D, Glimcher P. Comparing apples and oranges: using reward-specific and reward-general subjective value representation in the brain. J Neurosci. 2011;31:14693–14707. doi:10.1523/JNEUROSCI.2218-11.2011
13. Armel KC, Beaumel A, Rangel A. Biasing simple choices by manipulating relative visual attention. Judgm Decis Mak. 2008;3(June):396–403.
14. Shimojo S, Simion C, Shimojo E, Scheier C. Gaze bias both reflects and influences preference. Nat Neurosci. 2003;6(12):1317–1322.
15. Kappenman ES, Farrens JL, Luck SJ, Proudfit G. Behavioral and ERP measures of attentional bias to threat in the dot-probe task: poor reliability and lack of correlation with anxiety. Front Psychol. 2014;5:1368. doi:10.3389/fpsyg.2014.01368
16. Liu Y, Wang P, Wang G. The priority of goal-relevant information and evolutionarily threatening information in early attention processing: evidence from behavioral and ERP study. Sci Rep. 2020;10(1):8008. doi:10.1038/s41598-020-65062-5
17. Buodo G, Sarlo M, Munafò M. The neural correlates of attentional bias in blood phobia as revealed by the N2pc. Soc Cogn Affect Neurosci. 2010;5(1):29–38. doi:10.1093/scan/nsp050
18. Cavanagh JF, Frank MJ. Frontal theta as a mechanism for cognitive control. Trends Cogn Sci. 2014;18(8):414–421. doi:10.1016/j.tics.2014.04.012
19. Cohen MX. Where does EEG come from and what does it mean? Trends Neurosci. 2017;40:208–218. doi:10.1016/j.tins.2017.02.004
20. Biasiucci A, Franceschiello B, Murray MM. Electroencephalography. Curr Biol. 2019;29(3):R80–R85. doi:10.1016/j.cub.2018.11.052
21. Foucher JR, Otzenberger H, Gounot D. The BOLD response and the gamma oscillations respond differently than evoked potentials: an interleaved EEG-fMRI study. BMC Neurosci. 2003;4:22. doi:10.1186/1471-2202-4-22
22. Kawasaki M, Yamaguchi Y. Effects of subjective preference of colors on attention-related occipital theta oscillations. Neuroimage. 2012;59(1):808–814. doi:10.1016/j.neuroimage.2011.07.042
23. Diao L, Qi S, Xu M, Fan L, Yang D. Electroencephalographic theta oscillatory dynamics reveal attentional bias to angry faces. Neurosci Lett. 2017;656:31–36. doi:10.1016/j.neulet.2017.06.047
24. Dowdall JR, Luczak A, Tata MS. Temporal variability of the N2pc during efficient and inefficient visual search. Neuropsychologia. 2012;50(10):2442–2453. doi:10.1016/j.neuropsychologia.2012.06.015
25. Mas-Herrero E, Marco-Pallarés J. Theta oscillations integrate functionally segregated sub-regions of the medial prefrontal cortex. Neuroimage. 2016;143:166–174. doi:10.1016/j.neuroimage.2016.08.024
26. Delorme A, Makeig S. EEGLAB: an open source toolbox for analysis of single-trial EEG dynamics including independent component analysis. J Neurosci Methods. 2004;134(1):9–21. doi:10.1016/j.jneumeth.2003.10.009
27. Kayser J, Tenke CE. Principal components analysis of Laplacian waveforms as a generic method for identifying ERP generator patterns: I. Evaluation with auditory oddball tasks. Clin Neurophysiol. 2006;117(2):348–368. doi:10.1016/j.clinph.2005.08.034
28. Dippel G, Muckschel M, Ziemssen T, Beste C. Demands on response inhibition processes determine modulations of theta band activity in superior frontal areas and correlations with pupillometry - implications for the norepinephrine system during inhibitory control. Neuroimage. 2017;157:575–585. doi:10.1016/j.neuroimage.2017.06.037
29. Strait CE, Blanchard TC, Hayden BY. Reward value comparison via mutual inhibition in ventromedial prefrontal cortex. Neuron. 2014;82(6):1357–1366. doi:10.1016/j.neuron.2014.04.032
30. Öhman A Fear and anxiety as emotional phenomena: clinical phenomenology, evolutionary perspectives, and information-processing mechanisms. 1993.
31. Anderson BA, Laurent PA, Yantis S. Generalization of value-based attentional priority. Vis Cogn. 2012;20(6):647–658. doi:10.1080/13506285.2012.679711
32. Desimone R, Duncan J. Neural mechanisms of selective visual attention. Annu Rev Neurosci. 1995;18(1):193–222. doi:10.1146/annurev.ne.18.030195.001205
33. Deco G, Rolls ET. Neurodynamics of biased competition and cooperation for attention: a model with spiking neurons. J Neurophysiol. 2005;94(1):295–313. doi:10.1152/jn.01095.2004
34. Raichle ME. The brain’s default mode network. Annu Rev Neurosci. 2015;38(1):433–447. doi:10.1146/annurev-neuro-071013-014030
35. Rajan A, Siegel SN, Liu Y, Bengson J, Mangun GR, Ding M. Theta oscillations index frontal decision-making and mediate reciprocal frontal–parietal interactions in willed attention. Cereb Cortex. 2018;29(7):2832–2843. doi:10.1093/cercor/bhy149
36. Wen X, Liu Y, Yao L, Ding M. Top-down regulation of default mode activity in spatial visual attention. J Neurosci. 2013;33(15):6444–6453. doi:10.1523/JNEUROSCI.4939-12.2013
37. Hillyard SA, Vogel EK, Luck SJ, Humphreys GW, Duncan J, Treisman A. Sensory gain control (amplification) as a mechanism of selective attention: electrophysiological and neuroimaging evidence. Philos Transact Royal Soc B. 1998;353(1373):1257–1270. doi:10.1098/rstb.1998.0281
38. Luck SJ, Chelazzi L, Hillyard SA, Desimone R. Neural mechanisms of spatial selective attention in areas V1, V2, and V4 of macaque visual cortex. J Neurophysiol. 1997;77(1):24–42. doi:10.1152/jn.1997.77.1.24
39. Sauseng P, Klimesch W, Schabus M, Doppelmayr M. Fronto-parietal EEG coherence in theta and upper alpha reflect central executive functions of working memory. Int J Psychophysiol. 2005;57(2):97–103. doi:10.1016/j.ijpsycho.2005.03.018
40. Cooper PS, Wong AS, Fulham WR, et al. Theta frontoparietal connectivity associated with proactive and reactive cognitive control processes. Neuroimage. 2015;108:354–363. doi:10.1016/j.neuroimage.2014.12.028
 © 2021 The Author(s). This work is published and licensed by Dove Medical Press Limited. The
full terms of this license are available at https://www.dovepress.com/terms
and incorporate the Creative Commons Attribution
- Non Commercial (unported, 3.0) License.
By accessing the work you hereby accept the Terms. Non-commercial uses of the work are permitted
without any further permission from Dove Medical Press Limited, provided the work is properly
attributed. For permission for commercial use of this work, please see paragraphs 4.2 and 5 of our Terms.
© 2021 The Author(s). This work is published and licensed by Dove Medical Press Limited. The
full terms of this license are available at https://www.dovepress.com/terms
and incorporate the Creative Commons Attribution
- Non Commercial (unported, 3.0) License.
By accessing the work you hereby accept the Terms. Non-commercial uses of the work are permitted
without any further permission from Dove Medical Press Limited, provided the work is properly
attributed. For permission for commercial use of this work, please see paragraphs 4.2 and 5 of our Terms.