Back to Journals » Nature and Science of Sleep » Volume 13
Electroencephalographic Activity and Cognitive Function in Middle-Aged Patients with Obstructive Sleep Apnea Before and After Continuous Positive Airway Pressure Treatment
Authors Wang J ![]() , Xu J, Liu S, Han F, Wang Q, Gui H, Chen R
, Xu J, Liu S, Han F, Wang Q, Gui H, Chen R
Received 29 May 2021
Accepted for publication 14 August 2021
Published 27 August 2021 Volume 2021:13 Pages 1495—1506
DOI https://doi.org/10.2147/NSS.S322426
Checked for plagiarism Yes
Review by Single anonymous peer review
Peer reviewer comments 3
Editor who approved publication: Prof. Dr. Ahmed BaHammam
Jianhua Wang,1,2,* Juan Xu,1– 3,* Shuling Liu,1,2 Fei Han,1,4 Qiaojun Wang,1,4 Hao Gui,1,4 Rui Chen1,2
1Sleep Center, The Second Affiliated Hospital of Soochow University, Soochow University, Suzhou, 215004, People’s Republic of China; 2Department of Respiratory Medicine, The Second Affiliated Hospital of Soochow University, Soochow University, Suzhou, People’s Republic of China; 3Department of Respiratory Medicine, The Yancheng Clinical College of Xuzhou Medical University, The First People’s Hospital of Yancheng City, Yancheng, People’s Republic of China; 4Department of Neurology, The Second Affiliated Hospital of Soochow University, Soochow University, Suzhou, People’s Republic of China
*These authors contributed equally to this work
Correspondence: Rui Chen Email [email protected]
Purpose: To investigate the effect of continuous positive airway pressure (CPAP) on sleep electroencephalogram (EEG) activity in patients with obstructive sleep apnea (OSA) and to examine the correlation between quantitative EEG changes and cognitive function.
Patients and Methods: A total of 69 men and 11 women were collected with an average age of 39.61 ± 7.67 years old from among middle-aged patients who had first visits with snoring as their main complaint. All of them completed sleep questionnaires, neurocognitive tests and night polysomnography (PSG). The patients in the OSA group also completed the second night of PSG monitoring under CPAP after pressure titration. A power spectrum analysis of EEG was used, and the correlation between the frequency powers of EEG and the scores of the Epworth Sleepiness Scale (ESS), Pittsburgh Sleep Quality Index (PSQI), Mini-Mental State Examination (MMSE), and the Montreal Cognitive Assessment (MoCA) were further analyzed.
Results: Compared with the control group, the delta/alpha power ratio (DAR) and the (delta + theta)/(alpha + beta) power ratio (the slowing ratio, TSR) of the OSA group before CPAP were higher (P < 0.05). The DAR and TSR of the OSA patients decreased significantly after CPAP. ESS scores were correlated with parameters such as respiratory-related microarousal index (RRMAI), apnea hypopnea index (AHI), and the average absolute power of delta, DAR and TSR (P < 0.05). The PSQI, MMSE and MoCA scores were not correlated with the average absolute power of each frequency band, DAR or TSR (P > 0.05).
Conclusion: Patients with OSA have greater slow frequency EEG activity during sleep than the control group. CPAP treatment reversed the slow frequency EEG activity in patients with OSA.
Keywords: obstructive sleep apnea, quantitative electroencephalogram, cognitive function, continuous positive airway pressure
Introduction
Obstructive sleep apnea (OSA) is one of the most common sleep-related respiratory disorders in clinical practice, with a high prevalence in adults. Data from the United States and Europe showed that between 14 and 49% of middle-aged men had clinically significant obstructive sleep apnea compared with approximately 25% of women.1,2 The incidence and prevalence of OSA may gradually increase, accompanied by the global obesity epidemic and the development of an aging society, which has become an important public health challenge in developed and developing countries.3
Patients with OSA have repeated hypoxemia, hypercapnia, and arousal during sleep, which are caused by intermittent episodes of upper airway obstruction or reductions in breath amplitude, leading to sleep fragmentation. In clinical practice, they may have loud and irregular snoring, night asphyxia or other sleep disorders. During the day, they may feel less refreshed after waking up, while some of them may feel dizzy in the morning, and suffer from drowsiness, fatigue and memory loss. Patients with severe OSA may suffer from cognitive decline, behavioral abnormalities, etc., which affect their functioning in normal life. An increasing number of studies have shown that OSA can cause neuromodulation dysfunction, endocrine disorders and hemodynamic changes. It can gradually lead to dysfunction of various organs and systems, a series of complications and even sudden death.4 OSA is not only an independent risk factor for hypertension but also cardiovascular and cerebrovascular diseases.5 It is also closely related to cognitive dysfunction.6,7 It is one of the risk factors for neurodegenerative diseases such as Alzheimer’s disease and Parkinson’s disease.8 From a society perspective, the cognitive dysfunction caused by OSA increases the medical burden on society and the risk of motor vehicle accidents. At the same time, it also reduces individual work efficiency and socioeconomic productivity to varying degrees.
However, there is no gold standard method for the measurement of cognitive impairment in patients with OSA. In clinical practice, the assessment of cognitive function usually relies on medical history, symptom reports and neuropsychological questionnaire tools. Polysomnography (PSG) is the gold standard method of diagnosing sleep-related respiratory diseases. Although the physiological signals of electroencephalograms (EEGs) are routinely recorded, their application is far from sufficient. For example, EEG signals contain a lot of information about brain activity and sleep quality, which cannot be fully displayed by conventional sleep stages and scores. In recent years, the application of EEG analysis technology has provided an opportunity to search for potential biological markers that reflect the neurobehavioral and cognitive functions of OSA patients.9
Many studies have shown that patients with OSA have a higher level of EEG slower frequency activity (Delta, Theta) than those without OSA.9–11 Slow frequency EEG activity is considered to reflect weakened cerebral cortex activity, decreased alertness, and lethargy.10 It is associated with poor psychomotor alertness task performance and sleep-related hypoxemia. The delta/alpha power ratio (DAR) may be a biomarker for OSA cognitive function.11 Continuous positive airway pressure (CPAP) is an important treatment for patients with moderate to severe OSA. It is very important to normalize the changes in EEG. To our knowledge, few studies have shown the influence of CPAP on dynamic changes in nocturnal EEG activity.12,21 Some studies have analyzed its relationship with daytime sleepiness, but their average number of subjects was less than thirty.10,11,33 It is not clear whether there is a correlation between slow frequency EEG activity and neurocognitive function questionnaires, such as the MoCA.
In this study, the quantitative EEG changes of night sleep were analyzed in middle-aged OSA patients before and after CPAP. After understanding the effects of CPAP, the relationship between quantitative EEG changes and the neurocognitive function questionnaire was further discussed.
Patients and Methods
Patients
Patients with the chief complaint of snoring were recruited and visited the sleep center of the Second Affiliated Hospital of Soochow University in Suzhou, China, from October 2019 to October 2020 (see Figure 1, for the progress of participants through the study). All of the patients were right-handed and completed sleep questionnaires, neurocognitive tests and PSG on the same night. All of them participated voluntarily, fully understood the research process and signed informed consent prior to participation. The inclusion criteria were age between 30 and 60 years, regardless of gender, and more than 6 years of education. The patients were included in the OSA group if they had an apnea hypopnea index (AHI) ≥ 15 events/hour (mainly obstructive events) monitored by PSG on the first night. They showed a good clinical and PSG response to CPAP after pressure titration, with AHI < 5 events/hour on the second night. The EEG data of the CPAP-treated OSA patients was collected at optimum pressure on the third night. The control group consisted of subjects monitored by PSG with AHI < 5 events/hour. Since these patients do not need ventilator treatment, pressure titration is not performed. The exclusion criteria were as follows: OSA-related surgery and ventilator treatment; other sleep disorders, such as insomnia, central sleep apnea, obesity hypoventilation syndrome, restless legs syndrome, rapid eye movement sleep behavior disorders, periodic limb movement disorders, and mental illness (eg, depression, anxiety, schizophrenia); treatment with antihistamines, sedative hypnotics, antidepressants, or antibiotics within the previous three months; or neurological malignancies, Alzheimer’s disease, or other serious heart, kidney, liver, lung or brain diseases that affect quality of life.
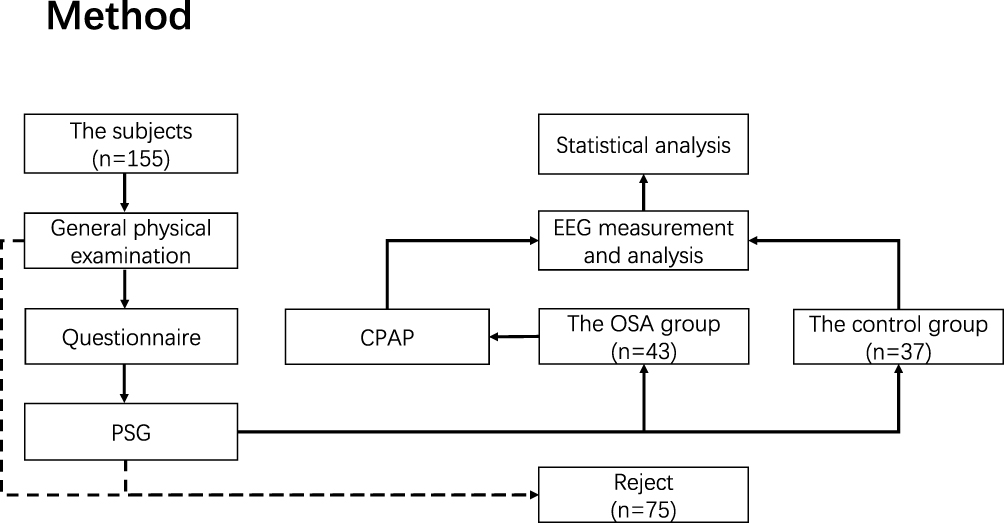 |
Figure 1 Flow chart. |
We obey the principles of the Declaration of Helsinki. This protocol was approved by the Ethics Committee of the Second Affiliated Hospital of Soochow University (JD-LK-2018-004-02).
Demographic Information and Questionnaire
General information, such as age, sex, education, weight, height, and blood pressure were collected from the patients by a doctor at the sleep center before the PSG started. At the same time, their specific symptoms, course of disease, and past medical history were assessed, and a general physical examination was completed. All subjects completed sleep questionnaires and neurocognitive tests in a quiet, comfortable and isolated room. The Epworth Sleepiness Scale (ESS) and Pittsburgh Sleep Quality Index (PSQI) scores were obtained to evaluate daytime sleepiness and subjective sleep quality.13,14 The level of cognitive function of these patients was measured with the Mini-Mental State Examination (MMSE) and Montreal Cognitive Assessment (MoCA).15 The Chinese version of the MoCA questionnaire (Beijing version) (https://www.mocatest.org/) was used. The cognitive function assessment scale is used by professional medical staff to evaluate and score patients’ attention, memory, language, executive ability, etc., and provide a reference for clinical cognitive impairment. The total score of MMSE is 30, 27–30 is normal, and a score less than 27 indicates cognitive dysfunction. The total score of MoCA is 30, ≥26 points are normal. The total score of PSQI is 0–21. The higher the score, the worse the sleep quality.
Polysomnography
All subjects completed overnight polysomnography (Alice 6, Philips, USA) at the sleep center. The procedure began at 10:00 p.m. and ended at 6:00 a.m. the following day. The continuous monitoring time was more than seven hours, the data were manually evaluated by two full-time technicians according to the international standard of the American Sleep Medicine Association and the artifacts were eliminated by manual examination.16 Overnight information, including EEG (F3, F4, C3, C4, O1, O2, A1 and A2 electrodes, placed according to the International 10–20 System), mandibular electromyography, eye movement, nasal airflow, mouth and nose thermistor pressure, chest and abdomen movement, electrocardiogram, body position, oxygen saturation, snoring index, video and other signals, were effectively recorded. Obstructive apnea was defined as a reduction in the mouth thermistor signal to < 10% of baseline for at least 10 s, with continued or increased respiratory effort. Hypopnea was defined as a substantial reduction in airflow (≥ 30%) for at least 10 s associated with oxygen desaturation (≥ 3%) or arousal. The apnea hypopnea index (AHI) was defined as the total number of apneas and hypopneas per hour of sleep, and the oxygen desaturation index (ODI) was calculated as the number of oxygen desaturations (≥ 4%) per hour of sleep. PSG parameters such as total sleep time, sleep efficiency, sleep structure, oxygen saturation below 90% of the time/total sleep time (TS90%), lowest oxygen saturation (LSaO2), and maximum apnea time were also collected statistically.
The enrolled patients with moderate to severe OSA underwent CPAP pressure titration on the second night after the baseline polysomnography assessment to prepare for effective treatment. The next overnight PSG monitoring was completed on the basis of CPAP therapy.
EEG Measurement and Analysis
This study used EEGLAB (https://sccn.ucsd.edu/eeglab/index.php) and MATLAB (R2018b, USA) to perform EEG preprocessing on the studied EEG data (exported in European data format EDF). The entire sleep process was standardized through sleep staging in accordance with the international standards of the American Academy of Sleep Medicine, and the EEG epochs that were recorded by PSG of the first three sleep cycles were selected. During the NREM 1 (nonrapid eye movement 1, N1), NREM 2 (N2), NREM 3 (N3) and REM (rapid eye movement, R) phases of each sleep cycle, 60 s continuous EEG epochs were selected without artifacts, microarousal or body motion effects. A sleep cycle was defined as follows: from the beginning of NREM sleep, an episode lasting at least 15 minutes to the end of the followed REM sleep episode of at least 5 minutes duration.
Before preprocessing, all records were scanned and checked manually. The useless electrodes were deleted, and EEG channel positions were determined according to the International 10–20 System. The preprocessing includes rereferencing (bilateral mastoid), adjusting the sampling rate (200 Hz), setting high-pass (0.1 Hz) and low-pass filtering (95 Hz), notch filtering (50 Hz), independent component analysis (ICA), removal of eye movement components by ICA, removal of artifacts, etc. The absolute power of the EEG was calculated using the fast Fourier transform algorithm, and the window length was 2 s. Delta, theta, alpha, and beta bands were defined as the frequency ranges of 0.1–3.9 (delta), 4–7.9 (theta), 8–12.9 (alpha), and 13–32 (beta) Hz, respectively.
Statistical Analysis
The data were analyzed using Statistical Products and Services Solutions (SPSS, 26nd version). The measurement data in accordance with the normal distribution are expressed as the mean ± standard deviation, while the skewed distribution is expressed as the median (interquartile range). The comparison of enumeration data adopts the chi-square test. The two groups of normally distributed measurement data were compared by Student’s t test, while skewed distributions were compared by the rank sum test. The Wilcoxon test was used for paired comparisons before and after CPAP in the OSA group. One-way analysis of variance was used for the comparison between multiple samples, and the Kruskal–Wallis H rank sum test was used for the comparison of differences between multiple groups of skewed distributed data. Spearman correlation (skewed distribution) and Pearson’s correlation (normal distribution) were used to analyze the correlation between the two groups of data. The results were expressed by the P value, the test level α = 0.05 (bilateral), and P < 0.05 showed that the difference between the two groups was statistically significant.
Results
A total of 155 subjects were enrolled in this study over a period of one year, of which 75 were rejected. In the control group, 44 subjects were initially recruited. Among them, 7 were excluded due to poor PSG EEG data, and 37 were eventually included. In the OSA group, 15 subjects were excluded due to poor PSG data on the first night. 6 subjects asked to withdraw from the study. There were 26 patients who could not complete the pressure titration or could not tolerate CPAP treatment. A total of 64 subjects successfully completed PSG on the third night. However, 21 of them were excluded due to poor PSG data on the third night, and finally 43 subjects were included in the statistical analysis in the OSA group.
Table 1 shows the characteristics of the patients in each group. There were no statistically significant differences between the OSA group and the control group in sex, age, time of education, smoking and drinking habits, common clinical symptoms or complications. The body mass index (BMI) and blood pressure of the subjects in the OSA group were higher than those in the control group (P < 0.05).
 |
Table 1 Demographic Data, PSG Parameters, and Questionnaires of All Participants |
Sleep and Neurocognitive Questionnaire
There was no significant difference in PSQI scores between the OSA group and the control group (Table 1). The mean ESS score of the OSA group was 9.42 ± 4.50, which was higher than that of the control group (P = 0.003). The MMSE scores and MoCA scores were lower than those of the control group, and the difference was statistically significant (P < 0.05). This result did not appear to be influenced by the level of education, as there was no difference in the number of years of education between the two groups (P = 0.312).
Polysomnography
As shown in Table 1, compared with the control group, the proportion of N1 sleep was higher and N3 sleep was lower in the OSA group. The respiratory-related microarousal index (RRMAI), AHI, ODI, TS90% and longest time of apnea in the OSA group were significantly higher than those in the control group, while LSaO2 in the OSA group was significantly lower than that in the control group (P < 0.01). There were no statistically significant differences between the two groups in total sleep time, sleep efficiency, sleep latency, REM latency, or the proportion of N2 sleep and R sleep. All 43 subjects in the OSA group completed CPAP after pressure titration. Table 2 details the changes in sleep data before and after CPAP treatment in the OSA group. Compared with those before CPAP treatment, sleep efficiency, the proportion of N3 sleep, R sleep and LSaO2 of the OSA patients increased after that, while the proportion of N1 sleep, N2 sleep, AHI, ODI, and TS90% decreased significantly (P < 0.01).
 |
Table 2 PSG Parameters of the OSA Group Before and After CPAP Treatment |
Sleep Quantitative EEG Measures
A total of 1379 EEG epochs were collected from 80 subjects using the EEG sampling method described above. These included 425 EEG epochs in the control group, 458 EEG epochs in the OSA group before CPAP and 496 EEG epochs after CPAP. We named the OSA group before CPAP the OSA-1 group and after CPAP the OSA-2 group for the sake of brevity.
Table 3 compares the differences in the absolute power of EEG in different channels and different frequency bands between the control group, OSA-1 group, and OSA-2 group. In channels C3 and C4, there were significant differences in the absolute power values of EEG among the three groups (P < 0.05). Further pairwise comparisons showed that there were significant differences between the OSA-1 group and the control group, and the OSA-1 group and the OSA-2 group, but there was no significant difference between the OSA-2 group and the control group (P > 0.05). There were similar differences in the absolute power of EEG in other channels at different frequency bands, but some of the differences were not statistically significant (P > 0.05). This study further compared the differences in DAR and TSR of each channel among the three groups (Table 4). Compared with the OSA-1 group, the DAR and TSR of the control group were higher, and the DAR and TSR of the OSA-2 group were decreased; the difference was statistically significant (P < 0.05). Similarly, there was no significant difference in DAR and TSR between the OSA-2 group and the control group (P > 0.05). The dynamic comparison of EEG absolute power, DAR and TSR in the first three sleep cycles of each group is shown in Figure 2.
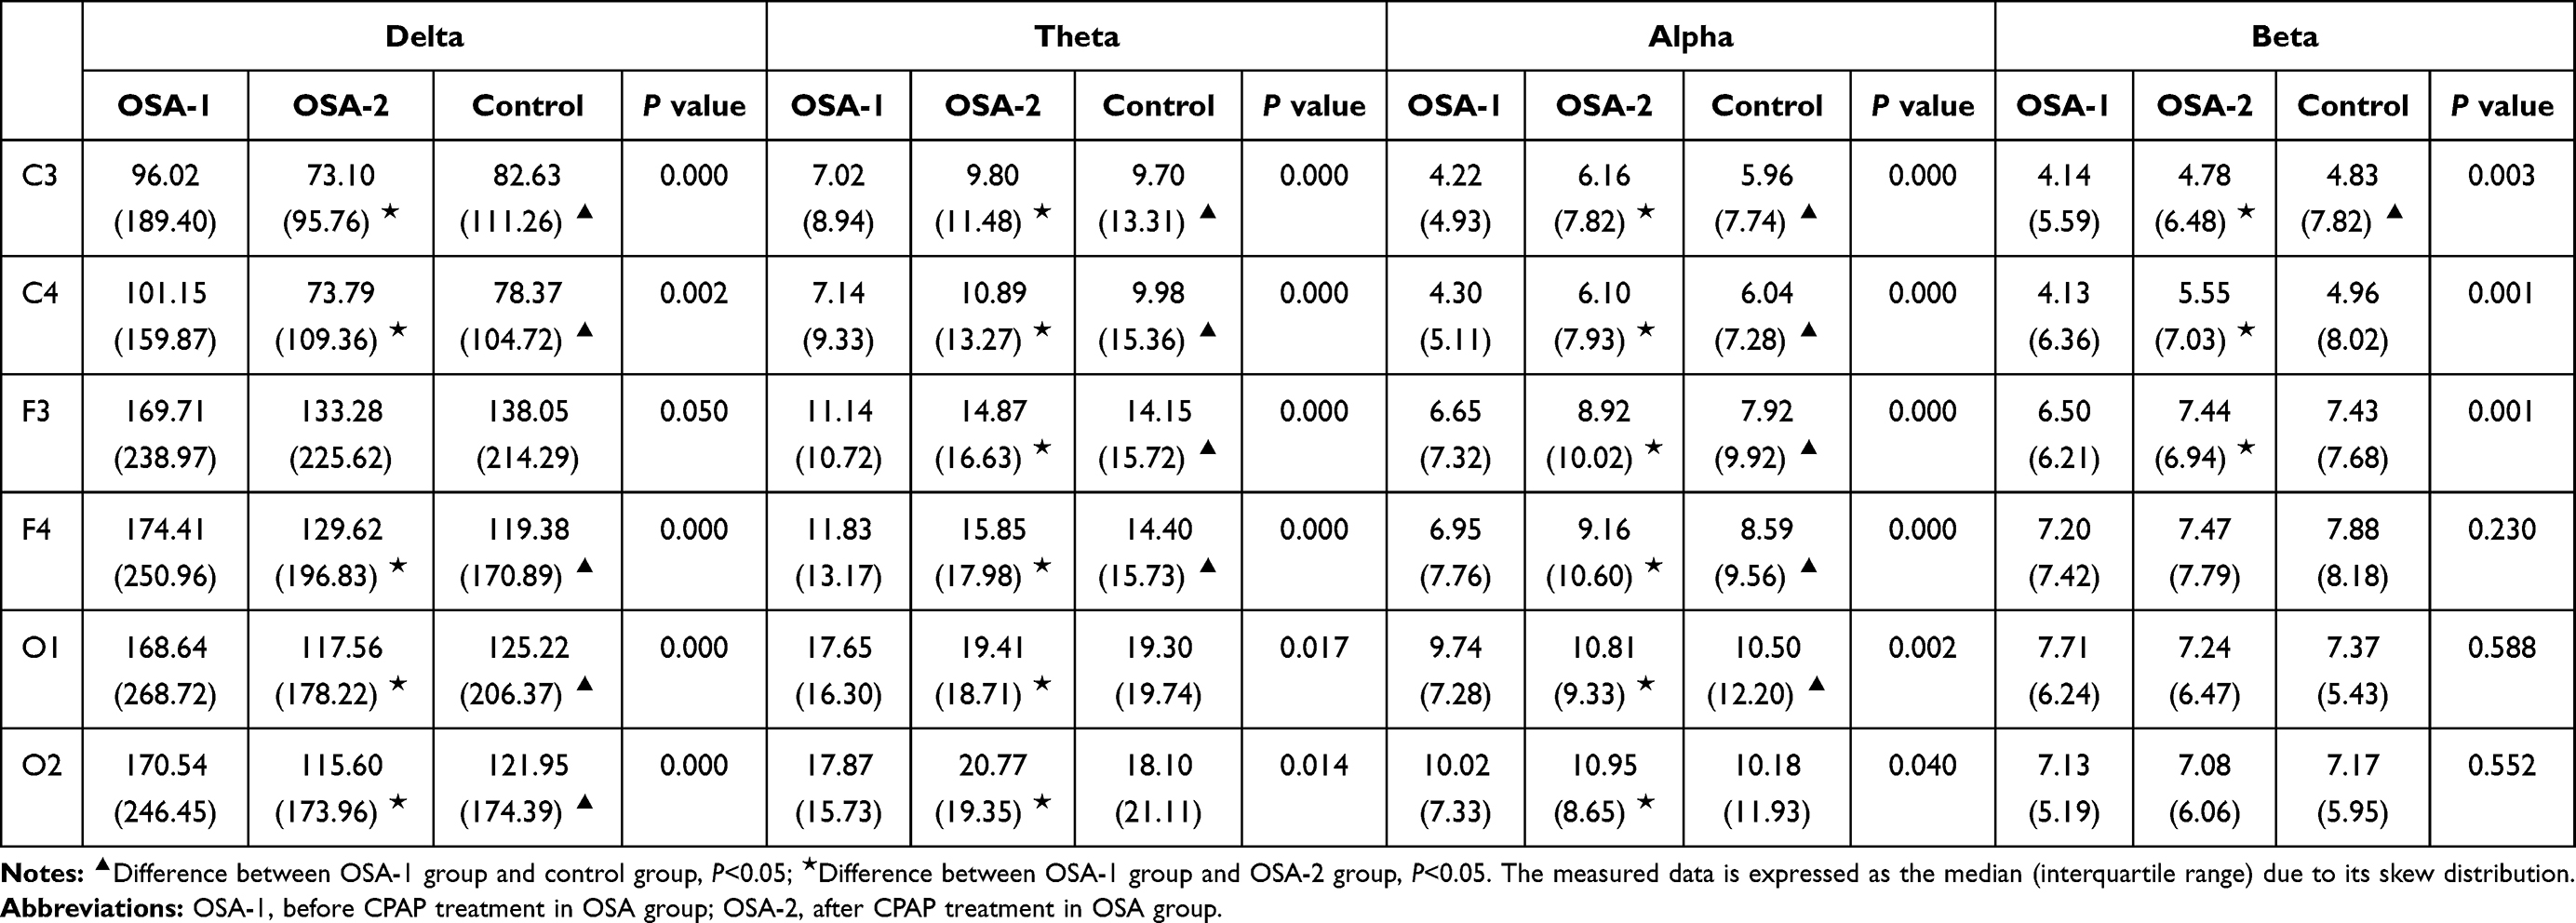 |
Table 3 Absolute Power of Each Frequency Band of EEG in the OSA Group or Control Group (μV2) |
 |
Table 4 DAR and TSR on Different Channels of EEG in the OSA Group and Control Group |
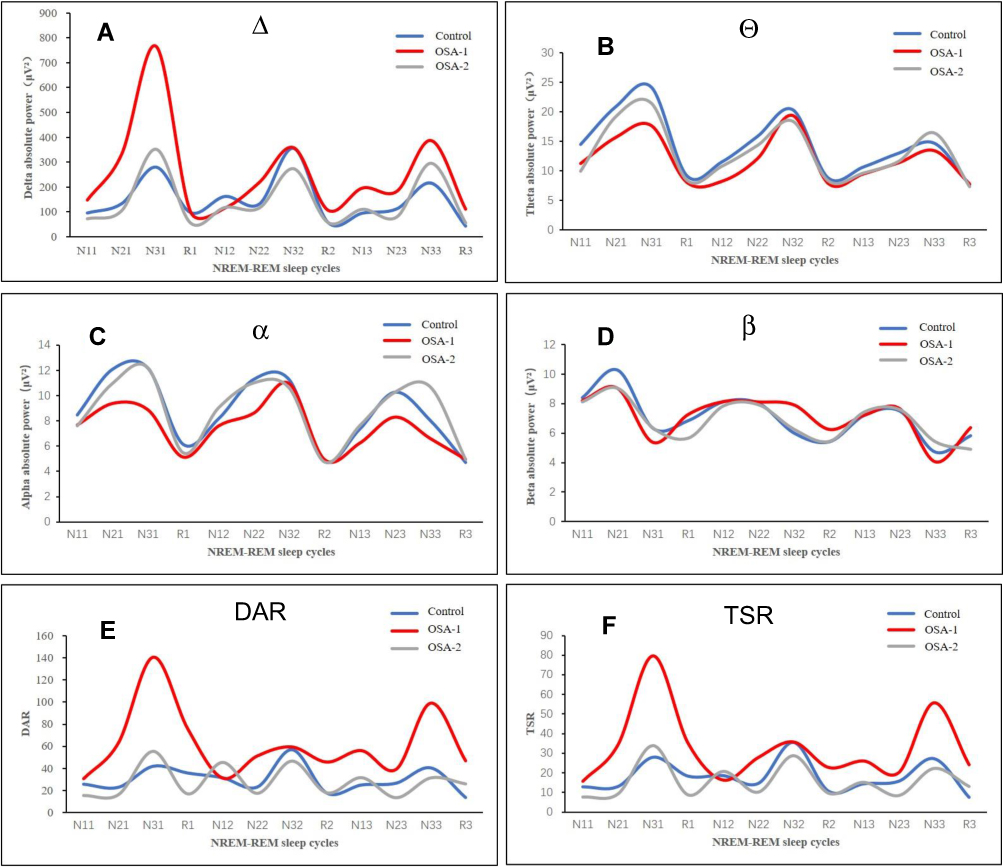 |
Figure 2 Quantitative analysis of absolute powers of channel C3 in the first three NREM-REM sleep cycles in the OSA group and control group (A-F). Notes: N11 refers to the N1 period in the first sleep cycle, N21 refers to the N2 period in the first sleep cycle, N12 refers to the N1 period in the second sleep cycle, and so on. Because the number of sleep cycles for each subject was not equal, only the data of the first three sleep cycles were counted. |
Correlation Analyses
Table 5 lists the results of the correlation between PSG and EEG parameters on the first night of all subjects and questionnaire scores. Sleep efficiency, sleep latency, RRMAI, AHI, ODI, TS90%, LSaO2, longest time of apnea, and the average absolute power of Delta, DAR, and TSR were related to the ESS score (P < 0.05). All parameters of PSG and EEG power had no correlation with the PSQI score (P > 0.05). In terms of cognitive function, the MMSE and MoCA scores were negatively correlated with the proportion of N1 sleep but not with the average absolute power, DAR or TSR of each band (P > 0.05). In addition, the MMSE score was correlated with total sleep time, the proportion of N3 sleep, RRMAI and AHI, while the MoCA score was correlated with TS90% and LSaO2.
 |
Table 5 Questionnaire Score Correlations with PSG and EEG Parameters |
Discussion
This research investigated the frequency power characteristics of nocturnal EEG in middle-aged patients with moderate to severe OSA. It analyzed its relationship with the neurocognitive function questionnaire and also demonstrated the influence of CPAP on it. Our main conclusions were that patients with OSA had greater slow frequency EEG activity during sleep than the control group. Treatment with CPAP reversed the slow frequency EEG activity and normalized it in patients with OSA. The slow frequency EEG activity was correlated with the ESS score.
EEG can record electrophysiological changes related to the cerebral cortex. It provides rich biological information on the study of sleep structure and the sleep quality of OSA patients. However, the EEG signals routinely collected by PSG have not been fully utilized. There have been a number of studies that have analyzed the EEG power of OSA,17,18 but the results of the studies were not consistent. One of the reasons is that there was no unified standard for the sampling method of EEG signals or the definition of the frequency spectrum. The interferences from repeated arousal and respiratory disorders during sleep also cause certain difficulties for further analysis of EEG in OSA patients.19 In many studies, EEG spectrum power analysis was performed during the whole sleep period, or only in the NREM or REM period.20 However, the dynamic changes in the EEG spectrum at night and the influence of sleep structure on it have been ignored.
In this study with an increased sample size, we tried to standardize the entire sleep process based on sleep cycles. At the same time, the dynamic changes in sleep EEG were compared in different frequency bands between the OSA and control subjects. After CPAP, the slow frequency EEG activity was reduced in the OSA group. This indicated that CPAP might help its return to relative normalization. Figure 2 shows the different trends of the EEG spectrum among the three groups, reflecting the therapeutic effect of CPAP. This was consistent with the results of an earlier study,21 but only 10 subjects were included in that study. They did not compare the difference between the control group and the OSA group after CPAP treatment. Although there have been large sample studies,22 only the EEG signals in channel F4-M1 have been analyzed. We compared the differences between the different channels.
The results showed that the absolute power of EEG was significantly different in each band of the C3 channel (P < 0.01). This might suggest that the EEG signal of the C3 channel can better reflect the difference between the OSA and control groups. This study also further statistically compared the DAR and TSR of each channel, and there were significant differences between the three groups (P < 0.01). At the same time, we also showed the dynamic changes in DAR and TSR, confirming similar trends between them. Both of them could be used as indicators of slow frequency EEG activity in clinical practice, but the calculation of DAR may be relatively simple.
Multiple studies have suggested that EEG power may be a clinical biomarker to measure neurocognitive function in OSA patients.23 However, in the current clinical work, the determination of cognitive function mostly relied on clinical symptoms and cognitive function questionnaires. Therefore, we wanted to know whether there is a certain correlation between EEG power and cognitive function questionnaires. Many studies have not described the relationship between EEG power and scores on cognitive function questionnaires, such as the MoCA. In this study, the differences in MMSE and MOCA scores were statistically significant at baseline between the OSA group and the control group. However, they had no correlation with the average absolute power of each frequency band, DAR or TSR. We found this result to be confusing. Was the EEG power related to the specific item scores of these questionnaires, but not the total scores?
We further analyzed the correlation between the EEG power of each frequency band and the scores of specific items such as short-term memory, executive functions and visuospatial abilities in the MoCA questionnaire. The results were similar, although no statistically significant correlation was found. The reasons may be as follows: the sample size was still small; the subjects were middle-aged people with only mild cognitive impairment; the MoCA and MMSE scores were relatively subjective and had a relatively poor sensitivity to OSA disease in the early stage, and so on. In fact, many studies have suggested that OSA can lead to changes in brain morphology and connectivity in the resting state.24,25 Patients with OSA may have a wide range of cognitive dysfunction, including attention, memory and executive function. There is often a lack of correlation between changes in the brain and differences in neuropsychological measurements.26 Therefore, future research may need to choose more objective methods to confirm whether slow-frequency EEG activity indicators (such as DAR and TSR) can be used as biomarkers of cognitive function in patients with OSA.
Numerous studies have reported a relationship between EEG power and daytime sleepiness.10,27,28 This study also found a correlation between the ESS score and the average absolute power of delta and DAR (P < 0.05). This confirmed that slow frequency EEG activity may be a clinical biomarker of daytime sleepiness. The results suggested that CPAP improved and stabilized the sleep structure, which was directly related to the improvement of intermittent hypoxia and sleep fragmentation. This change was consistent with improvements in attention adjustment and working memory.29,30 As shown in Figure 2, CPAP can improve and reverse slow-frequency EEG activity in patients with OSA. This result might objectively confirm the clinical status of CPAP therapy, which has practical significance for improving compliance and enhancing the understanding of the disease. It should be noted that lack of CPAP compliance was a major factor in many studies that have identified inconsistencies in whether CPAP improves cognitive function in OSA patients.31,32
Of course, there were still some deficiencies. First, only the EEG power on the first night of CPAP treatment after pressure titration was studied. Second, the sample size was larger than that of most previous studies, but patients with mild OSA were not included, and the differences between patients with moderate and severe OSA were not analyzed separately. A correlation cannot be ruled out between the EEG power and cognitive function questionnaire after expanding the sample size. The multiple sleep latency test (MSLT) was not used to measure daytime sleepiness, and the influence of the carbon dioxide factor on EEG was not understood or analyzed. At the same time, there is no relatively objective method available to evaluate cognitive function. Taking into account the repeatability of these questionnaires, the cognitive function of the OSA patients after CPAP was not measured repeatedly. Because the time interval between the two questionnaires is too short, the subject’s memory factors may have an impact on the results.
In the future, we can consider further studying the differences in EEG in OSA and other disease groups, such as idiopathic hypersomnia, obesity hypoventilation syndrome. At the same time, we also hope to further study their relationship with sleepiness.
Conclusion
In summary, although there were many deficiencies in this study, it also provided useful information. This paper not only presented the clinical methods of DAR and TSR but also presented the results of CPAP in reversing the slow frequency EEG activity of OSA patients. It also provided useful research materials for guiding the clinical treatment of OSA, improving compliance with treatment, and enhancing our understanding of the disease.
Funding
This study was funded by the Natural Science Foundation of China (Grant number: NSFC81770085, 82070095) and the Discipline Construction Program of the Second Affiliated Hospital of Soochow University (Grant number: XKTJ-TD202003).
Disclosure
Jianhua Wang and Juan Xu are co-first authors for this study. The authors have no potential conflicts of interest in this work.
References
1. Garvey JF, Pengo MF, Drakatos P, et al. Epidemiological aspects of obstructive sleep apnea. J Thorac Dis. 2015;7:920–929.
2. Roeder M, Bradicich M, Schwarz EI, et al. Night-to-night variability of respiratory events in obstructive sleep apnoea: a systematic review and meta-analysis. Thorax. 2020;75:1095–1102.
3. Morsy NE, Farrag NS, Zaki NFW, et al. Obstructive sleep apnea: personal, societal, public health, and legal implications. Rev Environ Health. 2019;34:153–169.
4. Heilbrunn E, Ssentongo P, Chinchilli VM, et al. Sudden death in individuals with obstructive sleep apnea: protocol for a systematic review and meta-analysis. BMJ Open. 2020;10:e39774.
5. Salman LA, Shulman R, Cohen JB. Obstructive sleep apnea, hypertension, and cardiovascular risk: epidemiology, pathophysiology, and management. Curr Cardiol Rep. 2020;22:6.
6. Bucks RS, Olaithe M, Eastwood P. Neurocognitive function in obstructive sleep apnea: a meta-review. Respirology. 2013;18:61–70.
7. Ferini-Strambi L, Lombardi GE, Marelli S, et al. Neurological deficits in obstructive sleep apnea. Curr Treat Option Ne. 2017;19:1–13.
8. Mullins AE, Kam K, Parekh A, et al. Obstructive sleep apnea and its treatment in aging: effects on Alzheimer’s disease biomarkers, cognition, brain structure and neurophysiology. Neurobiol Dis. 2020;145:105054.
9. D’Rozario AL, Cross NE, Vakulin A, et al. Quantitative electroencephalogram measures in adult obstructive sleep apnea - Potential biomarkers of neurobehavioural functioning. Sleep Med Rev. 2017;36:29–42.
10. Lee SD, Ju G, Kim J, et al. Improvement of EEG slowing in OSAS after CPAP treatment. J Psychosom Res. 2012;73:126–131.
11. Sivam S, Poon J, Wong KKH, et al. Slow-frequency electroencephalography activity during wake and sleep in obesity hypoventilation syndrome. Sleep. 2020;43:1–9.
12. Alshaer H, Pandya A, Zivanovic I, et al. The effect of continuous positive airway pressure on spectral encephalogram characteristics in stroke patients with obstructive sleep apnea. Respir Physiol Neurobiol. 2018;249:62–68.
13. Johns MW. A new method for measuring daytime sleepiness: the Epworth sleepiness scale. Sleep. 1991;14:540–545.
14. Buysse DJ, Reynolds CF, Monk TH, et al. The Pittsburgh sleep quality index: a new instrument for psychiatric practice and research. Psychiat Res. 1989;28:193–213.
15. Folstein MF, Folstein SE, McHugh PR. Mini-mental state. J Psychiatr Res. 1975;12:189–198.
16. Berry RB, Brooks R, Gamaldo C, et al. AASM scoring manual updates for 2017 (Version 2.4). J Clin Sleep Med. 2017;13:665–666.
17. Vakulin A, Rozario D, Kim J, et al. Quantitative sleep EEG and polysomnographic predictors of driving simulator performance in obstructive sleep apnea. Clin Neurophysiol. 2016;127:1428–1435.
18. Uddin MB, Su SW, Chen W, et al. Dynamic changes in electroencephalogram spectral power with varying apnea duration in older adults. J Sleep Res. 2019;28:e12850.
19. Huang S, Wang T, Zhang X, et al. The correlations between electroencephalogram frequency components and restoration of stable breathing from respiratory events in sleep apnea hypopnea syndrome. Resp Physiol Neurosci. 2018;258:91–97.
20. Mullins AE, Kim JW, Wong KKH, et al. Sleep EEG microstructure is associated with neurobehavioural impairment after extended wakefulness in obstructive sleep apnea. Sleep Breath. 2020;25(1):347–354.
21. Heinzer RL, Gaudreau H, Décary A, et al. Slow-wave activity in sleep apnea patients before and after continuous positive airway pressure treatment: contribution to daytime sleepiness. Chest. 2001;119:1807–1813.
22. Appleton SL, Vakulin A, Rozario D. A, et al. Quantitative electroencephalography measures in rapid eye movement and nonrapid eye movement sleep are associated with apnea-hypopnea index and nocturnal hypoxemia in men. Sleep. 2019;42:1–9.
23. Jones SG, Riedner BA, Smith RF, et al. Regional reductions in sleep electroencephalography power in obstructive sleep apnea: a high-density EEG Study. Sleep. 2014;37:399–407.
24. Yeung AWK. Morphometric and functional connectivity changes in the brain of patients with obstructive sleep apnea: a meta-analysis. J Sleep Res. 2019;28:e12857.
25. Song X, Roy B, Kang DW, et al. Altered resting-state hippocampal and caudate functional networks in patients with obstructive sleep apnea. Brain Behav. 2018;8:e994.
26. Caporale M, Palmeri R, Corallo F, et al. Cognitive impairment in obstructive sleep apnea syndrome: a descriptive review. Sleep Breath. 2020;25:29–40.
27. Wang D, Bai XX, Williams SC, et al. Modafinil increases awake EEG activation and improves performance in obstructive sleep apnea during continuous positive airway pressure withdrawal. Sleep. 2015;38:1297–1303.
28. Poon JJY, Chapman JL, Wong KKH, et al. Intra-individual stability of NREM sleep quantitative EEG measures in obstructive sleep apnea. J Sleep Res. 2019;28:e12838.
29. Rosenzweig I, Glasser M, Crum WR, et al. Changes in neurocognitive architecture in patients with obstructive sleep apnea treated with continuous positive airway pressure. Ebiomedicine. 2016;7:221–229.
30. Ferrarelli F, Kaskie R, Laxminarayan S, et al. An increase in sleep slow waves predicts better working memory performance in healthy individuals. Neuroimage. 2019;191:1–9.
31. Zhou J, Camacho M, Tang X, et al. A review of neurocognitive function and obstructive sleep apnea with or without daytime sleepiness. Sleep Med. 2016;23:99–108.
32. Jackson ML, McEvoy RD, Banks S, et al. Neurobehavioral impairment and CPAP treatment response in mild-moderate obstructive sleep apnea. J Clin Sleep Med. 2018;14:47–56.
33. Greneche J, Krieger J, Bertrand F, et al. Effect of continuous positive airway pressure treatment on the subsequent EEG spectral power and sleepiness over sustained wakefulness in patients with obstructive sleep apnea-hypopnea syndrome. Clin Neurophysiol. 2011;122:958–965.
 © 2021 The Author(s). This work is published and licensed by Dove Medical Press Limited. The
full terms of this license are available at https://www.dovepress.com/terms
and incorporate the Creative Commons Attribution
- Non Commercial (unported, 3.0) License.
By accessing the work you hereby accept the Terms. Non-commercial uses of the work are permitted
without any further permission from Dove Medical Press Limited, provided the work is properly
attributed. For permission for commercial use of this work, please see paragraphs 4.2 and 5 of our Terms.
© 2021 The Author(s). This work is published and licensed by Dove Medical Press Limited. The
full terms of this license are available at https://www.dovepress.com/terms
and incorporate the Creative Commons Attribution
- Non Commercial (unported, 3.0) License.
By accessing the work you hereby accept the Terms. Non-commercial uses of the work are permitted
without any further permission from Dove Medical Press Limited, provided the work is properly
attributed. For permission for commercial use of this work, please see paragraphs 4.2 and 5 of our Terms.