Back to Journals » Neuropsychiatric Disease and Treatment » Volume 12
Electroencephalogram characteristics in patients with chronic fatigue syndrome
Authors Wu T, Qi X, Su Y, Teng J, Xu X
Received 22 July 2015
Accepted for publication 18 November 2015
Published 28 January 2016 Volume 2016:12 Pages 241—249
DOI https://doi.org/10.2147/NDT.S92911
Checked for plagiarism Yes
Review by Single anonymous peer review
Peer reviewer comments 2
Editor who approved publication: Professor Wai Kwong Tang
Tong Wu,1 Xianghua Qi,1 Yuan Su,2 Jing Teng,1 Xiangqing Xu1
1Internal Medicine-Neurology, Shandong Provincial Traditional Chinese Medical Hospital, 2School of Mathematic and Quantitative Economics, Shandong University of Finance and Economics, Jinan, People’s Republic of China
Objective: To explore the electroencephalogram (EEG) characteristics in patients with chronic fatigue syndrome (CFS) using brain electrical activity mapping (BEAM) and EEG nonlinear dynamical analysis.
Methods: Forty-seven outpatients were selected over a 3-month period and divided into an observation group (24 outpatients) and a control group (23 outpatients) by using the non-probability sampling method. All the patients were given a routine EEG. The BEAM and the correlation dimension changes were analyzed to characterize the EEG features.
Results: 1) BEAM results indicated that the energy values of δ, θ, and α1 waves significantly increased in the observation group, compared with the control group (P<0.05, P<0.01, respectively), which suggests that the brain electrical activities in CFS patients were significantly reduced and stayed in an inhibitory state; 2) the increase of δ, θ, and α1 energy values in the right frontal and left occipital regions was more significant than other encephalic regions in CFS patients, indicating the region-specific encephalic distribution; 3) the correlation dimension in the observation group was significantly lower than the control group, suggesting decreased EEG complexity in CFS patients.
Conclusion: The spontaneous brain electrical activities in CFS patients were significantly reduced. The abnormal changes in the cerebral functions were localized at the right frontal and left occipital regions in CFS patients.
Keywords: electrical activities, brain electrical activity mapping, nonlinear dynamical analysis
Introduction
Chronic fatigue syndrome (CFS) was defined by the US Centers for Disease Control and Prevention in 1994 as a debilitating and complex disorder characterized by persistent and profound fatigue and other specific symptoms, such as insomnia and headaches that continue for a minimum of 6 months in adults (and 3 months in children or adolescents).1 One of the major causes of CFS is mental stress. In addition, smoking, excessive drinking, unhealthy diet and lifestyle, as well as lack of exercise and psychological counseling, may aggravate CFS progression. The quality of life is detrimentally affected by extreme fatigue in CFS patients. Patients who suffer from the persistent or recurring fatigue may jeopardize their occupational and/or cognitive ability, which may eventually lead to physiologic diseases and/or psychological disorders. The number of CFS patients is increasing; however, detailed electroencephalogram (EEG) characteristics in CFS patients are still unclear.
Brain electrical activity mapping (BEAM), also called quantitative EEG or EEG imaging, is a diagnostic technique used to analyze the changes in brain activities. This technique uses electronic computations to represent average energy values or wattage values of each recorded point. The wattage values between the recorded points are calculated by two-dimensional interpolations. BEAM indicates the power distribution in a flat surface and has the advantage of being quantifiable, visible, and repeatable; therefore, it is an ideal method for the evaluation of brain function and the diagnosis of brain diseases. Hence, it is widely used in the clinical and scientific research of neurological disorders.
With the development of systematology and nonlinear dynamical theory, modern science postulates that EEG signals are nonlinear couplings of numerous neuronal activities; therefore, EEG signals have the characteristics of deterministic chaos.2 The brain is a complex and self-organized nonlinear dynamical system;3 therefore, nonlinear dynamical analysis, but not linear analysis, should be used to analyze the neural network function.4 The application of nonlinear dynamical analysis provides information about the changes in the brain functional activity and improves the sensitivity of EEG in detecting subtle brain abnormalities; thus, it is a breakthrough in the EEG field.5
In this study, we analyzed the original EEG data using correlation dimension (D2) as an index. D2 extracts dimensional information from univariate time series, represents the system density in a multidimensional space, and reflects the correlation degree of the system points. D2 is also a parameter for the description of chaotic freedom and a means for the measurement of the geometrical features of attractors. D2 generates the lower limit of the freedom value and reflects the complexity of dynamic process. The higher the D2 is, the more complex the detected EEG signals are.
Previous studies have collected EEG data from sleep or awake states in CFS patients.6–11 Evidence shows that EEG theta power was higher in CFS patients during an awakened state.10,11 To date, there is no study on BEAM and EEG nonlinear dynamical analysis in CFS patients during an awakened state. In this study, we focus on the patterns of brain electrical activity and the brain functional subregions in CFS patients by applying the most advanced EEG analysis to analyze the brain functional state, and to provide objective evidence for the diagnosis and treatment of CFS.
Materials and methods
Patients
This study was conducted with the approval of the Ethics Committee of the Subsidiary Hospital of Shandong University of Traditional Chinese Medicine, and written informed consent was obtained from all participants. The rating of Hamilton Depression Rating Scale (HAMD) and Hamilton Anxiety Scale (HAMA) was performed by a qualified psychological counselor, who was blinded to the experiment.
The inclusion criteria
The inclusion criteria were adopted from the diagnostic criteria of CFS published by the US Centers for Disease Control and Prevention in 1994.12
Patients had severe persistent or recurring fatigue without definite causes for more than 6 months. In addition, the patients’ occupational ability, cognitive ability, personal life and social activity decreased significantly, which could not be relieved by resting.
Patients suffered from at least four of the following eight symptoms: reduced memory or concentration level; pharyngalgia; neck stiffness or axillary lymph node enlargement; muscle pain; multiple joint pain; recurrent headaches; poor sleep quality and not feeling refreshed after sleep; myalgia after exertion.
Patients suffered from fatigue caused by a number of factors other than the causes of protopathy.
The exclusion criteria
The depressive and/or anxiety disorders in the study were diagnosed by the International Classification of Diseases, 10th revision (ICD)-10. The total score (24 items) of HAMD was ≥20, while the total score (14 items) of HAMA was ≥14 to exclude the patients with anxiety and depression.
Patients with severe primary diseases, including cardiovascular and cerebrovascular diseases, pneumonopathy, hepatopathy, nephropathy and hematopoietic system diseases were also excluded.
The grouping criteria
- The inclusion criteria for observation group: those who met the earlier diagnostic criteria of CFS while complying with the exclusion criteria at the same time.
- The inclusion criteria for control group: those who had no physiologic diseases or psychological disorders, and did not meet the earlier diagnostic criteria of CFS at the same time.
The rejection criteria
This criteria included: 1) The patients whose diseases deteriorated severely after being included. 2) The patients who showed low compliance. 3) The patients who no longer met the inclusion criteria.
The dropping criteria
Those who quit or failed to finish the experiment were considered as dropouts.
Research instrument
Sixteen-channel electroencephalograph and electrode cap (Nihon Kohden Corporation, Shanghai, People’s Republic of China) were used in this study. Sixteen-channel EEG signals were stored and recorded according to the international standards of the lead 10–20 system. Reference electrodes were placed on the earlobes, and a ground electrode was placed on the center of the forehead. The electrode impedance was <2 kO, the sensitivity of amplifier was 5 mm/50 μV, and the band-pass was 1–30 hippocampal EEG.
Experimental condition
The examinations were carried out in a shielded, soundproof room without music and pictures. The subjects were seated on a soft chair in a relaxed state, but were awake and concentrating. Before the EEGs were collected, all the subjects were informed to stay alert. It was required that none of the subjects drank alcohol, espresso or strong tea, etc before the experiment and had sufficient sleep the night before the experiment. All the examinations were carried out between 8 and 10 am.
Analysis method
The analysis of the BEAM was performed by referring to the formal classification diagnosis requirements proposed by the American Electroencephalographic Society in 1986.13 Five-minute EEG data were collected and intercepted into successive and representative 0.5-minute non-artifact data, followed by a 0.5–35 Hz digital filtering, and then the EEG data were used in the frequency analysis. The signals were transferred to a color coded map after being amplified and averaged. The differences in the wattage values were indicated by different colors. The data of wattage values were inputted into an Excel workbook.
The calculation of correlation dimension was based on Grassberger–Procaccia Algorithm14 and was divided into three steps: 1) mean value, variance, and retardation were calculated first. The system orbit in state space was reestablished via the studied time series. M-dimensional vector V (i) was reconstructed via embedding dimension and delaying time method (Takens’ reconstruction). 2) Vector distance, the maximum vector distance, the minimum vector distance and the correlation integral C(r) were calculated. 3) The linear segment between logC(r)/log(r) was plotted, and the slope of the fitted line of linear segment was calculated. The calculated slope was defined as the correlation dimension D2. MATLAB7.0 (MathWorks Corporation, MA, USA) was used to run the self-compiled calculation steps. The correlation dimension was automatically generated after the trial test (M-dimensional phase space at 2, 3, 4, 5, 6, 7, 8, and 9, respectively).
Statistical analysis
Data were analyzed using SPSS 17.0 (SPSS Inc., Chicago, IL, USA) for Windows software. Data were expressed as mean ± standard deviation. Unpaired Student’s t-test was used to compare the difference between two groups. P<0.05 was considered statistically significant.
Results
Patients’ characteristics
One hundred and fifty Han nationality outpatients, male and female, of the Subsidiary Hospital of Shandong University of Traditional Chinese Medicine were selected by using non-probability sampling method and were successively monitored during the 3 months of examination. All the patients (age ranged from 25 years to 40 years) had received at least formal primary education.
One hundred and three people dropped out of the study during the process. The observation group was composed of 24 CFS patients and the control group was composed of 23 healthy people. In the observation group, the average score of HAMD was 15 and the average score of HAMA was 9. The sex composition of the two groups is shown in Table 1. The age distribution and average age of the two groups are shown in Table 2. There is no statistically significant difference in age and sex between these two groups (P>0.05).
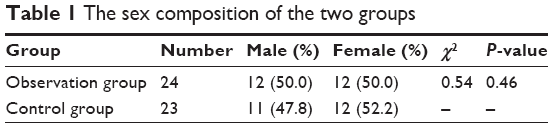 | Table 1 The sex composition of the two groups |
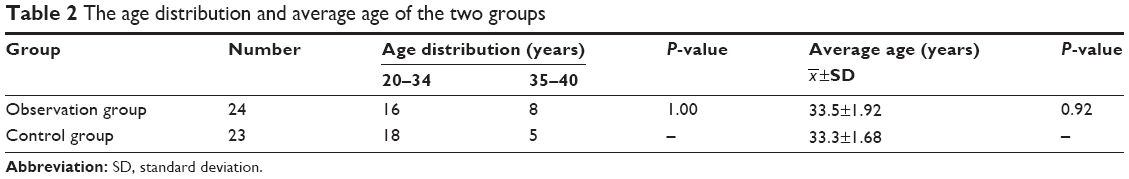 | Table 2 The age distribution and average age of the two groups |
The BEAM characteristics
The pattern of BEAM
The BEAM images of healthy controls and CFS patients were acquired under the same experimental conditions. In healthy controls, the maximum power was α, which was distributed in the occipital lobe and had a bilateral symmetry (Figure 1). In CFS patients, the maximum power was θ, the power number was ≥α and ≤2α, which was distributed in the frontal lobe without bilateral symmetry. The power in the right lobe exceeded the left lobe (Figure 2). The BEAM results indicate that the energy value of θ wave in CFS patients exceeded that of the healthy controls, which suggests that the brain electrical activities in CFS patients were reduced and stayed in an inhibitory state.
 | Figure 1 The brain electrical activity mapping (BEAM) of healthy controls. |
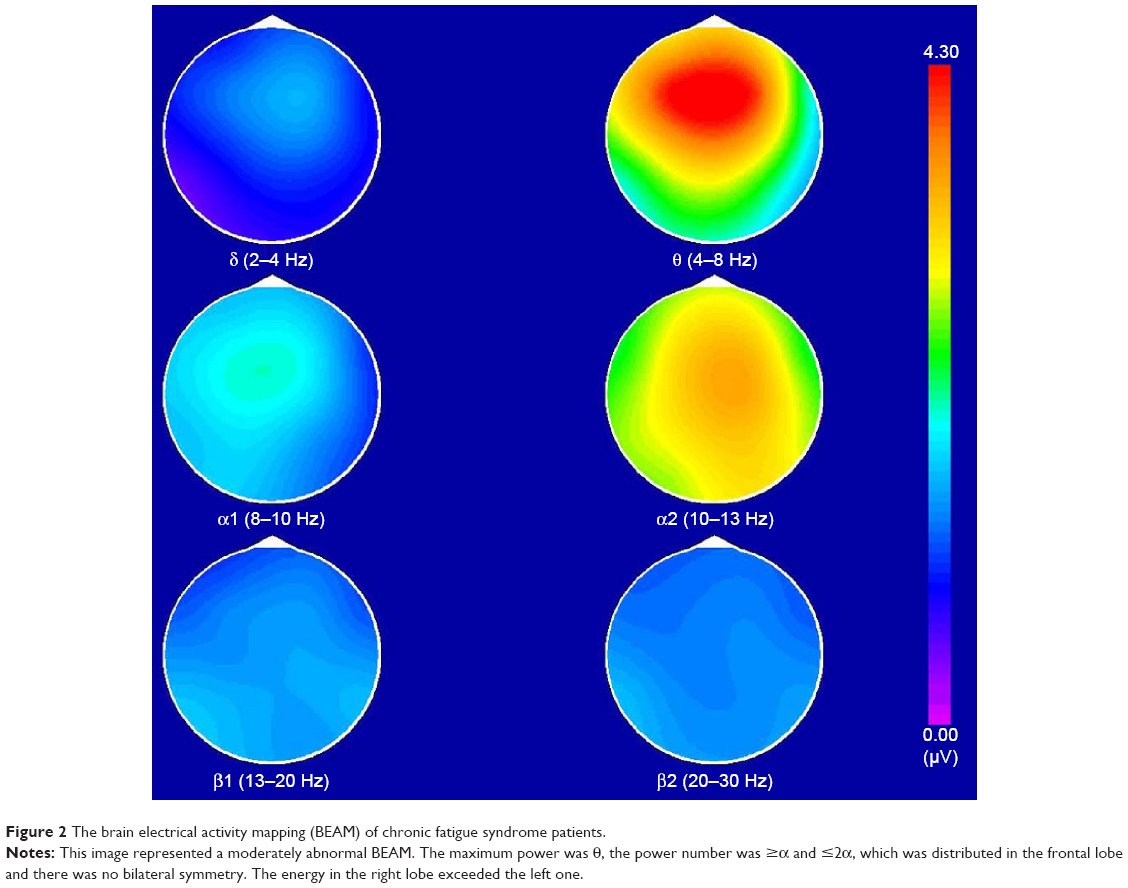 | Figure 2 The brain electrical activity mapping (BEAM) of chronic fatigue syndrome patients. |
The comparison of energy values in different encephalic regions
The comparison of energy values in 84 encephalic regions between these two groups is shown in Table 3. The results indicate that there were differences in the energy values of δ, θ, and α1 waves. The energy values of the observation group exceeded that of the control group, which indicates that the brain electrical activities in the CFS patients were significantly reduced. There was no difference in β1 (F7 was excluded) and β2, two wave patterns with high representing frequency. The wave patterns of different frequencies were as follows:
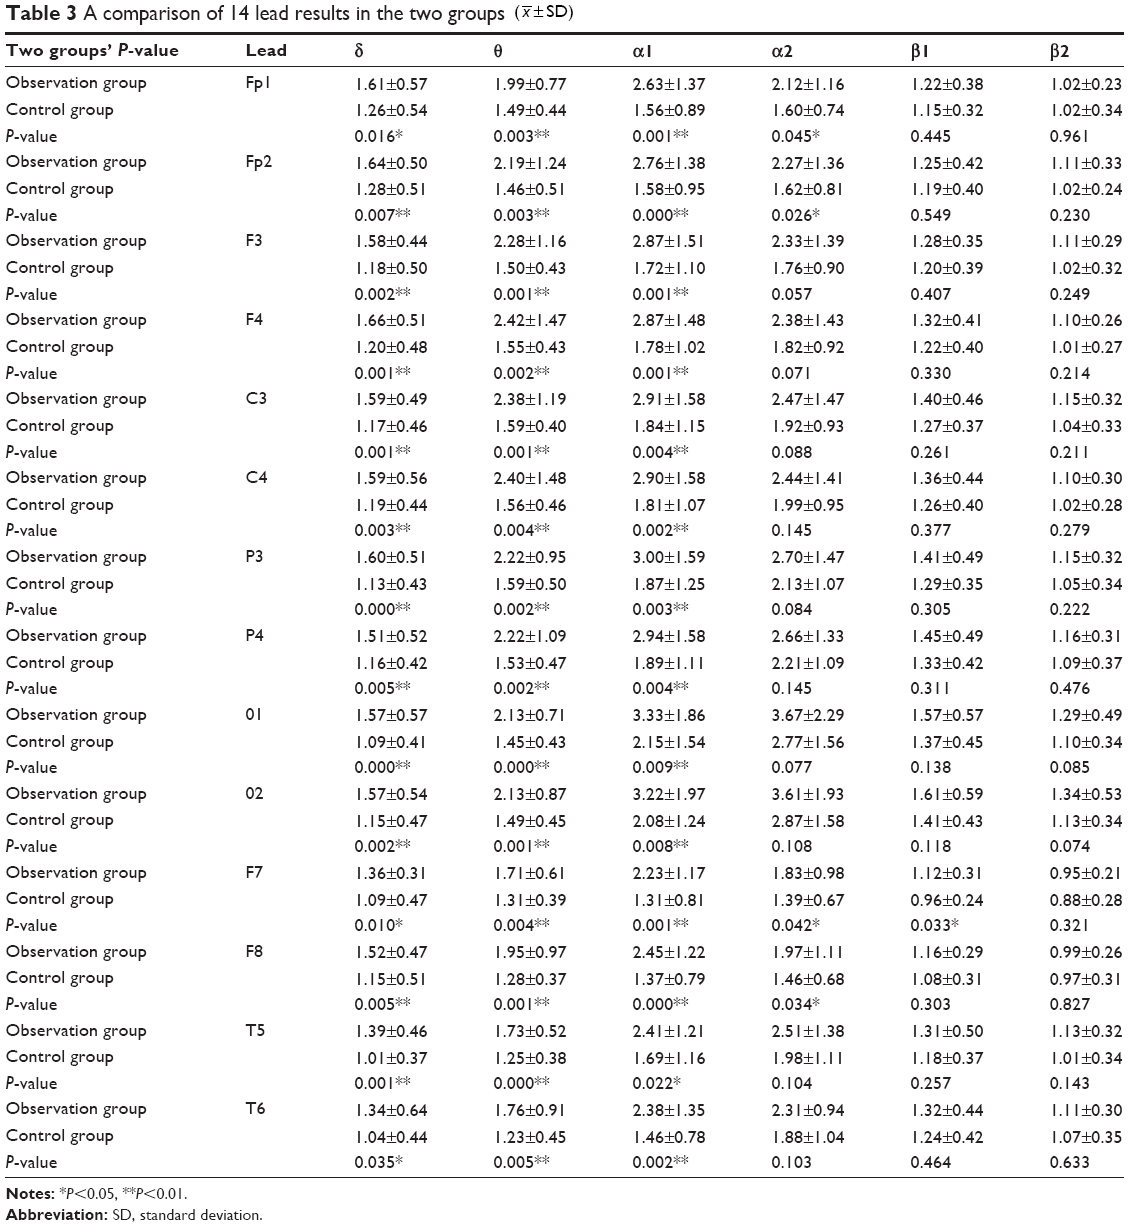 | Table 3 A comparison of 14 lead results in the two groups ( |
 ±SD)
±SD)- The analysis of the δ wave energy value – the highest and the second highest energy values of δ wave in the observation group were in the right postfrontal and right prefrontal brain regions, respectively. The highest and the second highest energy values of δ wave in the control group were in the right prefrontal and the right postfrontal brain regions, respectively. The energy values of the observation group exceeded that of the control group. There was a significant difference between these two groups, which suggests that the CFS patients had the highest δ wave energy value in the right frontal area. These results indicate that there was a significant increase of the slow brain electrical activities in the right frontal area in CFS patients.
- The analysis of the θ wave energy value – the highest θ wave energy value in the observation group was at the right postfrontal brain region, while the highest energy value of the θ wave in the control group was at the left area centralis. The energy values of the observation group exceeded that of the control group, which indicates that the slow brain electrical activities were increased in the right postfrontal brain region in CFS patients.
- The analysis of the α wave energy value – the highest α1 wave energy value in the observation group was in the left occipital region, while the highest α1 wave energy value in the control group was also in the left occipital region. The α1 wave energy value in the observation group significantly exceeded that of the control group, which indicates that the slow brain electrical activities were increased in the left occipital region in CFS patients. The highest and the second highest energy values of α2 wave in the observation group were in the left occipital region and the right occipital region, respectively. The highest and the second highest energy values of α2 wave in the control group were in the right occipital region and the left occipital region, respectively. There was no significant difference between these two groups. However, there were significant differences between these two groups in the α2 wave energy values in the prefrontal area (left and right prefrontal area) and anterior temporal region (left and right anterior temporal region). The energy value of the observation group significantly exceeded that of the control group, which suggests that the slow brain electrical activities were increased in the frontal area and regions temporalis in CFS patients.
- The analysis of the β wave energy value – the highest β1 wave energy values in these two groups were all in the right occipital region, and there was no significant difference between these two groups. The energy value in the left anterior temporal region in the observation group exceeded that of the control group, which indicates that the brain electrical activities were increased in the left anterior temporal region in the CFS patients. The highest β2 wave energy values of these two groups were all in the right occipital region, and there was no significant difference between these two groups. The β1 and β2 wave energy values were lower, compared with the α1 and α2 wave energy values, which indicates that α wave was the dominant wave in the occipital region.
The aforementioned results indicate that there was no significant difference in the brain electrical energy value distribution in the CFS patients, which is consistent with previous studies. However, the energy value of the CFS patients was different in the right frontal area and left occipital region, compared with healthy controls.
The nonlinear dynamical analysis
The comparison of the correlation dimension between the observation group and the control group is shown in Table 4. Based on the different m values of 2–9, the mapping results indicate that the scale-free zone slope of logC(r)/log(r) curve was more stable when m≥7. The slopes were similar at the m values of 7, 8, and 9, which indicate that D2 value could be accurately defined at m≥7 (Figure 3). The m=8 was chosen for the statistical analysis of the correlation dimension. We found that there was a significant difference between these two groups (P=0.019) (Table 4). The D2 value of the observation group was significantly lower than that of the control group, which demonstrates that the intensity and complexity of brain electrical signals were significantly lower in the observation group.
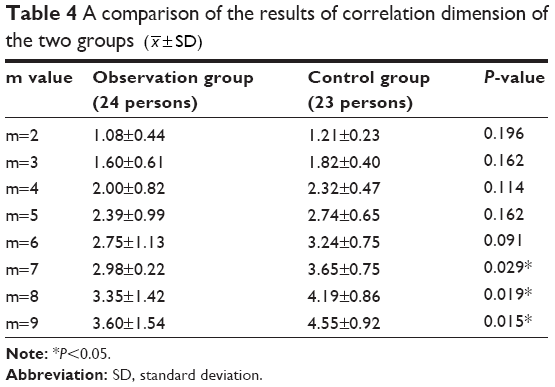 | Table 4 A comparison of the results of correlation dimension of the two groups ( |
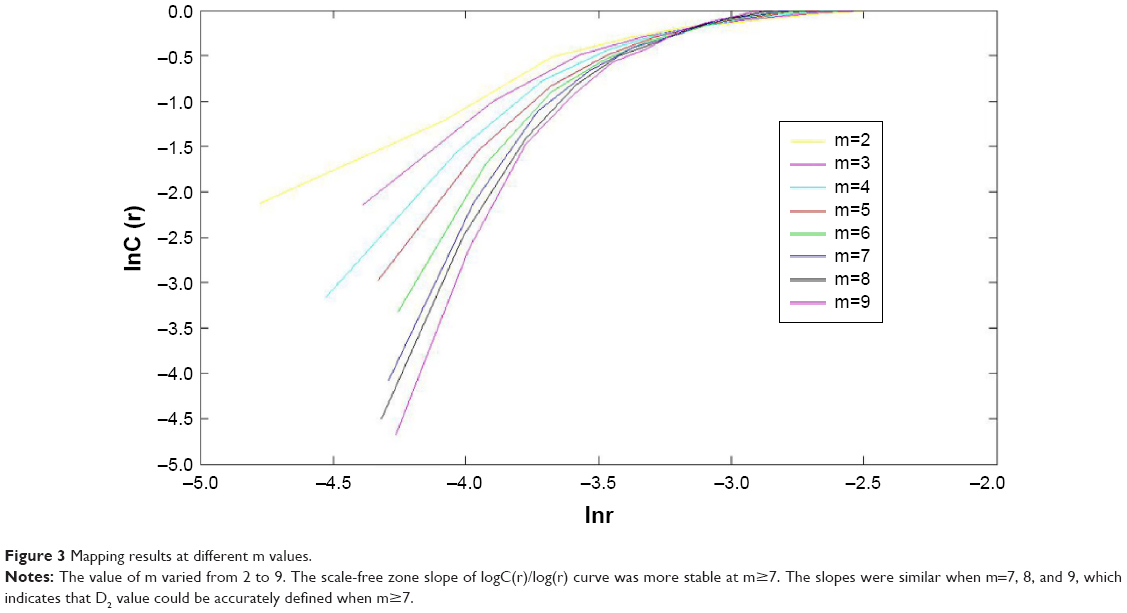 | Figure 3 Mapping results at different m values. |
Discussion
In our study, a comparison of the 14 lead EEG results showed that the energy values of δ, θ, and α1 waves in CFS patients were increased, which indicates the decreased brain electrical activities in CFS patients. In addition, the brain electrical energy values in the right frontal region and left occipital region changed significantly in comparison with other brain areas, which suggests that changes in the brain electrical activities in CFS patients are region-specific. The correlation dimension results also indicate the overall decrease in the intensity and complexity of the brain electrical signals in CFS patients. These results may imply that the decrease in the neuronal discharges in CFS patients may lead to abnormal changes, such as a relatively inhibitory state, in brain function. This study is the first to report the difference in the energy values of the right frontal area and left occipital region in CFS patients, which provides reference for the relevance of clinical EEG examination in CFS patients. A study15 has found that the executive function of cognitive domain is related to the brain’s frontal lobe function, such as problem solving, judgment, impulse control, memory, and social and sexual behavior. A previous study16 has shown that the BA9/46d brain region, located in the frontal lobe, is responsible for the executive functioning, such as motivation and planning for new things. The low rSUVacc ([2-11C]-acetyl-l-carnitine) in the subdivision of BA9 might be responsible for the abnormalities of memory and judgment in CFS patients.17 It may explain the reasons why CFS patients are “inactive in action compared with previous behaviors” and “being low efficient in action”.12
A study has found that decreased uptake of acetylcarnitine in the frontal gyrus and reduced neurotransmitter synthesis in local brain regions in CFS patients are the key mechanisms of chronic fatigue.17 A positron emission tomography study19 showed a decreased acetylcarnitine uptake in the frontal, cingulate, temporal, and occipital cortices, basal ganglia, and hippocampus in CFS/myalgic encephalomyelitis (ME) patients, suggesting reduced brain activity in CFS/ME patients. Duffy et al demonstrated that EEG spectral coherence data can be used to distinguish CFS patients from healthy controls and depressed patients, and that CFS pathophysiology involves neurological abnormalities (temporal lobe involvement).18 In our study, we found the abnormalities in the left occipital region using BEAM. The discrepancy may be due to different experimental methods. Recent evidence indicates that neuroinflammation is present in widespread brain areas in CFS/ME patients and is associated with the severity of neuropsychological symptoms.19 Because EEG only measures the surface electric potentials of the brain, it may not be sensitive in measuring the neuroinflammation.
Limitations and future research
The electric potential recorded in EEG is from the surface of the skull; therefore, it might only reflect the potential activity of brain tissues that are close to the surface layer. The physiological changes in some key regions deeper in the brain, such as hippocampal neurogenesis, have not been revealed yet. In this study, we did not carry out the respective analysis of the frontal cortex, parietal cortex, occipital lobe, and lobi temporalis. More comprehensive analysis of detailed changes in all encephalic regions in CFS patients will be explored in our future studies. We did not find any differences between males and females in this study. We will increase our sample size in the future study to explore the sex difference in CFS patients.
Conclusion
Our results indicate that the brain spontaneous electrical activities in CFS patients stayed in an inhibitory state. The abnormal changes in the cerebral functioning in the CFS patients were localized at the right frontal region and left occipital region.
Disclosure
The authors report no conflicts of interest in this work.
References
Fukuda K, Straus SE, Hickie I, Sharpe M, Dobbins JG, Komaroff AL. The chronic fatigue syndrome: a comprehensive approach to its definition and study. Ann Intern Med. 1994;121(12):953–959. | ||
Jian W, Bin Y, Yingqian Z. [The nonlinear theory and the nonlinear of EEG]. Nervous Diseases and Mental Health. 2007;7(3):77–78. Available from: http://124.133.52.136:89/D/Periodical_sjjbyjsws200703028.aspx. Accessed December 23, 2015. Chinese. | ||
Hongchao W, Yaan L, Siyi Z. [The Application of Chaos Theory on the Feature Extraction of EEG]. Technical Acoustics. 2006;25(4):254–255. Available from: http://124.133.52.136:89/D/Conference_6354995.aspx. Accessed December 23, 2015. Chinese. | ||
Breakspear M, Terry JR. Topographic organization of nonlinear interdependence in multichannel human EEG. Neuroimage. 2002;16(3 Pt 1):822–835. | ||
Dongyu W, Weiwei D. Application of EEG non-linear analysis in cognitive function research. Chinese Journal of Neurology. 2003;36(5):335–338. | ||
Manu P, Lane TJ, Matthews DA, Castriotta RJ, Watson RK, Abeles M. Alpha-delta sleep in patients with a chief complaint of chronic fatigue. South Med J. 1994;87(4):465–470. | ||
Reeves WC, Heim C, Maloney EM, et al. Sleep characteristics of persons with chronic fatigue syndrome and non-fatigued controls: results from a population-based study. BMC Neurol. 2006;16(6):41. | ||
Van Hoof E, De Becker P, Lapp C, Cluydts R, De Meirleir K. Defining the occurrence and influence of alpha-delta sleep in chronic fatigue syndrome. Am J Med Sci. 2007;333(2):78–84. | ||
Gotts ZM, Deary V, Newton J, Van der Dussen D, De Roy P, Ellis JG. Are there sleep-specific phenotypes in patients with chronic fatigue syndrome? A cross-sectional polysomnography analysis. BMJ Open. 2013;3(6).pii:e002999. | ||
Siemionow V, Fang Y, Calabrese L, Sahgal V, Yue GH. Altered central nervous system signal during motor performance in chronic fatigue syndrome. Clin Neurophysiol. 2004;115(10):2372–2381. | ||
Neu D, Kajosch H, Peigneux P, Verbanck P, Linkowski P, Le Bon O. Cognitive impairment in fatigue and sleepiness associated conditions. Psychiatry Res. 2011;189(1):128–134. | ||
Holmes GP, Kaplan JE, Gantz NM, et al. Chronic fatigue syndrome: a working case definition. Ann Intern Med. 1988;108(3):387–389. | ||
No authors listed. Guideline fourteen: guidelines for recording clinical EEG on digital media. American Electroencephalographic Society. J Clin Neurophysiol. 1994;11(1):114–115. | ||
Dongbing C. Study on Non-Linear Characteristic Parameter of EEG. Beijing Biomedical Engineering. 2006;25(6):611–614. | ||
Wiborg JF, Knoop H, Stulemeijer M, Prins JB, Bleijenberg G. How does cognitive behaviour therapy reduce fatigue in patients with chronic fatigue syndrome? The role of physical activity. Psychol Med. 2010;40(8):1281–1287. | ||
Roberts A, Weiskrantz L, Robbins TW. The Prefrontal Cortex: Executive and Cognitive Functions. London: Oxford University Press; 1988. | ||
Kuratsune H, Yamaguti K, Lindh G, et al. Brain regions involved in fatigue sensation: reduced acetylcarnitine uptake into the brain. Neuroimage. 2002;17(3):1256–1265. | ||
Duffy FH, McAnulty GB, McCreary MC, Cuchural GJ, Komaroff AL. EEG spectral coherence data distinguish chronic fatigue syndrome patients from healthy controls and depressed patients – a case control study. BMC Neurol. 2011;11:82. | ||
Nakatomi Y, Mizuno K, Ishii A, et al. Neuroinflammation in patients with chronic fatigue syndrome/Myalgic Encephalomyelitis: an 11C-(R)-PK11195 PET study. J Nucl Med. 2014;55(6):945–950. |
 © 2016 The Author(s). This work is published and licensed by Dove Medical Press Limited. The
full terms of this license are available at https://www.dovepress.com/terms
and incorporate the Creative Commons Attribution
- Non Commercial (unported, 3.0) License.
By accessing the work you hereby accept the Terms. Non-commercial uses of the work are permitted
without any further permission from Dove Medical Press Limited, provided the work is properly
attributed. For permission for commercial use of this work, please see paragraphs 4.2 and 5 of our Terms.
© 2016 The Author(s). This work is published and licensed by Dove Medical Press Limited. The
full terms of this license are available at https://www.dovepress.com/terms
and incorporate the Creative Commons Attribution
- Non Commercial (unported, 3.0) License.
By accessing the work you hereby accept the Terms. Non-commercial uses of the work are permitted
without any further permission from Dove Medical Press Limited, provided the work is properly
attributed. For permission for commercial use of this work, please see paragraphs 4.2 and 5 of our Terms.