")
Back to Journals » Medical Devices: Evidence and Research » Volume 12
Electrical Analysis Of Normal And Diabetic Blood For Evaluation Of Aggregation And Coagulation Under Different Rheological Conditions
Authors Elblbesy MA
Received 19 July 2019
Accepted for publication 16 September 2019
Published 18 October 2019 Volume 2019:12 Pages 435—442
DOI https://doi.org/10.2147/MDER.S223794
Checked for plagiarism Yes
Review by Single anonymous peer review
Peer reviewer comments 2
Editor who approved publication: Dr Scott Fraser
Mohamed A Elblbesy
Department of Medical Biophysics, Medical Research Institute, Alexandria University, Alexandria, Egypt
Correspondence: Mohamed A Elblbesy
Department of Medical Biophysics, Medical Research Institute, Alexandria University, Alexandria, Egypt
Email [email protected]
Introduction: Erythrocyte aggregation and blood coagulation are of great interest and are still under investigation by many researchers. Erythrocytes have a direct effect on hemorheological properties. Real-time in vitro studies on blood coagulation and aggregation provide a chance to understand their mechanisms in normal and pathological conditions. Additionally, this method offers control over the physical and chemical conditions during the study.
Objective: The present study introduced a simple in vitro technique to study blood aggregation and coagulation under controlled conditions.
Methods: The technique used in this study is based on the measurement of the electrical properties of blood. A simple flow chamber was made from two cylinders with a gap between them. The outer cylinder remains stationary, and the inner cylinder rotates about its axis. The inner cylinder velocity is controlled by a stepper motor. Blood samples are introduced in the gap between the two cylinders. Capacitance and impedance of blood samples were recorded by two electrodes attached to the outer cylinders and in direct contact with blood.
Results: Quantitative parameters were extracted from the capacitance and impedance time courses. These parameters were used to describe the aggregation and coagulation processes under different shear rates. Strong correlations between the aggregation index and shear rate were found for normal and diabetic blood samples. Additionally, strong negative correlations of coagulation time were found for normal and diabetic blood samples. In conclusion, the electrical analysis of blood reflects well the interactions between internal blood contents.
Conclusion: The parameters extracted from this technique can be used in the quantitative description of hemorheological processes under different physical conditions.
Keywords: electrical analysis, erythrocytes, aggregation, coagulation
Introduction
One of the most important hemorheological properties of the blood is erythrocyte aggregation. Erythrocyte aggregability is defined as the tendency of the cells to adhere together.1 Erythrocyte aggregation tendencies directly affect the flow dynamics and flow resistance of the blood.2 Erythrocyte aggregation is induced by proteins or antibodies, such as fibrinogen, immunoglobulin G, and immunoglobulin M. Additionally, polysaccharides such as dextran can induce erythrocyte aggregation.1 The mechanisms of erythrocyte aggregation have not yet been fully understood in normal and pathological conditions.1 Over the past several decades, research has focused on biochemical factors that promote erythrocyte aggregation. Recently, many studies have given particular attention to the cellular and physical factors that could mediate erythrocyte aggregation.3,4 Blood coagulation (which is also known as blood clotting) is an essential mechanism for maintaining hemostasis.5,6 Physiological blood clotting is initiated by contact of the blood with the surfaces presented by many substances and tissues other than normal vascular endothelium.7 It is activated by thrombocytes. Erythrocytes, leukocytes, and platelets are involved in the formation of blood clots. They are stabilized by a network of fibrin during the formation of blood clots. Many pathological complications, such as thrombosis and embolism in the vascular system, are associated with blood coagulation.5
The theoretical and experimental dielectric studies were developed to explain the interactions between cells under normal and pathological conditions.8–11 An experimental approach using impedance spectroscopy was developed for the investigation of erythrocyte aggregation.12 The parameters extracted from the impedance spectroscopy are used to describe the morphology of erythrocyte aggregation and to quantify the dependence on hematocrit.13,14 The three components model used to describe the blood impedance includes plasma resistance, erythrocyte internal resistance, and erythrocyte membrane capacitance.15 The effects of both the erythrocyte shape and the hematocrit on the electrical parameters of the blood have been proven.16 The blood resistivity (1) was estimated by the following equation:
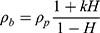
where  is plasma resistivity, H is hematocrit, and k is a factor depending on the geometry and orientation of the erythrocyte.
Many techniques and methods are used to monitor and measure blood coagulation.17 The most common test used to evaluate whole blood coagulation is clotting time. In some cases, the continuous monitoring and measurement of blood coagulation are critical, such as during surgery. The electrical impedance of the blood was reported as the best method for continuous measurement of blood coagulation.18 It is known that the electrical impedance of the blood correlates with the fibrinogen concentration, erythrocyte sedimentation, and hematocrit.19–21 In comparison with other methods, the electrical impedance method was reported to be reproducible.22
Alterations in hemorheological parameters due to diabetes mellitus are subjected to physiological and epidemiological studies.23 Vascular complications and abnormal rheological dynamics due to an increase in erythrocyte aggregation were indicated in diabetes mellitus.24,25 Patients with type 2 diabetes exhibit peripheral vascular diseases in the lower extremities, and it has been suggested that enhanced erythrocyte aggregation contributes directly to this pathophysiology.26,27 The elevation in whole blood viscosity was indicated in diabetes mellitus.28,29 On the other hand, multiple abnormalities in blood coagulation parameters are observed in patients with type 2 diabetes.29,30
Many experimental approaches to study aggregation and coagulation process were established with confirmed results based on the dielectric properties of erythrocytes.8,12,13,31 The previous approaches studied erythrocyte aggregation or coagulation under stasis conditions or flow conditions. This study aimed to use the electrical properties of erythrocytes to study their aggregation and coagulation under the transition between two flow stages with the same technique. The effect of the shear rate on aggregation and coagulation was one of the primary concerns of this study. The effectiveness and efficiency of the method used in the present study were tested by studying the aggregation and coagulation of diabetic blood.
Materials And Methods
Sample Collection
This study was done under the conditions of the ethics committee of the Medical Research Institute, Alexandria University. The research had been carried out in accordance with the World Medical Association Declaration of Helsinki 2013, and that all subjects provided written informed consent. Thirty blood samples were collected from volunteers who were diagnosed with type 2 diabetes. Thirty blood samples were collected from healthy volunteers and used as control samples. All volunteers were male with ages between 35 and 45 years. For the aggregation test, blood samples were collected with EDTA as an anticoagulant. For the coagulation test, blood samples were collected with 3.2% sodium citrate. For both tests, the whole blood was centrifuged at 3500 rpm for 5 mins to separate erythrocytes and plasma. Erythrocytes were washed twice with phosphate buffer saline. The washed erythrocytes were resuspended in autologous plasma at a concentration of 20%, and the suspension was stored in the refrigerator at 4°C. Before each test, the erythrocyte suspension was placed at room temperature for 30 mins. For the coagulation test, 0.5 M CaCl was added to the erythrocyte suspension to accelerate the coagulation process.
Electrical Measurement Under Different Shear Rates
The experimental setup used for the electrical measurements is shown schematically in Figure 1. The electrical properties of erythrocyte suspensions were recorded in a flow chamber. The flow chamber was designed and constructed based on the idea of rotational coaxial cylinder viscometer.32 This design offered smooth flow conditions. The chamber was constructed from two Teflon coaxial cylinders with dimensions of 5 cm in height and 2 cm external diameter. The gap between the two cylinders was made as small as possible (0.5 mm) to avoid wall effects on the flow. The inner cylinder was connected directly to the bipolar stepper motor to control its rotational motion around its central axis. The stepper motor was derived from a microstep chopper driver. This driver was connected to the PC via USB. The coordinate command was sent by the operator to advance the motor to the target velocity. The erythrocyte suspension was placed in the gap between the two cylinders and introduced to a shear rate between 0.5 and 60 s−1. The shear rate was modulated according to the angular velocity of the inner cylinder and was calculated as follows:
(2)
where a and b are the radius of the inner and outer cylinders, respectively, and Ω is the angular velocity of the inner cylinder.
Gold electrodes of 2 mm in diameter were fixed at the wall of the outer cylinder in direct contact with the erythrocyte suspension. The electrodes were fixed in the middle of the cylinder 2.5 cm from the bottom. A specific electrode diameter was chosen to reduce the current density at the electrodes and, hence, reduce the effects of the electrodes. These electrodes were connected to the LCR meter. All the electrical measurements were performed at 100 kHz. The frequency was chosen according to the previous studies, which indicated that the erythrocyte suspension had no response to low frequencies. This frequency lays in the β-dispersion region, indicating the capacitive effects of cell membranes.12
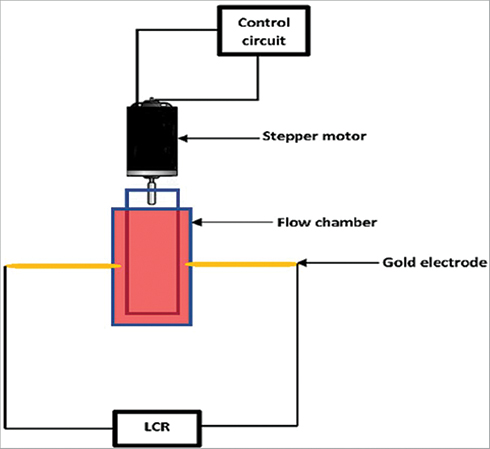 |
Figure 1 A schematic diagram of the setup used to study the aggregation and coagulation of blood. |
Capacitance (C) was chosen to represent erythrocytes aggregation. Blood coagulation is induced as thrombin converts fibrinogen into fibrin that interrupt erythrocytes, and the blood clot begins to form. Since the erythrocytes lose their cellular characteristics during the coagulation process, impedance (Z) was chosen to evaluate the coagulation process. Magnitude and phase angle of Z were measured at 100 kHz.
C and Z were measured every 5 s continuously until 160 s. All the measurements were repeated under four different shear rates of 0.5, 5, 15, and 25 s−1. For the aggregation measurement, the erythrocyte suspension was introduced to the high shear rate of 40 s−1 to break down the erythrocyte aggregation and then applied to the desired value of the shear rate. For the coagulation measurement, the desired shear rate was applied immediately after presenting erythrocytes in the flow chamber.
C was plotted via time. The curves obtained were used to calculate the characteristic parameters of the erythrocyte aggregation process. These parameters were the aggregation half-time (T1/2) and the aggregation index (AI). T1/2 was calculated as the time required to reach one half of the maximum time course of the capacitance. AI was calculated as in the following:12,33,34
(3)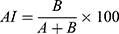
where B is the area under the curve, and A is the area above the curve.
Coagulation time (Tco) was calculated as the time required for Z to begin to increase after the formation of a blood clot.
Statistical Analysis
Statistical analysis was performed using IBM SPSS statistics software version 24 (SPSS Inc., Chicago, IL, USA). All quantitative variables are presented as the mean±standard deviation. Correlations for all characteristic parameters of aggregation and coagulation with shear rates were performed using the R2 test. A Student's t-test was used to study the difference in means for diabetic blood and control. The results were considered statistically significant when p<0.05.
Results And Discussion
In the present study, the C values in both control and diabetic blood samples were greater at low shear rates compared to high shear rates. The C values of diabetic blood were greater than the control for the entire investigated shear rate range. The decreased percentages of C for the control and diabetic blood in the comparison between the lowest shear rate (0.5 s−1) and highest shear rate (25 s−1) were ~64% and 52%, respectively. Figure 2 shows the variation in C values (C time course) under different shear rates for control and diabetic blood. Two significant phases were indicated in the C time course. The first phase was due to the complete disaggregation process when the erythrocyte suspension was introduced to a very high shear rate and continued to approximately 20 s after lowering the shear rate to the desired value. In this phase, C began to decline and reached its minimum value. The second phase took place when the shear rate was lowered to the desired value, and erythrocyte aggregation began to form. In this phase, C gradually increased until it reached a nearly fixed value. These were noted in both diabetic blood and control under the whole investigated shear rate range. The minimum and maximum values of C were critical in the assessment of erythrocyte aggregation. The yielded minimum and maximum values of C are presented in Table 1. Earlier studies indicated that the electrical properties of blood are a function of the percentage of packed erythrocytes and the interaction between erythrocytes.8,12,13,16,35 Baskurt et al indicated the changes in electrical properties of the erythrocyte suspension during the transition from flow to stasis.12 Their findings cleared the association between the change in erythrocyte aggregation state and electrical capacitance. Their results were confirmed in comparison with the light transmission technique. Pribush et al investigated erythrocyte aggregation kinetics based on the dielectric properties of the dispersed system. Their results showed that at a hematocrit of 0.36 v/v, the capacitance was  600 pF at 1.04 s−1 and reached
  450 pF at 16.67 s−1.14 Baskurt et al indicated that the capacitance of blood at stasis was dependent on the prior shear rate. They found that for erythrocyte suspensions of 0.3 L/L, the capacitance was 0.39± 0.01 nf and 6.06±0.14 nf at 0.5 L/L.12 In the present study, the capacitance at a low shear rate (0.5 s−1) was in accordance with the previous study. The decrease in the capacitance was noted whenever the shear rate was increased. This decrease could be explained by the destruction of erythrocyte aggregation. The diabetic blood is hyperaggregated more than the control blood, so it is rational that the capacitance values of diabetic blood were greater than the control blood for all investigated shear rate ranges.
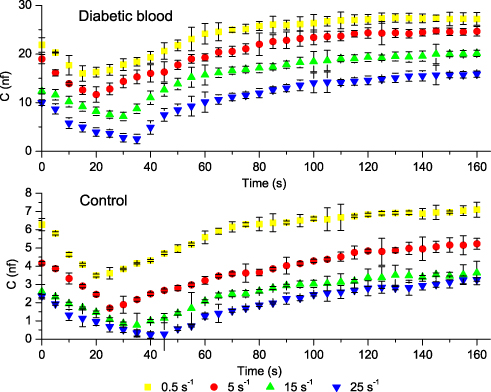 |
Figure 2 Time course of blood capacitance under different shear rates for control and diabetic blood. |
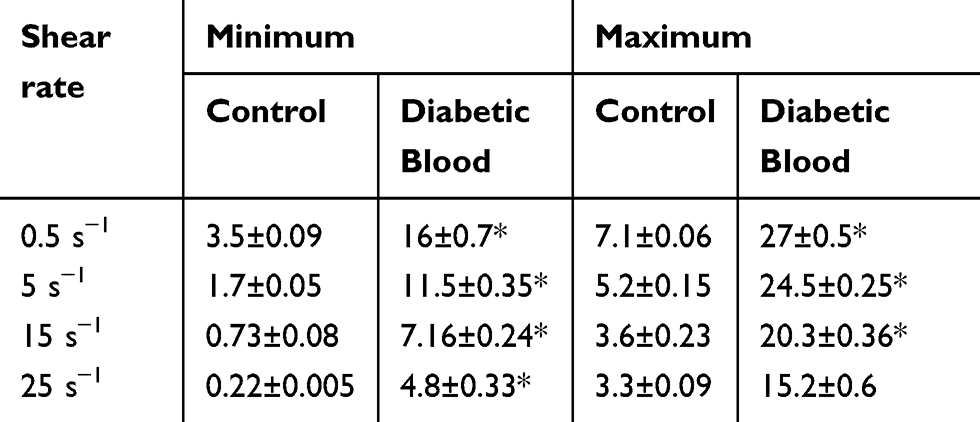 |
Table 1 The Minimum And Maximum C (nf) Values Under Different Shear Rates For Control And Type 2 Diabetes Blood Samples |
Indeed, blood loses its cellular properties when coagulation begins to form. Blood clotting is a gel-like shape that contains fibers. Therefore, it is more appropriate to use electrical impedance to investigate blood clotting rather than other electrical properties. In the present work, the electrical impedance (Z) was measured at 100 kHz in control and diabetic blood samples to study the clot formation under the variation of shear rates. The findings of this study showed a horizontal change of Z with time and vertical change with shear rate for both control and diabetic blood samples. Figure 3 represents the time course of Z, which began as a constant of time. The transition was taken at the time at which the blood clot began to form. At this stage, Z increased until it reached a maximum and approximately constant value. Z decreased as the shear rate increased. This was noted for both control and diabetic blood samples. Z values for the diabetic blood samples were higher than those the control samples over the entire investigated shear rate range. Lei et al used electric impedance measurement in the microchannel to monitor the blood clotting process. Their measurements of blood impedance above 500 Hz gave an apparent response to the clotting process.18 Previous studies showed fluctuations in the electrical impedance of the blood due to the clotting process and mentioned that blood behaves as insulated matter when it clots.36,37
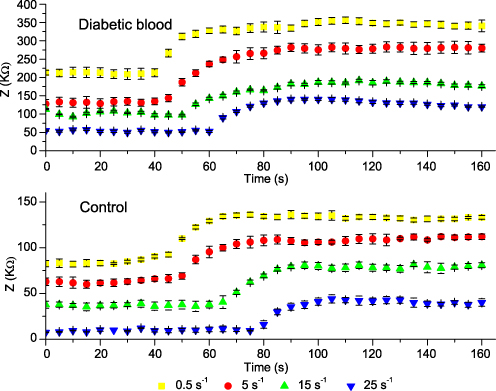 |
Figure 3 Time course of blood impedance under different shear rates for control and diabetic blood samples. |
In the present study, the aggregation parameters were extracted from the blood capacitance time course under shear rates ranging from 0.5 to 50 s−1. T1/2 was directly proportional to the shear rate. Strong correlations were found for the relationship between T1/2 and the shear rate for control and diabetic blood. As shown in Figure 4, T1/2 for control blood was greater than diabetic blood for the entire range of investigated shear rates. The difference in T1/2 between control and diabetic blood was highly significant (p<0.05). In this study, T1/2 was used to express the time needed for the formation of aggregates. T1/2 reflected the effect of shear rate on the aggregation process. Additionally, it showed the hyperaggregation behavior of diabetic blood. There was a statistical difference between AI of control and diabetic blood (p˂0.05) as shown in Figure 5. Also, there was a significant statistical difference between AI in diabetic patient vs controls.
Baskurt et al found the aggregation parameters obtained from the time course of C and light transmission were with a similar trend. From their study, AI values calculated based on C time course were 60.6±5.1 at ½ diluted plasma and 84.4 ±1.8 at plasma+1% dextran 500. Additionally, their results showed that T1/2 was 21.5±1.0 at ½ diluted plasma and 19.9 ±1.2 at plasma+1% dextran 500.12 These results support the results obtained in this study. The T1/2 and AI values obtained in the present study were lower than those obtained in previous studies because those values were measured at 20% hematocrit. Additionally, values from previous studies were measured under different shear rates and stasis states. The previous studies illustrated the association between T1/2 and AI and the aggregation state of the erythrocytes, which is in agreement with the results obtained in this study.
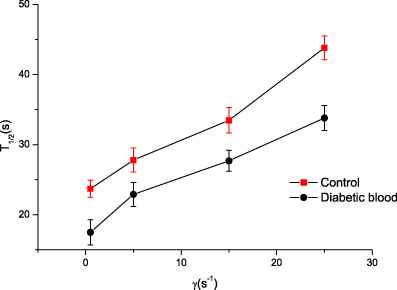 |
Figure 4 Correlation between aggregation half-time and shear rate (p<0.05). |
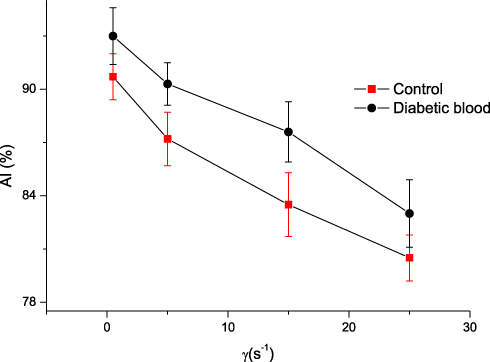 |
Figure 5 Correlation between aggregation index and shear rate (p<0.05). |
In the present work, AI and T1/2 illustrated the hyperaggregation of the diabetic blood. The AI of diabetic blood was greater than that of the control blood, and the T1/2 of diabetic blood was lower than that of the control blood. These results emphasized that erythrocytes from diabetic blood aggregated faster than those from normal blood, and larger aggregates formed in diabetic blood than in normal blood.
Strong correlations for the relationships between Tco and shear rate were obtained for both normal and diabetic blood samples, as indicated in Figure 6. The Tco for diabetic blood was lower than that for control blood for an investigated range of shear rates. This finding indicates the effect of the shear rate on coagulation and how the shear rate resists the formation of coagulation. Additionally, diabetic blood may coagulate faster than normal blood under a controlled shear rate. The shear rate is the better parameter to be considered when analyzing blood coagulation under flow.38 The effect of shear rate on blood coagulation was investigated by many researchers at low and high shear rates.39–41 A high shear rate may initiate coagulation by increasing the delivery of coagulation proenzyme.42 In contrast, low shear rates have been suggested to increase blood coagulation by increasing fibrin deposition or reducing transport activated coagulation factors away from the surface stimulus.43 The present study introduces an in vitro method that could support the former point of view that the shear rate has a significant effect on blood coagulation. Lei et al measured blood coagulation time at various hematocrit values using an impedance measurement technique. Their findings showed a strong correlation between coagulation time and hematocrit. They also monitored the effect of temperature on blood coagulation using the impedance technique.18 The present study promoted the efficacy of impedance measurement to monitor blood coagulation. Additionally, this study offered a technique by which blood coagulation can be studied under different physical and chemical conditions.
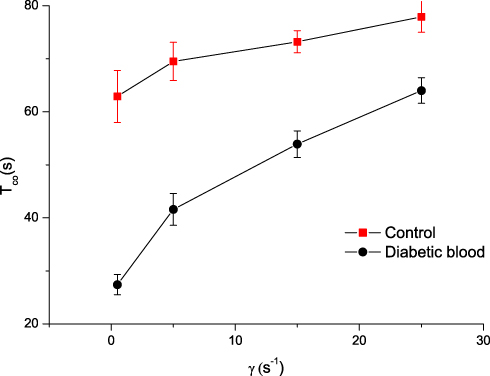 |
Figure 6 Correlation between blood coagulation time and shear rate (p<0.05). |
Conclusion
Real-time monitoring of erythrocyte aggregation and blood coagulation is very important to understand both mechanisms. Electrical analysis of whole blood offers an excellent tool to achieve this purpose. In the present study, the data from the electrical analysis of whole blood were used in the quantitative description of aggregation and coagulation for normal and diabetic blood samples. The hyperaggregation of the diabetic blood was observed in comparison with control as indicated from the analysis of capacitance time course. Also, analysis of impedance time course showed that the blood coagulated faster in diabetic blood than control. The parameters obtained from capacitance and impedance time courses are promising and reflect the state of aggregation and coagulation of blood under different shear rates.
Ethics Approval And Consent To Participate
This study was performed under the conditions and approval of the ethics committee of the Medical Research Institute, Alexandria University.
Availability Of Data And Materials
The data supporting the findings of the study are included in this manuscript.
Disclosure
The author declares that he has no competing interests in this work.
References
1. Baskurt O, Neu B, Meiselman HJ. Red Blood Cell Aggregation. CRC Press; 2011.
2. Cabel M, Meiselman HJ, Popel AS, Johnson PC. Contribution of red blood cell aggregation to venous vascular resistance in skeletal muscle. Am J Physiol Heart Circulatory Physiol. 1997;272(2):H1020–H32. doi:10.1152/ajpheart.1997.272.2.H1020
3. Chien S, Sung LA. Physicochemical basis and clinical implications of red cell aggregation. Clin Hemorheol Microcirc. 1987;7(1):71–91. doi:10.3233/CH-1987-7108
4. Tomaiuolo G. Biomechanical properties of red blood cells in health and disease towards microfluidics. Biomicrofluidics. 2014;8(5):051501. doi:10.1063/1.4895755
5. Mann KG. Biochemistry and physiology of blood coagulation. Thromb Haemost. 1999;82(2):165–174.
6. Bloom A. Physiology of blood coagulation. Pathophysiol Haemost Thromb. 1990;20(Suppl. 1):14–29. doi:10.1159/000216159
7. Macfarlane RG. An enzyme cascade in the blood clotting mechanism, and its function as a biochemical amplifier. Nature. 1964;202:498. doi:10.1038/202498a0
8. Beving H, Eriksson L, Davey C, Kell D. Dielectric properties of human blood and erythrocytes at radio frequencies (0.2–10 MHz); dependence on cell volume fraction and medium composition. Eur Biophys J. 1994;23(3):207–215.
9. Hanai T, Asami K, Koizumi N. Dielectric theory of concentrated suspensions of shell-spheres in particular reference to the analysis of biological cell suspensions. 1979.
10. Gaw RL, Cornish BH, Thomas BJ. The electrical impedance of pulsatile blood flowing through rigid tubes: a theoretical investigation. IEEE Trans Biomed Eng. 2008;55(2):721–727. doi:10.1109/TBME.2007.903531
11. Abdalla S. Effect of erythrocytes oscillations on dielectric properties of human diabetic-blood. AIP Adv. 2011;1(1):012104. doi:10.1063/1.3556986
12. Baskurt OK, Uyuklu M, Meiselman HJ. Time course of electrical impedance during red blood cell aggregation in a glass tube: comparison with light transmittance. IEEE Trans Biomed Eng. 2010;57(4):969–978. doi:10.1109/TBME.2009.2036598
13. Pribush A, Meiselman H, Meyerstein D, Meyerstein N. Dielectric approach to the investigation of erythrocyte aggregation: I. Experimental basis of the method. Biorheology. 1999;36(5–6):411–423.
14. Pribush A, Meiselman H, Meyerstein D, Meyerstein N. Dielectric approach to investigation of erythrocyte aggregation. II. Kinetics of erythrocyte aggregation–disaggregation in quiescent and flowing blood. Biorheology. 2000;37(5–6):429–441.
15. Fricke H, Morse S. The electric resistance and capacity of blood for frequencies between 800 and 4½ million cycles. J Gen Physiol. 1925;9(2):153. doi:10.1085/jgp.9.2.153
16. Hoetink A, Faes TJ, Visser K, Heethaar RM. On the flow dependency of the electrical conductivity of blood. IEEE Trans Biomed Eng. 2004;51(7):1251–1261. doi:10.1109/TBME.2004.827263
17. Blair S, Menashi S, Samson D, Greenhalgh R. Whole blood clotting tests: an evaluation of five methods. Clin Lab Haematol. 1987;9(1):91–94. doi:10.1111/j.1365-2257.1987.tb01387.x
18. Lei KF, Chen K-H, Tsui P-H, Tsang N-M. Real-time electrical impedimetric monitoring of blood coagulation process under temperature and hematocrit variations conducted in a microfluidic chip. PLoS One. 2013;8(10):e76243. doi:10.1371/journal.pone.0076243
19. Rosenthal RL, Tobias CW. Measurement of the electric resistance of human blood; use in coagulation studies and cell volume determinations. J Lab Clin Med. 1948;33(9):1110–1122.
20. Ur A. Changes in the electrical impedance of blood during coagulation. Nature. 1970;226(5242):269. doi:10.1038/226269a0
21. Berney H, O’Riordan J. Impedance measurement monitors blood coagulation. Analog Dialogue. 2008;42(3):42–48.
22. Spence N. Electrical impedance measurement as an endpoint detection method for routine coagulation tests. Br J Biomed Sci. 2002;59(4):223–227.
23. Cho YI, Mooney MP, Cho DJ. Hemorheological disorders in diabetes mellitus. J Diabetes Sci Technol. 2008;2(6):1130–1138. doi:10.1177/193229680800200622
24. Kim S, Popel AS, Intaglietta M, Johnson PC. Effect of erythrocyte aggregation at normal human levels on functional capillary density in rat spinotrapezius muscle. Am J Physiol Heart Circulatory Physiol. 2006;290(3):H941–H7. doi:10.1152/ajpheart.00645.2005
25. Sun C, Munn LL. Influence of erythrocyte aggregation on leukocyte margination in postcapillary expansions: a lattice Boltzmann analysis. Physica A. 2006;362(1):191–196. doi:10.1016/j.physa.2005.09.027
26. Osmundson PJ, O’Fallon WM, Zimmerman BR, Kazmier FJ, Langworthy AL, Palumbo P. Course of peripheral occlusive arterial disease in diabetes: vascular laboratory assessment. Diabetes Care. 1990;13(2):143–152. doi:10.2337/diacare.13.2.143
27. Maser RE, Jr SK W, Ellis D, et al. Cardiovascular disease and arterial calcification in insulin-dependent diabetes mellitus: interrelations and risk factor profiles. Pittsburgh Epidemiology of Diabetes Complications Study-V. Arterioscler Thromb Vasc Biol. 1991;11(4):958–965.
28. Williamson TH, Rumley A, Lowe G. Blood viscosity, coagulation, and activated protein C resistance in central retinal vein occlusion: a population controlled study. Br J Ophthalmol. 1996;80(3):203–208. doi:10.1136/bjo.80.3.203
29. McMillan DE. Disturbance of serum viscosity in diabetes mellitus. J Clin Invest. 1974;53(4):1071–1079. doi:10.1172/JCI107644
30. Müller R. Diabetic angiopathy and blood viscosity. Acta Diabetol Lat. 1973;10(6):1309–1324. doi:10.1007/BF02590717
31. Bauersachs R, Wenby R, Meiselman H. Determination of specific red blood cell aggregation indices via an automated system. Clin Hemorheol Microcirc. 1989;9(1):1–25. doi:10.3233/CH-1989-9101
32. Balan C, Balut C, Gheorghe L, Gheorghe C, Gheorghiu E, Ursu G. Electrical and rheological properties of blood in simple shear flow. Part I: experimental determination of blood permittivity and conductivity. Clin Hemorheol Micro. 2004;30:359–364.
33. Shin S, Yang Y, Suh J-S. Measurement of erythrocyte aggregation in a microchip stirring system by light transmission. Clin Hemorheol Microcirc. 2009;41(3):197–207. doi:10.3233/CH-2009-1172
34. Hardeman M, Dobbe J, Ince C. The Laser‐assisted Optical Rotational Cell Analyzer (LORCA) as red blood cell aggregometer. Clin Hemorheol Microcirc. 2001;25(1):1–11.
35. Pribush A, Meyerstein D, Meyerstein N. Conductometric study of shear‐dependent processes in red cell suspensions. I. Effect of red blood cell aggregate morphology on blood conductance. Biorheology. 2004;41(1):13–28.
36. Lei KF, Leung PH. Microelectrode array biosensor for the detection of Legionella pneumophila. Microelectron Eng. 2012;91:174–177. doi:10.1016/j.mee.2011.10.002
37. Glawdel T, Ren CL. Electro-osmotic flow control for living cell analysis in microfluidic PDMS chips. Mech Res Commun. 2009;36(1):75–81. doi:10.1016/j.mechrescom.2008.06.015
38. Sakariassen KS, Hanson SR, Cadroy Y. Methods and models to evaluate shear-dependent and surface reactivity-dependent antithrombotic efficacy. Thromb Res. 2001;104(3):149–174. doi:10.1016/s0049-3848(01)00344-9
39. Okorie UM, Denney WS, Chatterjee MS, Neeves KB, Diamond SL. Determination of surface tissue factor thresholds that trigger coagulation at venous and arterial shear rates: amplification of 100 fM circulating tissue factor requires flow. Blood. 2008;111(7):3507–3513. doi:10.1182/blood-2007-08-106229
40. Tseng P-Y, Rele SS, Sun X-L, Chaikof EL. Membrane–mimetic films containing thrombomodulin and heparin inhibit tissue factor-induced thrombin generation in a flow model. Biomaterials. 2006;27(12):2637–2650. doi:10.1016/j.biomaterials.2005.10.025
41. Andree HA, Contino PB, Repke D, Gentry R, Nemerson Y. Transport rate limited catalysis on macroscopic surfaces: the activation of factor X in a continuous flow enzyme reactor. Biochemistry. 1994;33(14):4368–4374. doi:10.1021/bi00180a034
42. Roth GJ. Developing relationships: arterial platelet adhesion, glycoprotein Ib, and leucine-rich glycoproteins. Blood. 1991;77(1):5–19.
43. Weiss HJ, Turitto VT, Baumgartner HR. Role of shear rate and platelets in promoting fibrin formation on rabbit subendothelium. Studies utilizing patients with quantitative and qualitative platelet defects. J Clin Invest. 1986;78(4):1072–1082. doi:10.1172/JCI112663
 © 2019 The Author(s). This work is published and licensed by Dove Medical Press Limited. The full terms of this license are available at https://www.dovepress.com/terms.php and incorporate the Creative Commons Attribution - Non Commercial (unported, v3.0) License.
By accessing the work you hereby accept the Terms. Non-commercial uses of the work are permitted without any further permission from Dove Medical Press Limited, provided the work is properly attributed. For permission for commercial use of this work, please see paragraphs 4.2 and 5 of our Terms.
© 2019 The Author(s). This work is published and licensed by Dove Medical Press Limited. The full terms of this license are available at https://www.dovepress.com/terms.php and incorporate the Creative Commons Attribution - Non Commercial (unported, v3.0) License.
By accessing the work you hereby accept the Terms. Non-commercial uses of the work are permitted without any further permission from Dove Medical Press Limited, provided the work is properly attributed. For permission for commercial use of this work, please see paragraphs 4.2 and 5 of our Terms.