Back to Journals » OncoTargets and Therapy » Volume 9
EGFR protein expression using a specific intracellular domain antibody and PTEN and clinical outcomes in squamous cell lung cancer patients with EGFR-tyrosine kinase inhibitor therapy
Authors Chang H, Oh J, Zhang X, Kim Y, Lee JH, Lee C, Chung J, Lee J
Received 28 February 2016
Accepted for publication 12 May 2016
Published 19 August 2016 Volume 2016:9 Pages 5153—5162
DOI https://doi.org/10.2147/OTT.S107291
Checked for plagiarism Yes
Review by Single anonymous peer review
Peer reviewer comments 4
Editor who approved publication: Dr William C. Cho
Hyun Chang,1,2,* Jisu Oh,1,3,* Xianglan Zhang,4 Yu Jung Kim,1 Jae Ho Lee,1 Choon-Taek Lee,1 Jin-haeng Chung,5 Jong-Seok Lee1
1Department of Internal Medicine, Seoul National University College of Medicine, Seoul National University Bundang Hospital, Seongnam, 2Division of Medical Oncology, Department of Internal Medicine, International St Mary’s Hospital, College of Medicine, Catholic Kwandong University, Incheon, 3Department of Internal Medicine, CHA Bundang Medical Center, CHA University, Seongnam, Republic of Korea; 4Department of Pathology, Yanbian University Hospital, Yanji, People’s Republic of China; 5Department of Pathology, Seoul National University College of Medicine, Seoul National University Bundang Hospital, Seongnam, Republic of Korea
*These authors contributed equally to this work
Purpose: The aim of this research was to examine the molecular and clinical features that are related with EGFR-tyrosine kinase inhibitor (EGFR-TKI) efficacy in previously treated patients with squamous cell carcinoma of the lung (SCCL).
Materials and methods: This retrospective study included 67 SCCL patients with obtainable lung cancer tissue and records on EGFR-TKI treatment response and survival. EGFR protein expression in lung cancer tissue was measured by immunohistochemistry with a specific antibody that recognizes the intracellular domain (ID) of EGFR. PTEN expression in lung cancer tissue was also evaluated with immunohistochemistry. PI3KCA gene amplification was detected by quantitative real-time polymerase chain reaction, and FGFR1 amplification was assessed by fluorescent in situ hybridization.
Results: EGFR ID expression (hazard ratio [HR] 0.53, P=0.022) and Eastern Cooperative Oncology Group (ECOG) performance status (PS) (HR 0.43, P=0.022) were significantly related with progression-free survival following EGFR-TKIs treatment. PTEN expression (HR 0.52, P=0.025) was significantly related to overall survival. The group of EGFR-positive or PTEN-positive patients with ECOG PS of 0 or 1 had better clinical outcomes than patients who were EGFR-negative and PTEN-negative or who had poor ECOG PS with longer median progression-free survival (2.1 vs 1.0 months, P=0.05) and overall survival (6.2 vs 2.1 months, P=0.05).
Conclusion: EGFR expression using an ID-specific antibody and PTEN protein expression may be used to identify SCCL patients who might benefit from EGFR-TKI treatment.
Keywords: EGFR, tyrosine kinase inhibitor, squamous cell carcinoma, lung, intracellular domain, PTEN
Introduction
EGFR-tyrosine kinase inhibitors (EGFR-TKIs) are responsible for significant clinical improvement in the treatment of non-small-cell lung carcinoma (NSCLC) patients, specifically NSCLC patients with an activating EGFR mutation. Prospective Phase III studies on patients with advanced lung adenocarcinoma and EGFR mutations indicated that the EGFR-TKI group had meaningfully extended progression-free survival (PFS) compared with the platinum-based doublets treatment cohort.1 Other clinical trials have reported that patients with wild-type EGFR also benefit from EGFR-TKI therapy as a second- or third-line treatment.2,3 A previous study by Lee et al showed that high EGFR gene copy number and skin rash were associated with EGFR-TKI sensitivity and longer PFS in patients with squamous cell carcinoma of the lung (SCCL).4 Chang et al proposed that MET protein expression in lung cancer tissue might be a biomarker to predict benefit from EGFR-TKIs for NSCLC patients, irrespective of EGFR mutation status.5 The identification of additional molecular markers predictive of clinical benefit from EGFR-TKIs in EGFR wild-type tumors would have important implications for NSCLC patients.5
The aim of this study was to examine the molecular and clinical factors associated with EGFR-TKI efficacy in previously treated patients with SCCL, in whom the prevalence of activating EGFR mutations is <5%.4 We particularly concentrated on expression of EGFR and PTEN proteins, and amplification of PI3KCA and FGFR1 genes.
Materials and methods
Patient selection
This retrospective study included 85 consecutive SCCL patients who received gefitinib (Iressa®, 250 mg/d) or erlotinib (Tarceva®, 150 mg/d) for metastatic SCCL at Seoul National University Bundang Hospital (SNUBH; Seongnam, Korea) from January 2005 to December 2011. Tumor samples from 67 patients were available for analysis. All of the tissues were obtained at the time of the primary diagnosis by biopsy (n=61) or surgical resection (n=6). The medical charts and radiographic images of the patients were then reviewed to assess their clinicopathological characteristics, tumor responses, and survival outcomes using a predesigned data collection format. This study was approved by the Institutional Review Board of SNUBH and written informed consent was obtained from each patient.
EGFR IHC staining and analysis of EGFR mutation status
EGFR protein expression in lung cancer tissue was measured by immunohistochemistry (IHC) with a specific antibody (5B7) that identifies the intracellular domain (ID) of EGFR (#790-4347; Ventana Medical Systems, Inc., Oro Valley, AZ, USA).
This domain is directed against the epitope located at the SOCS3 protein-binding site and also detects truncated forms of the receptor that are constitutively active.6
IHC scoring was carried out by two pathologists according to H-scoring criteria. The H-score is derived by summing the percentage of positive cells (0%–100%) and the intensity (0–3) for that group, resulting in a final IHC score ranging from 0 to 300. We defined positive EGFR expression as an H-score >100.
A mutation analysis was carried out in the 66 patients (98.5%) for whom adequate tissue was available. Paraffin-embedded tissue samples consisting of >70% tumor cells were used to extract DNA. Mutation analysis of EGFR exons 18–21 was carried out using a polymerase chain reaction (PCR)-based assay.
PTEN IHC staining
PTEN IHC staining was carried out using a rabbit monoclonal antibody against PTEN (1:50 dilution, Y184; Epitomics, Burlingame, CA, USA). PTEN immunoreactivity was assessed based on cytoplasmic staining by using a semiquantitative scoring method that divided the samples into four categories as follows: 0, negative; 1, 1%–25% positive; 2, 26%–50% positive; and 3, >50% positive in tumor cells. A staining score of ≥1 was considered to be positive.7 Analysis of PTEN staining was independently performed by two pathologists. In the rare instance of a discrepancy in scoring, agreement was reached by discussion at a multihead microscope.
Copy number analysis of PI3KCA and FGFR
We analyzed the copy number of the PI3KCA gene by real-time quantitative PCR with the TaqMan™ Copy Number Assays (Hs01353479_cn; Thermo Fisher Scientific, Waltham, MA, USA). DNA samples were diluted to a concentration of 5 ng/μL. Each PCR mix contained 5.0 μL of 2X TaqMan Genotyping Master Mix, 0.5 μL of the TaqMan Copy Number target assay mix, 0.5 μL of the TaqMan Copy Number reference assay (RNase P) mix, which is known to exist only in two copies in a diploid genome, 2.0 μL of nuclease-free water, and 2.0 μL of DNA, according to the manufacturer’s instructions. The reactions were processed in an ABI StepOnePlus™ Real-Time PCR System (Thermo Fisher Scientific), with each DNA sample analyzed in triplicates using cycle conditions of 95°C for 10 minutes for one cycle followed by 40 cycles of 92°C for 15 seconds and 60°C for 1 minute. Data were analyzed using CopyCaller™ Software (version 1.0; Thermo Fisher Scientific). A PI3KCA gene copy number of 2 was considered to be indicating normal human genomic DNA, and a copy number >4 was considered to be indicating amplification.
For FGFR1 amplification, a fluorescent in situ hybridization (FISH) assay was carried out on the tissue microarrays with an FGFR1 probe that hybridizes to the 8p12-8p11.23 band labeled with Spectrum Orange (red) and a probe to CEN8 labeled with Spectrum Green (Abbott Molecular, Des Plaines, IL, USA), following routine methods. Two experienced evaluators who were blinded to the clinical data interpreted FISH data. At least 100 nuclei per patient were evaluated. A positive FGFR1 result (ie, amplification) was defined as one of the following conditions:8
- FGFR1/CEN8 ratio ≥2.0;
- average number of FGFR1 signals per tumor cell nucleus ≥6;
- percentage of tumor cells containing ≥15 FGFR1 signals or large clusters ≥10%; and
- percentage of tumor cells containing ≥5 FGFR1 signals ≥50%.
Assessment
Tumor response was assessed by a computed tomography scan, which was typically performed every 8 weeks, in accordance with the guidelines established by the Response Evaluation Criteria in Solid Tumors.
Statistical analysis
For comparisons of patient groups, Fisher’s exact or χ2 test was used as appropriate. A P-value <0.05 was considered statistically significant (two-tailed). PFS was computed from the start of EGFR-TKIs treatment until progression or death, and overall survival (OS) was calculated from the start of TKIs treatment until death from any cause. The Kaplan–Meier method was used to create survival curves, and differences between groups were examined with the log-rank test. Cox regression analysis was used for multivariate analysis with a significance level of 0.05. Factors significant at the P<0.1 level in univariate analyses were entered into the Cox proportional hazards model. All statistical analyses were performed with SPSS software version 14.0 (SPSS Inc., Chicago, IL, USA).
Results
Patient characteristics
The median patient age was 70 years (range: 41–89 years); 85% were male, and 82% were ever smokers. Patients had received a median of 2 prior chemotherapy regimens (range: 1–4 regimens) for advanced lung cancer before treatment with gefitinib or erlotinib. Eighty-four percent (n=56) of the patients were treated with erlotinib, and the rest (n=11) received gefitinib. Survival data were collected until December 2014, and the median follow-up duration was 33.6 months (95% confidence interval [CI]: 5.8–61.4 months).
Molecular testing
Molecular panel testing was conducted for EGFR protein expression, EGFR mutation, PTEN protein expression, PI3KCA amplification, and FGFR1 amplification (Figures S1 and S2). EGFR IHC and EGFR mutation analyses were successfully performed on 66 (99%) and 66 (99%) participants, respectively. The median H-score for EGFR expression with ID-specific antibody was 320 (range: 0–400). EGFR positivity was detected in 56 (85%) cases. There was no case of activating EGFR mutation. IHC for PTEN was performed in 66 (99%) cases, 41 of which showed a positive result (78%). The median PTEN staining score was 2 (range: 0–3). Analysis of PI3KCA amplification was performed in 65 (97%) cases, which showed an 18% incidence (12/67). The median PI3KCA gene copy number was 3 (range: 1–15 copies). Fifty-four samples (81%) were available for FGFR1 FISH analysis, seven of which showed amplification of FGFR1 (13%). The prevalence of EGFR positivity, PI3KCA amplification, and FGFR1 amplification did not differ according to age, sex, smoking status, Eastern Cooperative Oncology Group (ECOG) performance status (PS), or number of previous chemotherapy regimens. However, PTEN-positive patients were significantly more likely to be female and never smokers (Table 1). The smoking dosage of PTEN-positive patients (30 pack-years) was statistically lower than that of the PTEN-negative group (45 pack-years, P=0.028). Other calculated clinicopathological features were not related to PTEN expression.
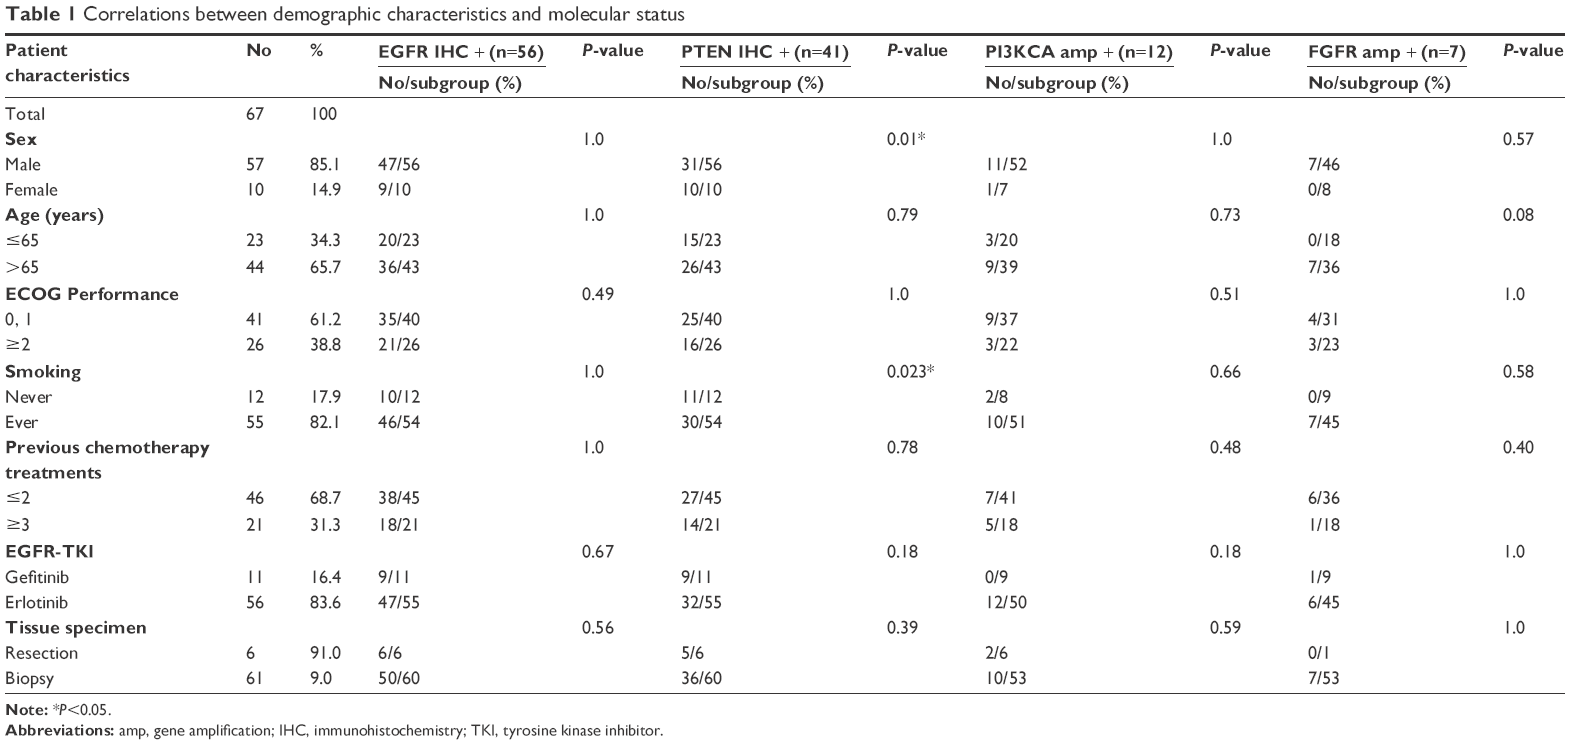 | Table 1 Correlations between demographic characteristics and molecular status |
Tumor response
Of the 55 patients available for response evaluation, two (4%) had a partial response, 26 (47%) had stable disease, and 27 (49%) had progressive disease as their best tumor response. Therefore, the objective response rate was 4%, and the disease control rate was 51%. There was no difference in objective response rate or disease control rate according to clinical or biomarker characteristics.
Survival outcome
For the total patient population, the median PFS and OS were 1.8 (95% CI: 1.4–2.1) and 5.5 months (95% CI: 3.6–7.3), respectively.
Analysis of PFS showed that EGFR ID expression and ECOG PS were significantly associated with PFS following EGFR-TKIs treatment (Figure 1). Multivariate analysis showed that EGFR ID expression and ECOG PS were independent factors for PFS, and EGFR ID expression was an independent factor for improved PFS (hazard ratio [HR] 0.53, 95% CI: 0.31–0.91, P=0.022) (Table 2). Patients with good PS of 0 or 1 were at lower risk of progression than those with poor PS (HR 0.43, 95% CI: 0.21–0.88, P=0.022) (Table 2).
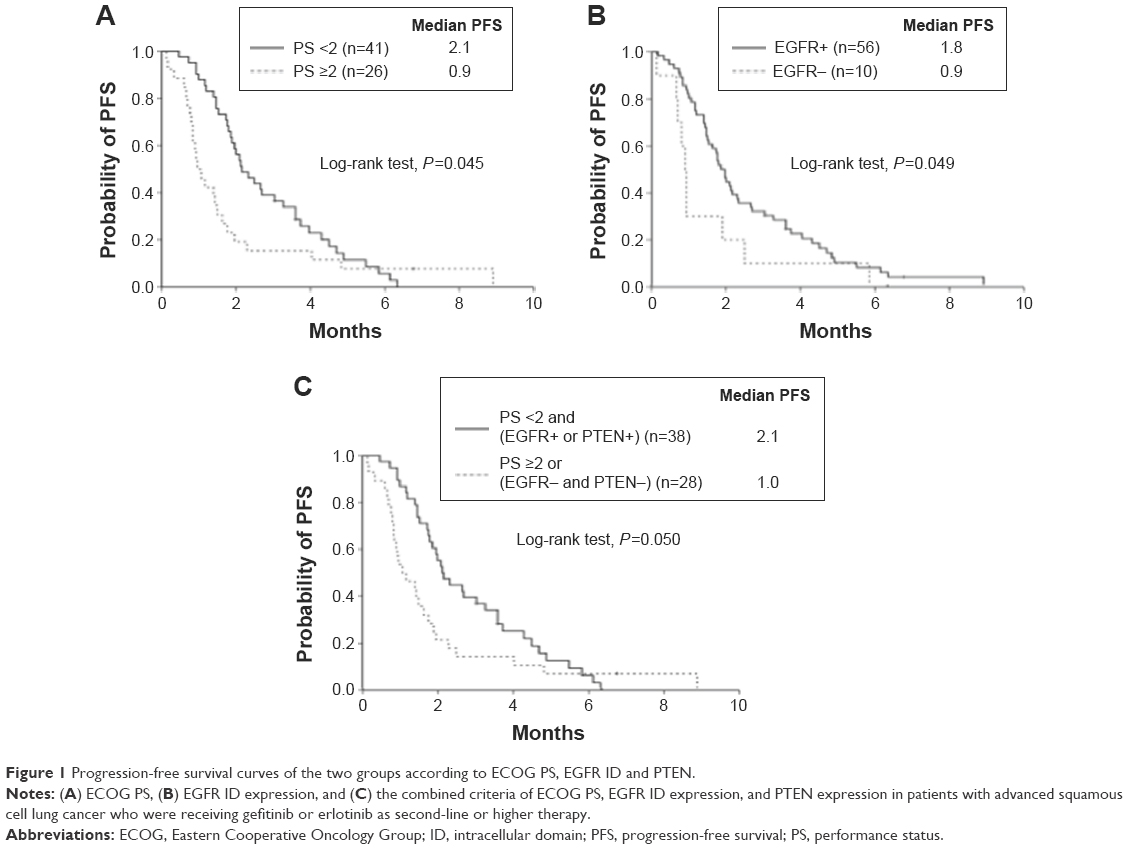 | Figure 1 Progression-free survival curves of the two groups according to ECOG PS, EGFR ID and PTEN. |
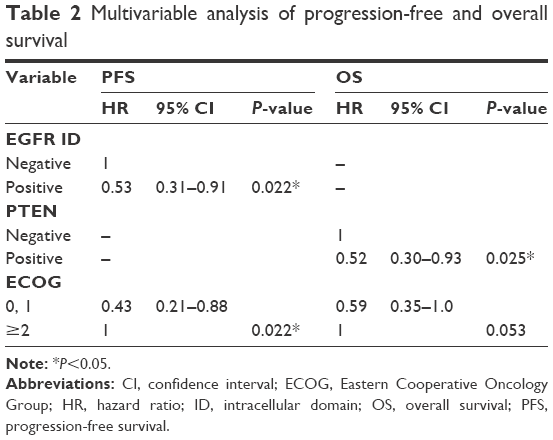 | Table 2 Multivariable analysis of progression-free and overall survival |
Analysis of OS revealed that PTEN expression and ECOG PS were significantly related to OS (Figure 2). In the multivariate analysis of OS, patients with PTEN expression were at a lower risk of death than PTEN-negative patients (HR 0.52, 95% CI: 0.30–0.93, P=0.025) (Table 2). ECOS PS of 0 or 1 showed borderline statistical significance (HR 0.59, 95% CI: 0.35–1.0, P=0.053) (Table 2). Neither PI3KCA amplification nor FGFR1 amplification was related with PFS or OS.
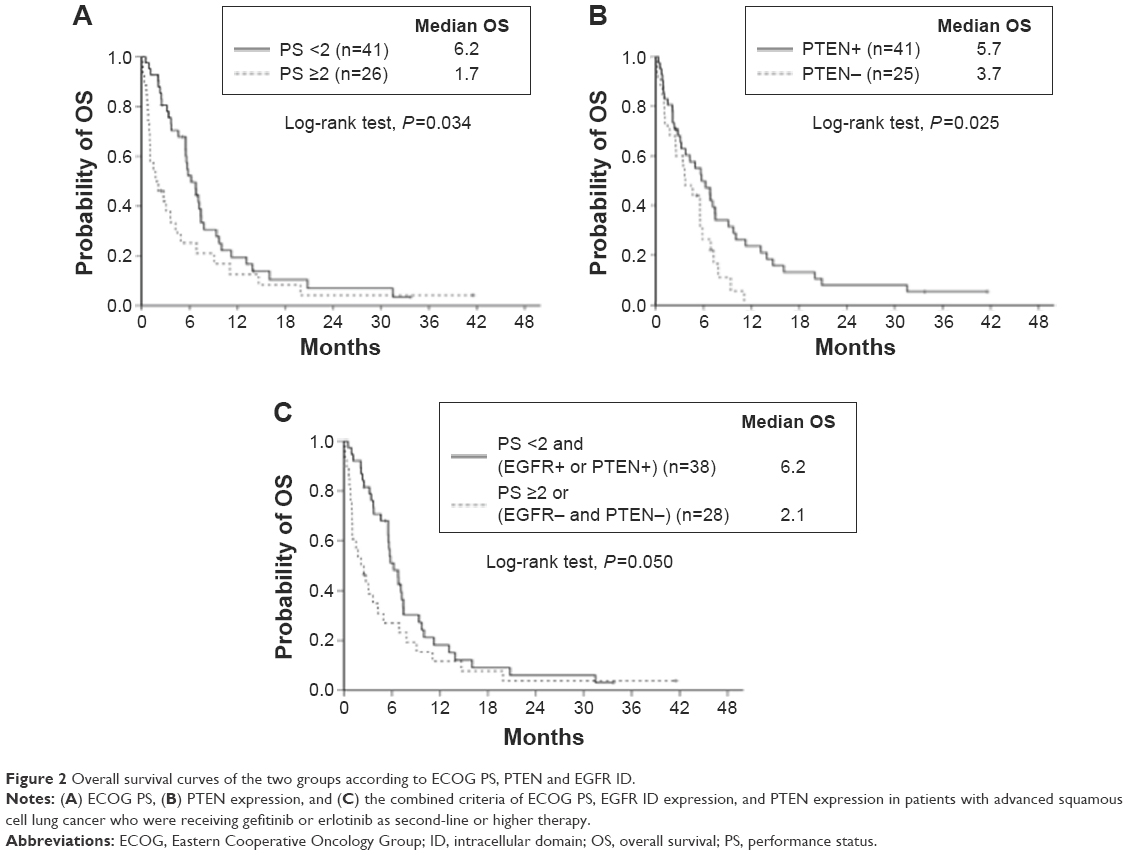 | Figure 2 Overall survival curves of the two groups according to ECOG PS, PTEN and EGFR ID. |
Combined EGFR ID/PTEN expression and ECOG PS
Treatment results for the subgroups were categorized according to the combined criteria of EGFR ID/PTEN expression and ECOG PS. The group of EGFR-positive or PTEN-positive patients with ECOG PS of 0 or 1 had better clinical outcomes than the groups who were EGFR- and PTEN-negative or who had poor ECOG PS with longer median PFS (2.1 [95% CI: 1.6–2.6] vs 1.0 month [95% CI: 0.4–1.6], respectively; P=0.05) and longer median OS (6.2 [95% CI: 4.8–7.5] vs 2.1 months [95% CI: 0.5–3.7], respectively; P=0.05) (Figures 1 and 2).
Discussion
We investigated molecular markers of clinical outcome for EGFR-TKI treatments in SCCL patients. To the best of our knowledge, this study is the first to show a strong association of EGFR ID and PTEN expressions with PFS and OS in EGFR wild-type SCCL treated with EGFR-TKI.
EGFR external domain protein expression is not recommended as a marker for predicting outcomes of treatment with EGFR-TKIs because of debatable clinical results. Some studies have indicated superior outcomes after EGFR-TKI treatment for lung cancer overexpressing the EGFR protein,9,10 whereas other studies have not.11 The discordant results of these studies may be due to inadequate sensitivity of these methods, lack of strictness in the evaluation, cohort differences, or confounding factors due to the concomitant administration of chemotherapy.11 EGFR protein expression using the ID-specific 5B7 antibody could predict response to gefitinib and increased PFS/OS from gefitinib in NSCLC patients.6 The antibody detects the SOCS3-binding epitope of the ID. Binding of SOCS3 to EGFR is assumed to inhibit the EGFR signaling pathway.12 Consequently, when SOCS3 is present, EGFR is inactive, and the 5B7 antibody cannot bind because of steric hindrance. The 5B7 antibody can only bind the receptor on this particular epitope, when SOCS3 is not present and cannot inhibit the EGFR pathway. This may explain the improved ability of 5B7-mediated detection of EGFR to predict the clinical benefit of EGFR-TKIs.6 In addition, 5B7 antibody is able to detect EGFR with truncation of the external domain, which was found in 5%–8% of SCCL.13 As the truncated-form of external domain is constitutively activated, use of an ID-specific antibody might better predict response to EGFR-TKIs than anti-EGFR antibody that detects the external domain. This hypothesis should be validated by further experimentation.
PTEN is a phosphatase that has a tumor suppressor function. Loss of PTEN activity leads to hyperactivation of the PIK3-AKT pathway. PTEN loss can occur at the genomic level or as an alternative mechanism as promoter hypermethylation, alternative splicing of pre-mRNA, and posttranslational modifications. The overall rate of PTEN inactivation is more frequent than that identified at the genomic level; for example, promoter methylation is found in 35% of PTEN-negative NSCLC.14 PTEN mutations are described in 10% of SCCL samples, compared with 2% of adenocarcinoma.15 The close relationship between the loss of PTEN expression and the poor clinical outcomes of NSCLC has been previously reported.16,17 Many studies have suggested that dysregulation of PI3K signaling is associated with resistance to receptor TKIs.18 Preclinical and clinical data for EGFR-mutant lung cancer have shown that PTEN loss is related to EGFR-TKIs resistance through the activation of downstream signaling pathways of EGFR.19,20 Endoh et al reported that high PTEN expression was related to longer survival in NSCLC patients with EGFR mutations who received gefitinib.19 In the present study, we have shown that PTEN-positive SCCL patients had increased OS compared with those who were PTEN-negative. Another novel result of our study was the association between PTEN expression and smoking history: the smoking dosage of patients who were PTEN-negative was higher than that of those who were PTEN-positive. Shin et al previously reported that the frequencies of retained PTEN expression were higher in patients with stage I NSCLC with no history of smoking,21 and in the study of Jin et al, all of the PTEN mutations were only detected in ever smokers.15 These findings suggest that PTEN loss is an oncogenic aberration in SCCL that is induced by cigarette smoking. Our observations are consistent with a previous study that showed that patients with a low EGFR copy number, PTEN loss, and PI3KCA gain according to FISH had significantly shorter PFS and OS than EGFR wild-type NSCLC patients.22 These complementary results suggest that EGFR and PTEN expression might be considered predictive markers of EGFR-TKI efficacy for EGFR wild-type NSCLC, including SCCL and non-SCCL. These preliminary observations must be validated in further studies.
As a clinical factor, ECOG PS is known to be associated with PFS of EGFR-mutant NSCLC patients treated with EGFR-TKI.23 This result was also noted in our study, suggesting that good ECOG PS in SCCL patients could be a potential positive predictor of benefit from EGFR-TKI treatment.
PI3K amplification is a frequent event in SCCL (12%–33%) and confers a growth advantage to SCCL cell lines.24 In our study, the frequency of PI3KCA amplification, as determined by real-time PCR, was 18% and compatible with the value of 13% that was obtained in a previous study of Japanese patients.24 FGFR1 plays central roles in cancer development, and in vivo studies have shown that inhibition of the FGFR1 signaling with FGFR inhibitors leads to substantial tumor reduction.25 Kim et al reported that the frequency of FGFR1 amplification in SCCL was 13%, which is compatible with the frequency that we observed (13%) among our SCCL patients.25 However, in our study, PI3KCA and FGFR1 amplification was not related to outcomes for SCCL patients treated with EGFR-TKIs.
In conclusion, EGFR protein expression using an ID-specific antibody and PTEN protein expression may be used to identify SCCL patients who are likely to benefit from EGFR-TKI treatment. However, due to the limitations of retrospective, single-institution studies with relatively small numbers of patients, future prospective clinical studies should be planned to validate our findings.
Acknowledgments
This study was supported by National Research Foundation of Korea Grant funded by the Korean Government (NRF-2013R1A1A2012866) and a grant (No 11-2012-002) from the SNUBH Research Fund.
Disclosure
Hyun Chang has received a research grant from AstraZeneca. The other authors report no conflicts of interest in this work.
References
Maemondo M, Inoue A, Kobayashi K, et al. Gefitinib or chemotherapy for non-small-cell lung cancer with mutated EGFR. N Engl J Med. 2010;362(25):2380–2388. | ||
Shepherd FA, Rodrigues Pereira J, Ciuleanu T, et al. Erlotinib in previously treated non-small-cell lung cancer. N Engl J Med. 2005;353(2):123–132. | ||
Kim ES, Hirsh V, Mok T, et al. Gefitinib versus docetaxel in previously treated non-small-cell lung cancer (INTEREST): a randomised phase III trial. Lancet. 2008;372(9652):1809–1818. | ||
Lee Y, Shim HS, Park MS, et al. High EGFR gene copy number and skin rash as predictive markers for EGFR tyrosine kinase inhibitors in patients with advanced squamous cell lung carcinoma. Clin Cancer Res. 2012;18(6):1760–1768. | ||
Chang H, Zhang X, Cho BC, Park HJ, Kim J-H. Tumor MET expression profile predicts the outcome of non-small cell lung cancer patients receiving epidermal growth factor receptor tyrosine kinase inhibitors. Thorac Cancer. 2014;5(6):517–524. | ||
Mascaux C, Wynes MW, Kato Y, et al. EGFR protein expression in non-small cell lung cancer predicts response to an EGFR tyrosine kinase inhibitor – a novel antibody for immunohistochemistry or AQUA technology. Clin Cancer Res. 2011;17(24):7796–7807. | ||
Marsit CJ, Zheng S, Aldape K, et al. PTEN expression in non-small-cell lung cancer: evaluating its relation to tumor characteristics, allelic loss, and epigenetic alteration. Hum Pathol. 2005;36(7):768–776. | ||
Schildhaus HU, Heukamp LC, Merkelbach-Bruse S, et al. Definition of a fluorescence in-situ hybridization score identifies high- and low-level FGFR1 amplification types in squamous cell lung cancer. Mod Pathol. 2012;25(11):1473–1480. | ||
Cappuzzo F, Hirsch FR, Rossi E, et al. Epidermal growth factor receptor gene and protein and gefitinib sensitivity in non-small-cell lung cancer. J Natl Cancer Inst. 2005;97(9):643–655. | ||
Cappuzzo F, Ciuleanu T, Stelmakh L, et al. Erlotinib as maintenance treatment in advanced non-small-cell lung cancer: a multicentre, randomised, placebo-controlled phase 3 study. Lancet Oncol. 2010;11(6):521–529. | ||
Gatzemeier U, Pluzanska A, Szczesna A, et al. Phase III study of erlotinib in combination with cisplatin and gemcitabine in advanced non-small-cell lung cancer: the Tarceva Lung Cancer Investigation Trial. J Clin Oncol. 2007;25(12):1545–1552. | ||
Xia L, Wang L, Chung AS, et al. Identification of both positive and negative domains within the epidermal growth factor receptor COOH-terminal region for signal transducer and activator of transcription (STAT) activation. J Biol Chem. 2002;277(34):30716–30723. | ||
Heist RS, Sequist LV, Engelman JA. Genetic changes in squamous cell lung cancer: a review. J Thorac Oncol. 2012;7(5):924–933. | ||
Soria JC, Lee HY, Lee JI, et al. Lack of PTEN expression in non-small cell lung cancer could be related to promoter methylation. Clin Cancer Res. 2002;8(5):1178–1184. | ||
Jin G, Kim MJ, Jeon HS, et al. PTEN mutations and relationship to EGFR, ERBB2, KRAS, and TP53 mutations in non-small cell lung cancers. Lung Cancer. 2010;69(3):279–283. | ||
Lim WT, Zhang WH, Miller CR, et al. PTEN and phosphorylated AKT expression and prognosis in early- and late-stage non-small cell lung cancer. Oncol Rep. 2007;17(4):853–857. | ||
O’Byrne KJ, Gatzemeier U, Bondarenko I, et al. Molecular biomarkers in non-small-cell lung cancer: a retrospective analysis of data from the phase 3 FLEX study. Lancet Oncol. 2011;12(8):795–805. | ||
Guix M, Faber AC, Wang SE, et al. Acquired resistance to EGFR tyrosine kinase inhibitors in cancer cells is mediated by loss of IGF-binding proteins. J Clin Invest. 2008;118(7):2609–2619. | ||
Endoh H, Yatabe Y, Kosaka T, et al. PTEN and PIK3CA expression is associated with prolonged survival after gefitinib treatment in EGFR-mutated lung cancer patients. J Thorac Oncol. 2006;1(7):629–634. | ||
Yamamoto C, Basaki Y, Kawahara A, et al. Loss of PTEN expression by blocking nuclear translocation of EGR1 in gefitinib-resistant lung cancer cells harboring epidermal growth factor receptor-activating mutations. Cancer Res. 2010;70(21):8715–8725. | ||
Shin E, Choi CM, Kim HR, Jang SJ, Park YS. Immunohistochemical characterization of the mTOR pathway in stage-I non-small-cell lung carcinoma. Lung Cancer. 2015;89(1):13–18. | ||
Fidler MJ, Morrison LE, Basu S, et al. PTEN and PIK3CA gene copy numbers and poor outcomes in non-small cell lung cancer patients with gefitinib therapy. Br J Cancer. 2011;105(12):1920–1926. | ||
Keam B, Kim DW, Park JH, et al. Nomogram predicting clinical outcomes in non-small cell lung cancer patients treated with epidermal growth factor receptor tyrosine kinase inhibitors. Cancer Res Treat. 2014;46(4):323–330. | ||
Kawano O, Sasaki H, Okuda K, et al. PIK3CA gene amplification in Japanese non-small cell lung cancer. Lung Cancer. 2007;58(1):159–160. | ||
Kim HR, Kim DJ, Kang DR, et al. Fibroblast growth factor receptor 1 gene amplification is associated with poor survival and cigarette smoking dosage in patients with resected squamous cell lung cancer. J Clin Oncol. 2013;31(6):731–737. |
Supplementary materials
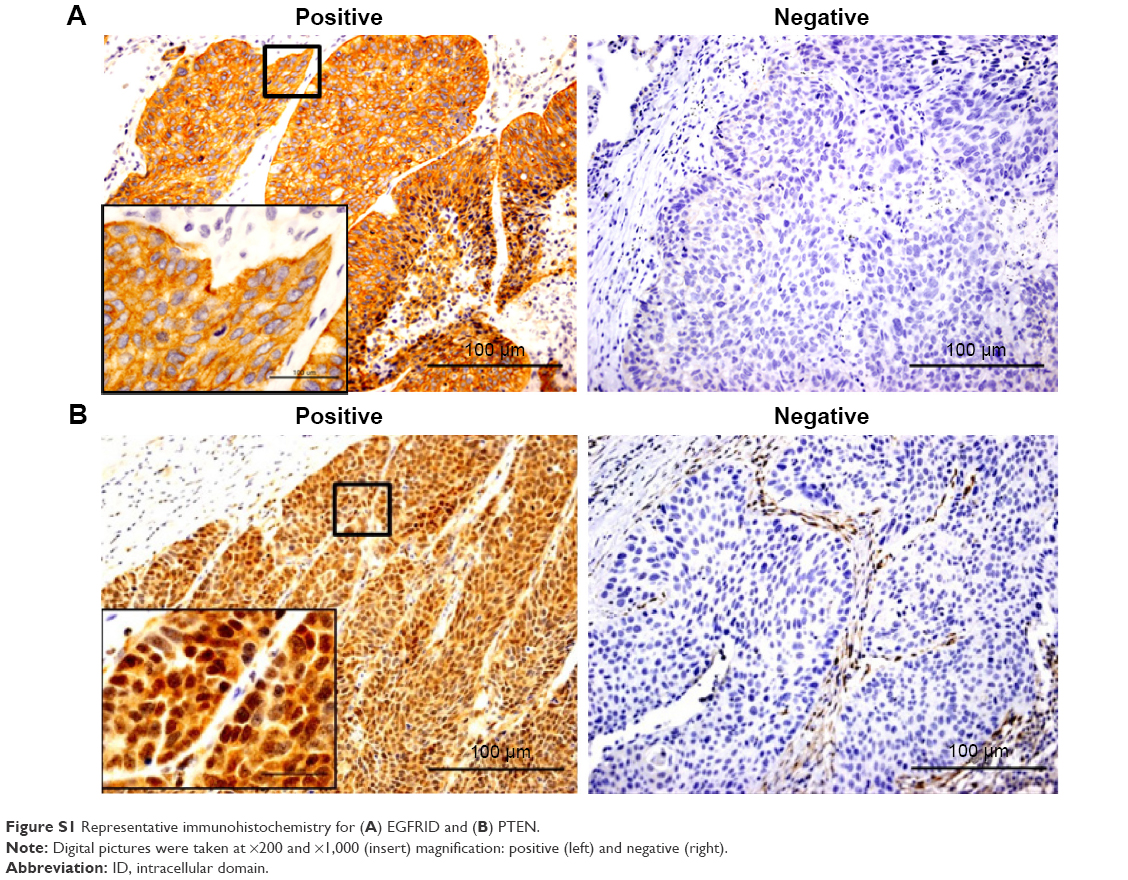 | Figure S1 Representative immunohistochemistry for (A) EGFRID and (B) PTEN. |
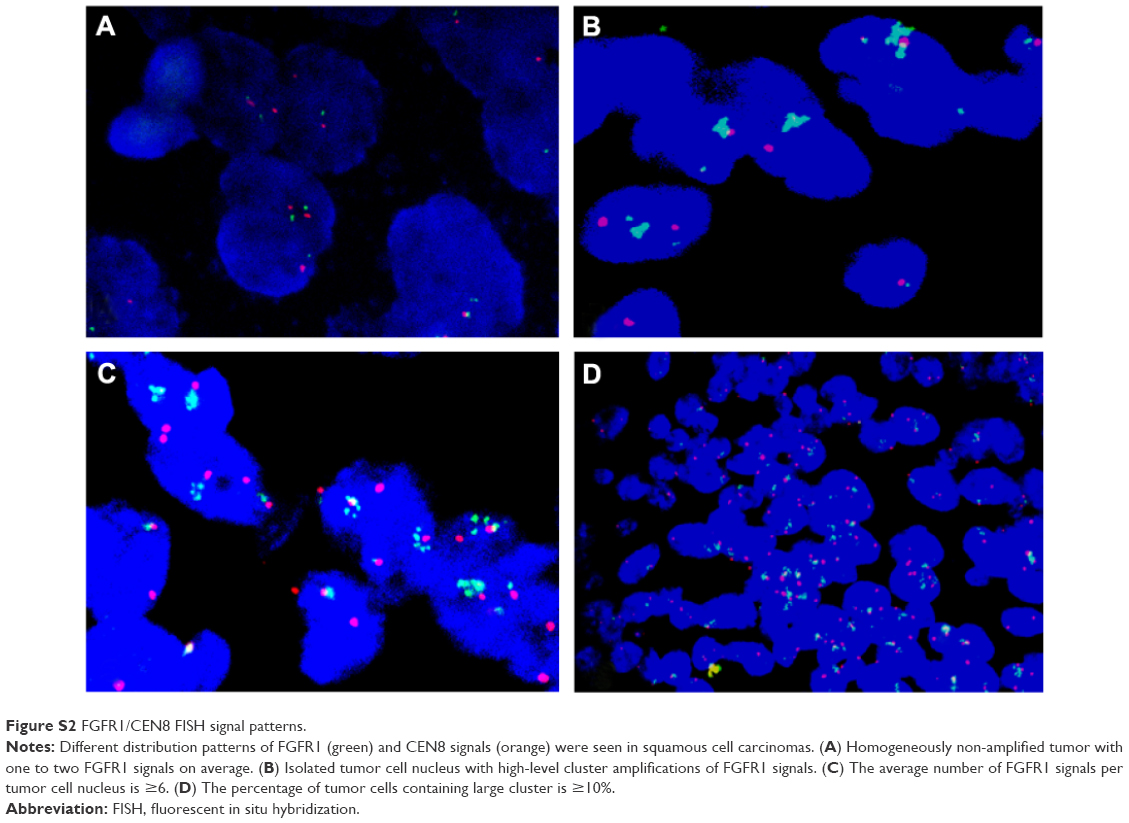 | Figure S2 FGFR1/CEN8 FISH signal patterns. |
 © 2016 The Author(s). This work is published and licensed by Dove Medical Press Limited. The
full terms of this license are available at https://www.dovepress.com/terms
and incorporate the Creative Commons Attribution
- Non Commercial (unported, 3.0) License.
By accessing the work you hereby accept the Terms. Non-commercial uses of the work are permitted
without any further permission from Dove Medical Press Limited, provided the work is properly
attributed. For permission for commercial use of this work, please see paragraphs 4.2 and 5 of our Terms.
© 2016 The Author(s). This work is published and licensed by Dove Medical Press Limited. The
full terms of this license are available at https://www.dovepress.com/terms
and incorporate the Creative Commons Attribution
- Non Commercial (unported, 3.0) License.
By accessing the work you hereby accept the Terms. Non-commercial uses of the work are permitted
without any further permission from Dove Medical Press Limited, provided the work is properly
attributed. For permission for commercial use of this work, please see paragraphs 4.2 and 5 of our Terms.