Back to Journals » Cancer Management and Research » Volume 12
EGFR Promotes the Development of Triple Negative Breast Cancer Through JAK/STAT3 Signaling
Received 30 July 2019
Accepted for publication 7 November 2019
Published 30 January 2020 Volume 2020:12 Pages 703—717
DOI https://doi.org/10.2147/CMAR.S225376
Checked for plagiarism Yes
Review by Single anonymous peer review
Peer reviewer comments 2
Editor who approved publication: Dr Eileen O'Reilly
Xiang Song,1 Zhaoyun Liu,1,2 Zhiyong Yu1
1Department of Oncology, Shandong Cancer Hospital and Institute, Shandong First Medical University and Shandong Academy of Medical Sciences, Jinan 250117, Shandong, People’s Republic of China; 2School of Medicine, Shandong University, Jinan, People’s Republic of China
Correspondence: Zhiyong Yu
Department of Oncology, Shandong Cancer Hospital and Institute, Shandong First Medical University and Shandong Academy of Medical Sciences, 440 Jiyan Road, Jinan 250117, Shandong, People’s Republic of China
Email [email protected]
Purpose: To investigate the role of EGFR and STAT3 in breast cancer development and progression.
Methods: Through bioinformatics analysis differently expressed genes (DEGs) including EGFR and STAT3 were identified in breast cancer tissue. QRT-PCR and Western blot analysis were used to investigate EGFR and STAT3 levels in breast cancer tissues and cells. The influence of EGFR and STAT3 on the breast cancer cell proliferation (CCK-8 assay, clone formation assays), migration (wound healing assays) and invasion (transwell assays) were investigated. The influence of EGFR on breast cancer in vivo was examined by Nude mouse transplantation tumor experiments and immunohistochemistry (IHC) staining. The effects of EGFR on breast cancer signaling were assessed via Western blot.
Results: Both EGFR and p-STAT3 were up-regulated in breast cancer tissues and cell lines. EGFR expression was positively associated with p-STAT3. Moreover, EGFR and p-STAT3 activity enhanced the proliferation and invasion of tumor cells. Breast cancer cell growth was dramatically inhibited by EGFR silencing in vivo.
Conclusion: EGFR promotes breast cancer progression via STAT3 phosphorylation and JAK/STAT3 signaling.
Keywords: EGFR, STAT3, p-STAT3, breast cancer
Introduction
Approximately 16% of all breast cancer patients are diagnosed with primary triple negative breast cancers (TNBC). Younger patients or African-American women are most vulnerable to TNBC.1 TNBC lacks estrogen receptor (ER) and progesterone receptor (PR) overexpression and human epidermal growth factor receptor 2 (HER2) amplification.2–4 TNBC is typically associated with a large size, higher grade, lymph node involvement at diagnosis and biological aggression.5 In addition, patients with TNBC, despite the higher rates of clinical response to pre-surgical chemotherapy, are prone to distant recurrence and poorer prognosis than other breast cancer patients.6 Due to its heterogeneity and lack of defined molecular targets, TNBC treatment remains challenging.
Epidermal growth factor receptor (EGFR), also termed ErbB1/HER1, is the prototype of the EGFR family that includes ErbB2/HER2/Neu, ErbB3/HER3, and ErbB4/HER4.7 EGFR is a proto-oncogene that enhances cell proliferation and survival. Lee et al suggested that ubiquitin-associated and SH3 domain-containing B was overexpressed in TNBC, which supported malignant growth, invasion, and metastasis largely through modulating EGFR.8 Sun et al identified that PTPN12 suppressed transformation by interacting with and inhibiting multiple oncogenic tyrosine kinases in TNBC, including HER2 and EGFR.9 A range of EGFR-targeting therapies exist that target its complex signaling network.10
Signal transducer and activator of transcription (STAT) is related to inflammation-associated tumorigenesis, which has emerged as an environmental or genetic alteration in malignant cells.11–13 The STAT family, particularly STAT3, maintains a pro-carcinogenic inflammatory microenvironment during malignant transformation and cancer progression.14,15 Initially, Catlett et al reported that STAT3 was constitutively activated in bone marrow mononuclear cells from patients with multiple myeloma and activated STAT3 signaling that contributes to the pathogenesis of multiple myeloma through the prevention of apoptosis. Noticeably, Gao et al demonstrated that mutant EGFR could activate gp130/JAK/STAT3 pathways via IL-6 upregulation in primary human lung adenocarcinomas.16 However, the role of EGFR and STAT3 in TNBC remain largely undefined.
In this study, we analyzed data generated from both ChIP-seq and microarray analysis of breast cancer tissue. We performed bioinformatics to evaluate the regulatory effects of EGFR between TNBC and normal samples. From these analyses, the significance of EGFR and STAT3 in TNBC were identified. We provide further data suggesting that the effects of EGFR on TNBC are through the regulation of STAT3 during JAK/STAT3 signaling.
Methods
Tissue Samples and Cell Culture
Twenty pairs of tissue from TNBC patients were analyzed. The criteria for TNBC included negativity for ER, PR and HER2, an original histological diagnosis of invasive breast carcinoma, and the efficiency of clinical pathological data. Specimens were frozen in liquid nitrogen (−80°C) for analysis. The study was approved by the Ethical Committee of Shandong Cancer Hospital affiliated to Shandong University (No.SDTHEC201001031) and each patient provided informed consent. MCF-7, MDA-MB-231 and MCF-10A cells were purchased from the Bena Culture Collection. Cells were cultured in Dulbecco’s modified Eagle medium (DMEM) supplemented with 10% fetal bovine serum (FBS), 1% penicillin-streptomycin and 1% non-essential amino acids and cultured at 5% CO2 at 37°C. Medium was replaced every 2 d. When cells were 80–90% confluent, cells were passaged at a culture ratio of 1:1. Cells in the logarithmic growth phase were assessed for further experiments.
Bioinformatics Analysis
RNA samples were obtained from 6 patients with breast cancer and near normal tissue from the Gene Expression Omnibus (GEO) database. Sequence reads that passed quality filters were mapped to the human genome (hg19) by hisat2. For RNA-seq analysis, we compared the reads of each sample to the genome, calculated the read count values of each gene, and identified DEGs between the two conditions (P value < 0.05 and |fold change|>2 in gene expression). Gene ontology analysis was performed using the online website Metascape (http://metascape.org/gp/index.html#/main/step1). MCODE descriptions are shown in Table 1.
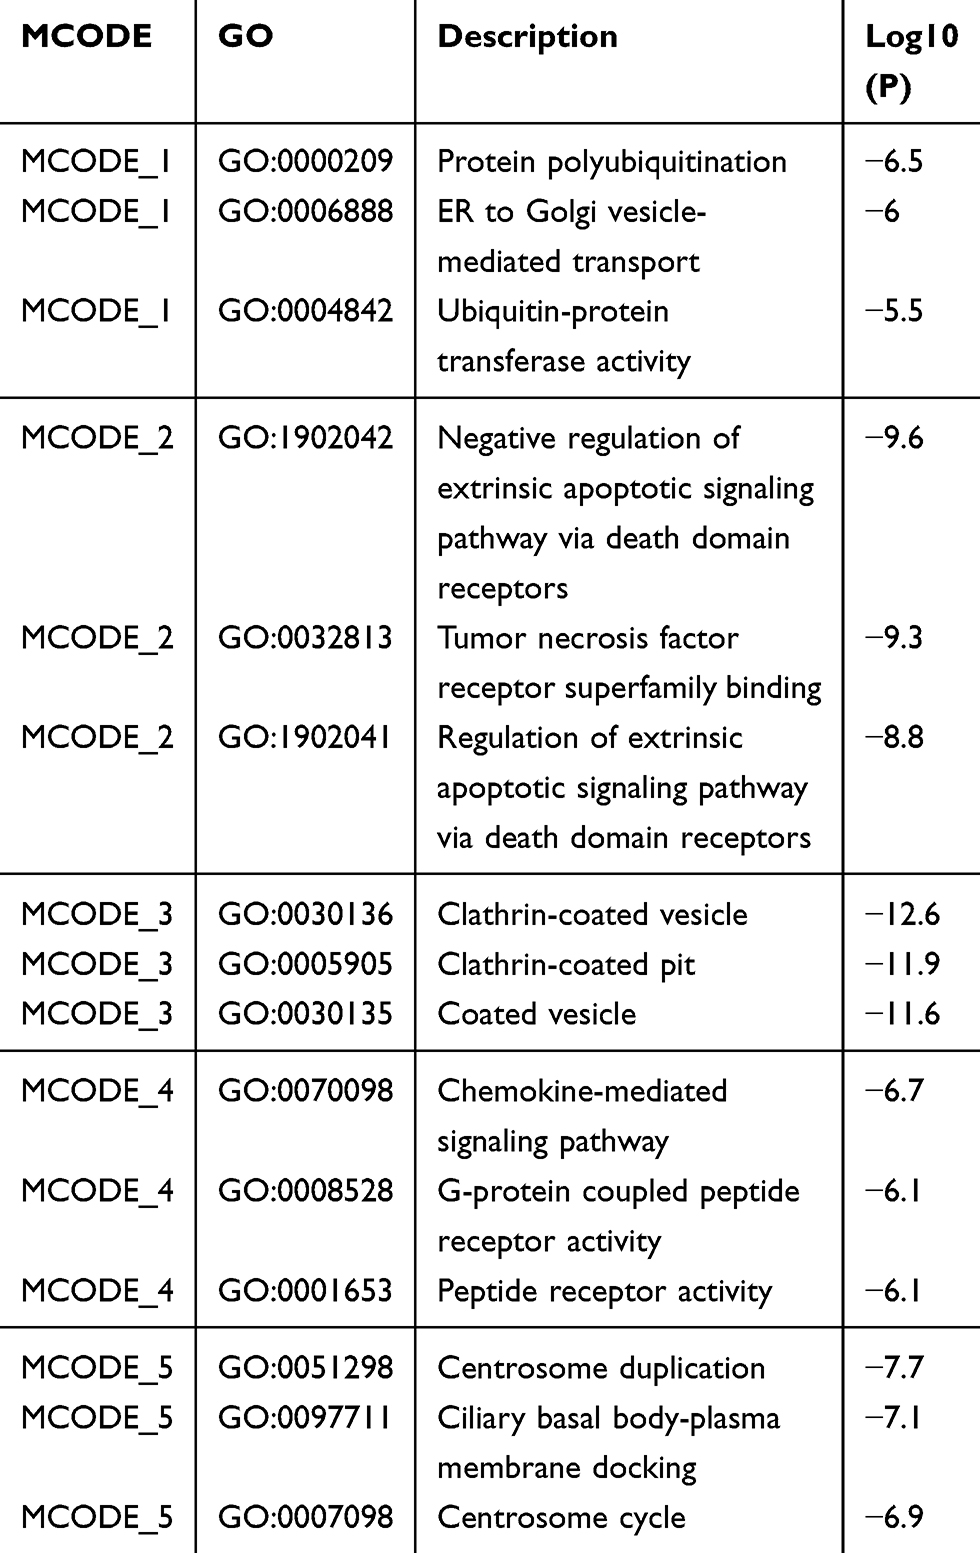 |
Table 1 MCODE Description |
Cell Transfection
MIF-10A, MCF-7 and MDA-MB-231 cells were seeded into 6-well plates and transfected with siRNAs using Lipofectamine 2000 according to manufacturers instructions. Ruxolitinib and STAT3 inhibitor III were purchased from Selleck Chemicals (Houston, TX, USA) and were added to cells for 24 h. The experiments were repeated at least three times.
qRT-PCR
TRIzol was used to extract total mRNA which was reverse transcribed into cDNA at 25°C for 10 min; 50°C for 30 min; and 85°C for 5 min. Fluorescent-based qRT-PCR was used to quantify cDNA synthesis. PCR conditions: 95°C for 5 min; 95°C for 15 s and 60°C for 1 min; 40 cycles. Primers are shown in Table 2. The experiments were repeated at least three times.
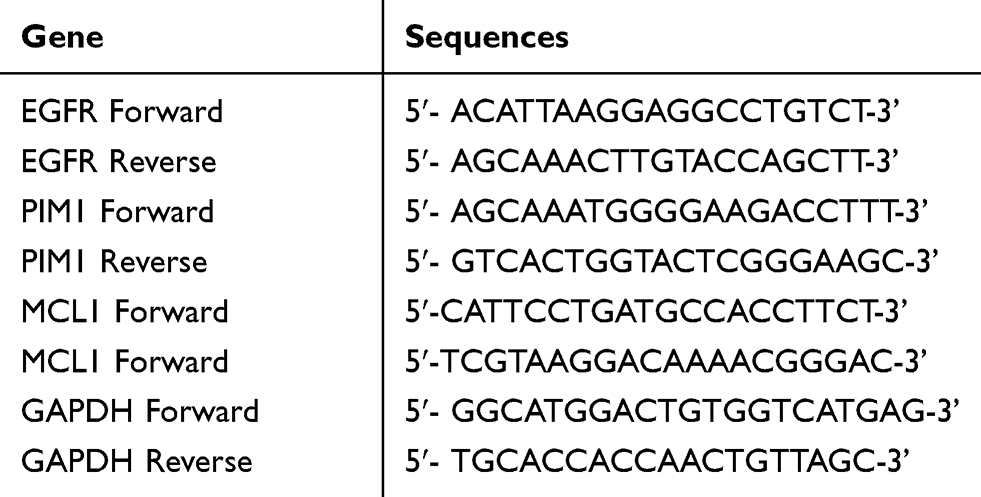 |
Table 2 Sequences of Primers for RT-qPCR |
Western Blotting
Cells were washed in pre-cooled PBS and lysed in RIPA buffer. Lysates were centrifuged to remove cell debris and proteins (20 μg) were mixed with 5 × SDS loading buffer for denaturation for 5 min at 100 °C. Proteins were resolved by SDS-PAGE electrophoresis and transferred onto PVDF membranes. Membranes were blocked in 5% skimmed milk powder for 1 h and probed with primary antibodies including anti-EGFR (ab52894, 1/1000, Abcam, Cambridge, MA, USA), anti-STAT3 (ab119352, 1/5000, Abcam, Cambridge, MA, USA), anti-MCL1 (ab32087, 1/1000, Abcam, Cambridge, MA, USA), anti-PIM1 (ab54503, 1 µg/mL, Abcam, Cambridge, MA, USA), anti-GAPDH (ab8245, 1/500, Abcam, Cambridge, MA, USA) were added overnight at 4°C. Membranes were washed in TBS-T and labeled with HRP-conjugated secondary antibodies (anti-rabbit IgG, 1:1000, Proteintech) at room temperature for 1 h. Membranes were washed in TBST and gray value analysis was performed using Image J software to quantify band intensities. Values were normalized to α-actin expression. The experiments were repeated at least three times.
CCK-8 Assays
CCK-8 kits (Beyotime Institute of Biotechnology, Beijing, China) were used to measure cell proliferation. Cells (4 × 10³ per well) were cultured in 96-well plates (Corning Costar, NY, USA) and absorbances were measured at 450 nm using a microplate reader (BioTek, Winooski, VT, USA). Experiments were repeated on three occasions. The experiments were repeated at least three times.
Co-Immunoprecipitation
Cells were lysed in RPIA buffer and 5 μg of rabbit polyclonal anti-EGFR, anti-p-STAT3 or non-immunized rabbit IgG were added to the lysates overnight at 4 °C. Immuno-complexes were formed through the addition of protein A/G magnetic beads and proteins were purified and subjected to Western blot assays to determine the expression of p-STAT3 and EGFR. The experiments were repeated at least three times.
Colony Formation Assays
Cells were seeded into six-well plates at a density of 500 cells per well and exposed to DHT alone or DHT plus G-1. Colonies were fixed in methanol and stained with 0.5% crystal violet in absolute ethanol for 2-weeks. Colonies with ≥ 50 cells were counted on a dissection microscope. Experiments were repeated on a minimum of three occasions. The experiments were repeated at least three times.
Transwell Assays
Cell suspensions (100 μL) were added to the upper chambers of transwell assays plates and 600 μL of complete medium was added to the lower wells. Cells were then fixed stained and imaged and the number of migrating cells were counted. The experiments were repeated at least three times.
Wound-Healing Assays
Cells were seeded into 6-well plates in serum-free DMEM and at 90–100% confluency, a wound was produced using a 10 μL spearhead perpendicular to the bottom of the plate. Cells were washed three times in PBS and the migration distances were measured at 0 h and 24 h on a light microscope. The experiments were repeated at least three times.
Immunohistochemistry (IHC) Staining and Evaluation
Tissues were subject to xylene and ethanol and citrate buffer to deparaffinize the slides. Sections were probed with rabbit anti-Ki67 antibodies (ab15580, 1:500, Abcam) and Goat anti-mouse lgG H&L (HRP) (ab6785, 1:1000, Abcam). Sections were imaged by microscopy (Aiovert 200, Carl Zeiss). The experiments were repeated at least three times.
Statistical Analysis
All data are shown as the mean ± standard deviation of at least three independent experiments. A Student’s t-test was used for group comparisons. A one-way analysis of variance (ANOVA) was used for multi-group comparisons. For all tests, a P<0.05 was used to indicate statistical differences. Data were analyzed on GraphPad Prism version 6.0 (GraphPad Software, Inc., La Jolla, CA, USA) and SPSS version 20.0 (SPSS Inc., Chicago, IL, USA). The experiments were repeated at least three times.
Results
Bioinformatics Analysis
RNA-seq quality controls were reached in control and tumor groups (Figure 1A and B) and p-STAT3 was identified with high transcriptional activity in tumor tissue (Figure 2A–C). Based on the RNA expression profiles of glioma patients from the gene expression omnibus (GEO), we screened out differentially expressed mRNAs in breast cancer. The top-10 significantly up and down regulated mRNAs are shown in the heat maps (Figure 3A). Amongst the differentially expressed RNAs, we selected the highly-expressed EGFR due to its known roles in breast cancer (Figure 3B). KEGG analysis showed that JAK/STAT signaling was activated in the tumor groups (Figure 3C). GSEA analysis showed that JAK-STAT signaling was up‐regulated according to the DEGs of breast cancer. (Figure 3D). Gene ontology analysis determined different gene enrichment conditions in biological processes (BP), cellular components (CC) and molecular functions (MF) (Figure 4). In this research, we just focused on and verified the EGFR and JAK/STAT3 signal pathway, but the other key molecules, which are noteworthy, may play key role in TNBC, such as PRRX1 and FGFB1 (Figure 3A and B).
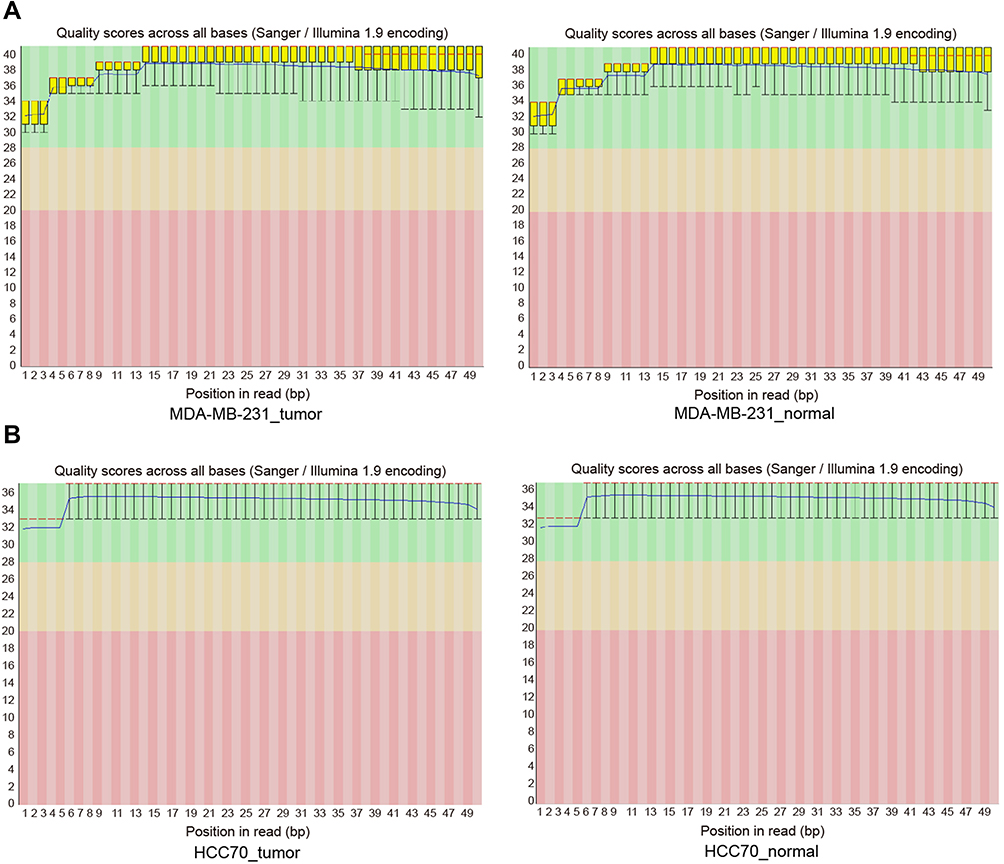 |
Figure 1 (A, B) Quality control chart of the RNA-seq. |
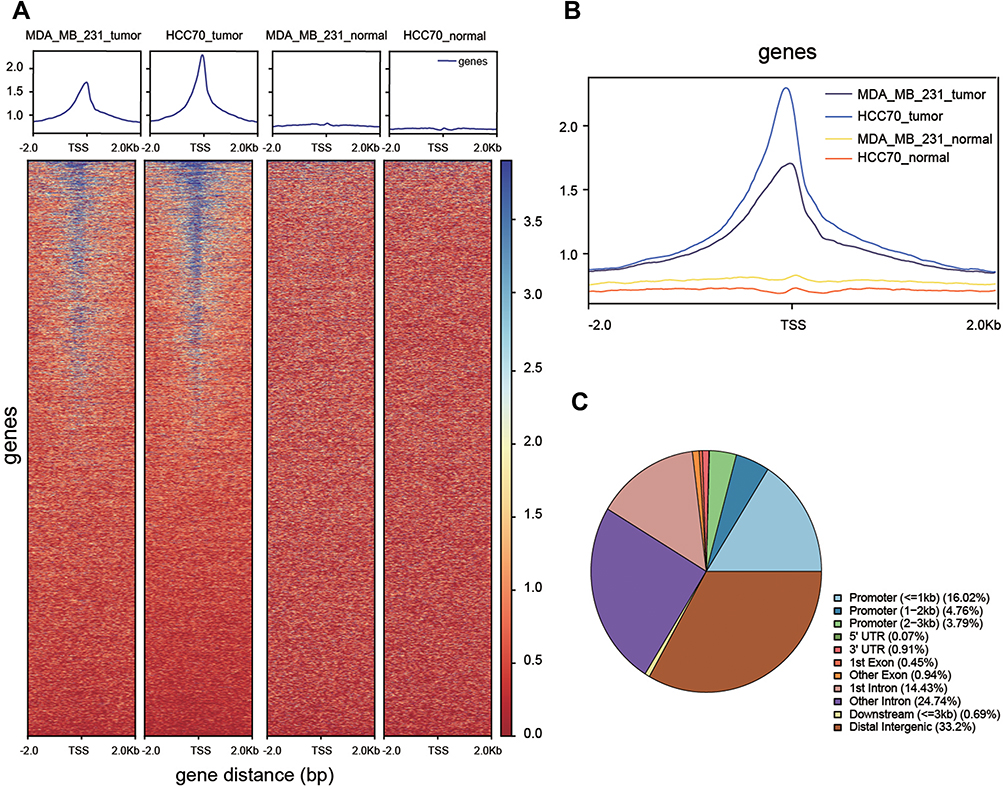 |
Figure 2 Functional verification of transcription factors. (A, B) Differences in transcriptional activity between tumor and normal groups. (C) Pie chart of location probability for transcription factor binding sites. |
 |
Figure 3 Gene screening and KEGG pathway analysis. (A) The 10 most significantly up-and-down regulated genes in tumor and normal groups. (B) Intersection of the genes were screened (C, D). KEGG analysis showing that JAK/STAT signaling is activated in tumor groups. |
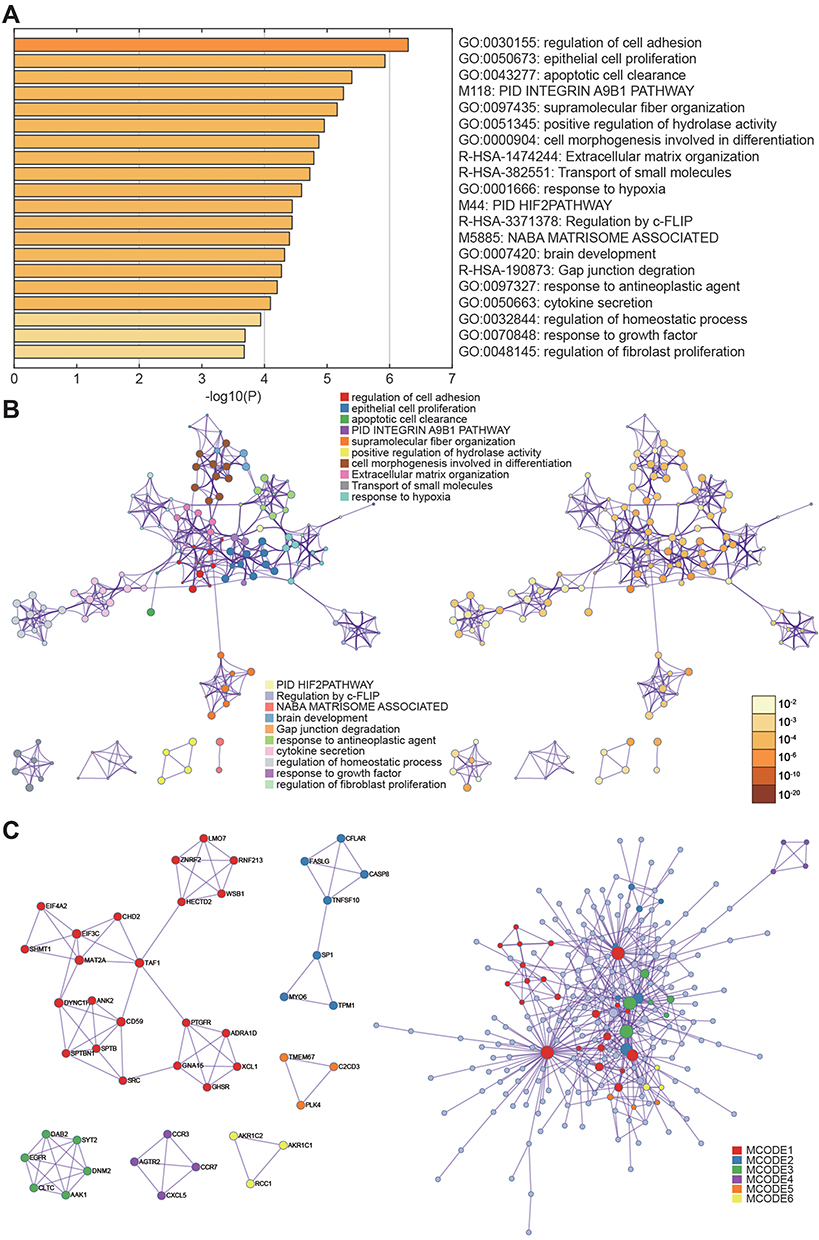 |
Figure 4 Gene ontology analysis. (A, B) Selected genes were clustered with different gene functions. (C) P-values of the differential gene function enrichment. |
EGFR and p-STAT3 are Upregulated in Breast Cancer Tissues and Cells
The expression of EGFR in breast cancer tissues was detected by qRT-PCR. EGFR was upregulated in cancer tissue compared to adjacent tissues (Figure 5A). The levels of EGFR expression were determined in three different cancer cell lines including MCF-7, MDA-MB-231 and normal breast epithelial cell line MCF-10A. Similar data were observed in tissue samples (Figure 5B). EGFR expression was significantly down-regulated following silencing (P<0.01, Figure 5C). EGFR and p-STAT3 were highly-expressed in breast cancer tissues and cells (Figure 5D and E). Following EGFR overexpression, p-STAT3 was upregulated. Similarly, EGFR silencing led to a loss of p-STAT3 (P<0.01, Figure 5F).
 |
Figure 5 EGFR and phosphorylated STAT3 are highly expressed in breast cancer tissues. (A) RT-qPCR analysis of EGFR expression in tumor tissues and adjacent noncancerous tissues. (B) RT-qPCR analysis of EGFR expression in MCF-10A, MCF-7 and MDA-MB-231 cells. (C) Relative expression levels of EGFR following its overexpression or silencing. (D, E) Western blot analysis of EGFR, STAT3 and phosphorylated STAT3 in tumor tissues, adjacent tissues and cell lines. (F) Immunoprecipitation analysis of phosphorylated STAT3 following EGFR overexpression or silencing. *P<0.05.**P<0.01. |
EGFR Promotes the Proliferation and Invasion of Cancer Cells Through p-STAT3
Western blot analysis showed that EGFR could promote the phosphorylation of STAT3 (Figure 6A). CCK-8 and colony formation assays demonstrated that in MCF-7 and MDA-MB-231 cells, the overexpression of EGFR promoted cell proliferation (P<0.01), which was reduced by STAT3 inhibitor III or EGFR silencing (Figure 6B). Wound healing assays showed that tumor cell proliferation was enhanced by EGFR. The effects of EGFR on cell proliferation were blocked by the STAT3 inhibitor III (Figure 6C). EGFR also promoted tumor cell invasion (P<0.01, Figure 7).
 |
Figure 6 EGFR regulates the proliferation of tumor cells through STAT3. (A, B) CCK8 and colony formation assays demonstrated that EGFR and STAT3 influence cell proliferation. (C) Wound healing assays showed that tumor cell proliferation was affected by EGFR and STAT3 and could be prevented by the STAT3 inhibitor III. **P<0.01. |
 |
Figure 7 EGFR regulates the invasion of tumor cells through STAT3. Transwell assays showed that tumor cell proliferation was affected by EGFR and STAT3. Effects of EGFR on cell proliferation could be prevented by the STAT3 inhibitor III. **P<0.01. |
EGFR Activates JAK/STAT3 Signaling
We found that MCL1 and PIM1, as the important downstream proteins of JAK/STAT3 signaling, were highly expressed in breast cancer tissues or cells in the EFGR overexpression group. Accordingly, their relative expression was significantly reduced in the presence of the STAT3 inhibitor or following EGFR silencing (P<0.01, Figure 8A-B). Following JAK/STAT3 inhibition by Ruxolitinib, the relative expression of MCL1 and PIM1 decreased (P<0.01, Figure 9A) and tumor cell proliferation and invasion were inhibited (P<0.01, Figure 9B–D).
 |
Figure 8 EGFR and STAT3 affect JAK/STAT3 signaling. (A, B) Dysregulated expression of JAK/STAT3 signaling components assessed by RT-qPCR and Western blot analysis in tumor cells. (C) Western blot demonstrating that JAK/STAT3 signaling is regulated by EGFR and STAT3. The effects of EGFR on cell proliferation could be prevented by the STAT3 inhibitor III. **P<0.01. |
 |
Figure 9 EGFR and STAT3 affect tumor growth through JAK/STAT3 signaling. (A–D) CCK8 assay, colony formation and wound healing assays showed that the JAK/STAT3 inhibitor Ruxolitinib could suppress tumor cell proliferation and invasion. **P<0.01. |
EGFR Silencing Inhibits Tumor Growth
Compared to the NC group, lower levels of EGFR expression inhibited the proliferation of subcutaneous tumors. The volume of the tumors in the mimics group were smaller than those of the NC group. (P<0.01, Figure 10A). On the 31th day, nude mice were sacrificed and tumors were removed and measured. Following EGFR silencing, MCL1, PIM1 and pSTAT3 expression were dramatically reduced (P<0.01, Figure 10B and C). In vivo experiments confirmed that EGFR silencing could inhibit the proliferation of breast cancer cells. This further verified that EGFR regulates breast cancer signaling by regulating the JAK/STAT3 axis via STAT3 phosphorylation.
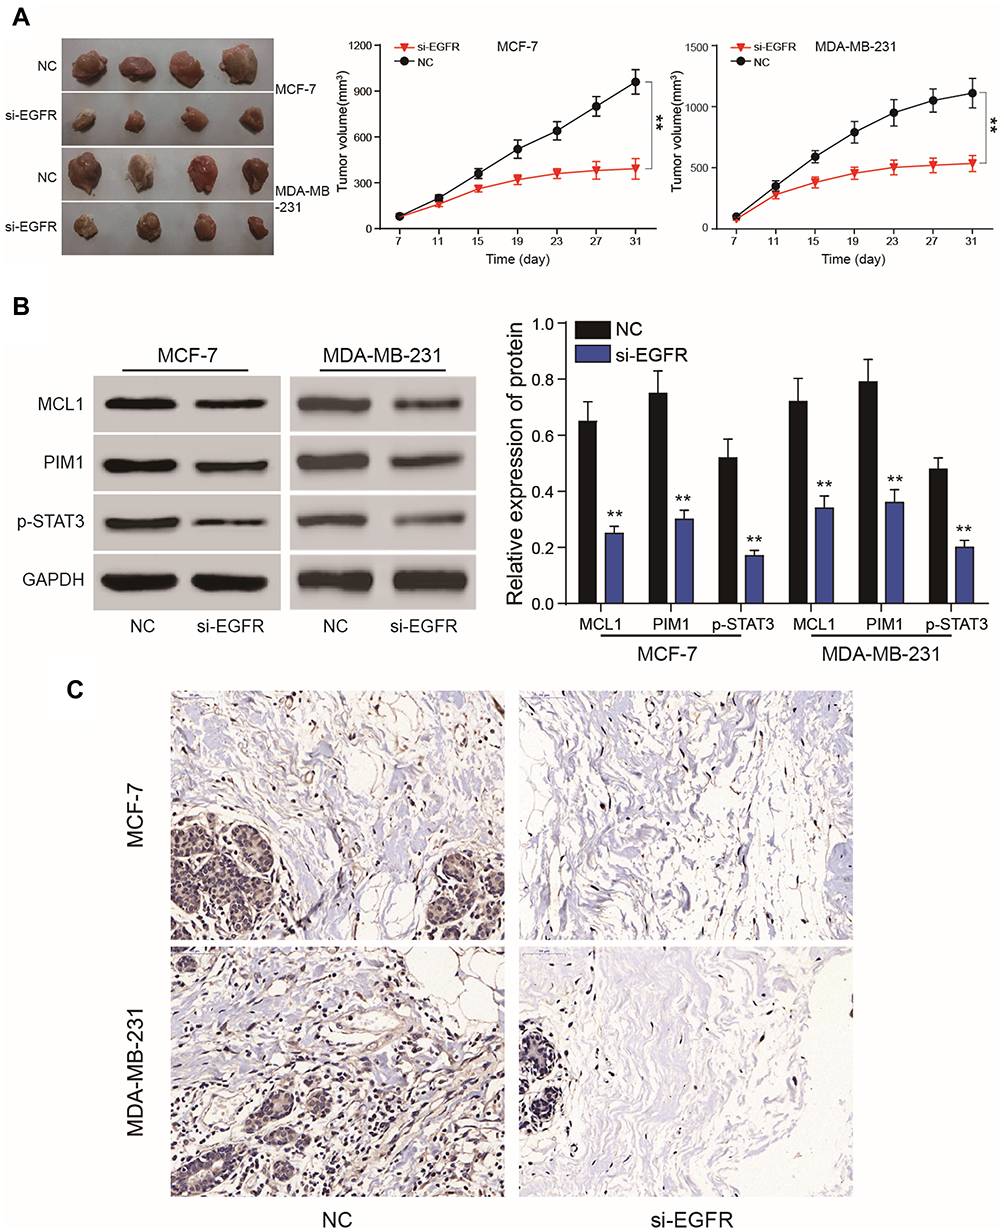 |
Figure 10 Nude mice tumor formation assays. (A) Nude mouse tumor formation assays were used to verify EGFR silencing to suppress tumor cell growth. (B, C) Western blot analysis and IHC assays showed that MCL1, PIM1 and phosphorylated STAT3 expression were dramatically reduced following EGFR silencing. **P<0.01. |
Discussion
EGFR regulates a multitude of cell signaling pathways to promote oncogenesis.17 However, studies on the role of EGFR in TNBC are poorly defined.18–20 Our results showed that the expression of EGFR, both at the mRNA and protein level, were higher in TNBC vs normal tissue. We further assessed the relationship between EGFR and STAT3, which illustrated that EGFR was a positive regulator of STAT3 and regulated cell proliferation in TNBC.
To investigate the functional role of EGFR and STAT3 in TNBC, MCF-7 and MDA-MB-231 cells were transfected under 4 different treatment conditions, including NC, EGFR, EGFR plus STAT3 inhibitor III and si-EGFR. EGFR silencing significantly induced apoptosis in MCF-7 and MDA-MB-231 cells. Dai et al identified a positive relationship between EGFR expression and the invasion ability of TNBC.21 Previous studies reported the activation of the EGFR-STAT3-Bcl-XL signaling axis in TNBC and highlighted its contribution to the aberrant proliferation and survival of malignant cells.22 KRAS-mutant lung adenocarcinoma cells can be treated through the co-suppression of STAT3 and the SRC/ARHGAP35 axis.23 Kang et al verified that salidroside inhibits the migration, invasion and angiogenesis of MDA-MB 231 TNBC cells by regulating EGFR/Jak2/STAT3 signaling via MMP2.24 Transwell assays were used to assess the degree of cell proliferation and invasion in cells treated with EGFR, si-EGFR and STAT3 plus inhibitor VIII in vitro. EGFR or STAT3 inhibition could prevent the cell invasion in vitro.
JAK/STAT3 signaling is a major contributor to cancer progression. TWIST is down-regulated by EGFR and JAK/STAT3 inhibitors, but is unaffected by phosphoinositide-3 kinase and MEK/ERK inhibition.25 A strong association exists between cancer procession and MCL1, PIM1 and JAK/STAT3. The repression of MCL1 renders leukemic cells more sensitive to synergistic cell death induced by ABT-263 in mouse models.26 Moreover, Zhang et al provided evidence that glucose deprivation leads to elevated PIM1 expression in colorectal cancer cells.27 MCL1 and PIM1 were quantified to assess ruxolitinib efficacy on TNBC through the suppression of JAK/STAT3 signaling. Ruxolitinib is an orally administered inhibitor of Janus kinases 1 and 2 used for the management of patients with myelofibrosis.28 CCK8 assays, colony formation assays and wound healing assays showed that ruxolitinib could suppress cell proliferation and tumor invasion. Nude mouse tumor formation assays verified that EGFR silencing could suppress tumor cell growth.
In summary, ChIP-seq and microarray analysis were performed to reveal differential expression patterns in TNBC. We identified that EGFR silencing inhibits TNBC cell proliferation and increases apoptosis through the suppression of STAT3. Furthermore, ruxolitinib was identified as an effective inhibitor of JAK/STAT3 signaling. This revealed the EGFR/STAT3 axis as a key target for TNBC treatment.
Disclosure
The authors report no conflicts of interest in this work.
References
1. Morris GJ, Naidu S, Topham AK, et al. Differences in breast carcinoma characteristics in newly diagnosed African-American and caucasian patients: a single-institution compilation compared with the national cancer institute’s surveillance, epidemiology, and end results database. Cancer. 2007;110(4):876–884. doi:10.1002/(ISSN)1097-0142
2. Pegram MD, Lipton A, Hayes DF, et al. Phase II study of receptor-enhanced chemosensitivity using recombinant humanized anti-p185HER2/neu monoclonal antibody plus cisplatin in patients with HER2/neu-overexpressing metastatic breast cancer refractory to chemotherapy treatment. J Clin Oncol. 1998;16(8):2659–2671. doi:10.1200/JCO.1998.16.8.2659
3. Wiggans RG, Woolley PV, Smythe T, et al. Phase-II trial of tamoxifen in advanced breat cancer. Cancer Chemother Pharmacol. 1979;3(1):45–48. doi:10.1007/BF00254419
4. Carey LA, Dees EC, Sawyer L, et al. The triple negative paradox: primary tumor chemosensitivity of breast cancer subtypes. Clin Cancer Res. 2007;13(8):2329–2334. doi:10.1158/1078-0432.CCR-06-1109
5. Haffty BG, Yang Q, Reiss M, et al. Locoregional relapse and distant metastasis in conservatively managed triple negative early-stage breast cancer. J Clin Oncol. 2006;24(36):5652–5657. doi:10.1200/JCO.2006.06.5664
6. Dent R, Trudeau M, Pritchard KI, et al. Triple-negative breast cancer: clinical features and patterns of recurrence. Clin Cancer Res. 2007;13(15 Pt 1):4429–4434. doi:10.1158/1078-0432.CCR-06-3045
7. Pines G, Kostler WJ, Yarden Y. Oncogenic mutant forms of EGFR: lessons in signal transduction and targets for cancer therapy. FEBS Lett. 2010;584(12):2699–2706. doi:10.1016/j.febslet.2010.04.019
8. Lee ST, Feng M, Wei Y, et al. Protein tyrosine phosphatase UBASH3B is overexpressed in triple-negative breast cancer and promotes invasion and metastasis. Proc Natl Acad Sci U S A. 2013;110(27):11121–11126. doi:10.1073/pnas.1300873110
9. Sun T, Aceto N, Meerbrey KL, et al. Activation of multiple proto-oncogenic tyrosine kinases in breast cancer via loss of the PTPN12 phosphatase. Cell. 2011;144(5):703–718. doi:10.1016/j.cell.2011.02.003
10. Wee P, Wang Z. Epidermal growth factor receptor cell proliferation signaling pathways. Cancers. 2017;9(5):52.
11. Ernst M, Najdovska M, Grail D, et al. STAT3 and STAT1 mediate IL-11-dependent and inflammation-associated gastric tumorigenesis in gp130 receptor mutant mice. J Clin Invest. 2008;118(5):1727–1738. doi:10.1172/JCI34944
12. Landen CN
13. Migone TS, Lin JX, Cereseto A, et al. Constitutively activated Jak-STAT pathway in T cells transformed with HTLV-I. Science. 1995;269(5220):79–81. doi:10.1126/science.7604283
14. Mantovani A, Allavena P, Sica A, Balkwill F. Cancer-related inflammation. Nature. 2008;454(7203):436–444. doi:10.1038/nature07205
15. Kujawski M, Kortylewski M, Lee H, Herrmann A, Kay H, Yu H. Stat3 mediates myeloid cell-dependent tumor angiogenesis in mice. J Clin Invest. 2008;118(10):3367–3377. doi:10.1172/JCI35213
16. Gao SP, Mark KG, Leslie K, et al. Mutations in the EGFR kinase domain mediate STAT3 activation via IL-6 production in human lung adenocarcinomas. J Clin Invest. 2007;117(12):3846–3856. doi:10.1172/JCI31871
17. Boeckx C, Baay M, Wouters A, et al. Anti-epidermal growth factor receptor therapy in head and neck squamous cell carcinoma: focus on potential molecular mechanisms of drug resistance. Oncologist. 2013;18(7):850–864. doi:10.1634/theoncologist.2013-0013
18. Goh LK, Huang F, Kim W, Gygi S, Sorkin A. Multiple mechanisms collectively regulate clathrin-mediated endocytosis of the epidermal growth factor receptor. J Cell Biol. 2010;189(5):871–883. doi:10.1083/jcb.201001008
19. Wang Q, Chen X, Wang Z. Dimerization drives EGFR endocytosis through two sets of compatible endocytic codes. J Cell Sci. 2015;128(5):935–950. doi:10.1242/jcs.160374
20. Sousa LP, Lax I, Shen H, Ferguson SM, De Camilli P, Schlessinger J. Suppression of EGFR endocytosis by dynamin depletion reveals that EGFR signaling occurs primarily at the plasma membrane. Proc Natl Acad Sci U S A. 2012;109(12):4419–4424. doi:10.1073/pnas.1200164109
21. Dai Z, Wang L, Wang X, et al. Oxymatrine induces cell cycle arrest and apoptosis and suppresses the invasion of human glioblastoma cells through the EGFR/PI3K/Akt/mTOR signaling pathway and STAT3. Oncol Rep. 2018;40(2):867–876. doi:10.3892/or.2018.6512
22. Johnson DE. Targeting proliferation and survival pathways in head and neck cancer for therapeutic benefit. Chin J Cancer. 2012;31(7):319–326. doi:10.5732/cjc.011.10404
23. Onodera K, Sakurada A, Notsuda H, et al. Growth inhibition of KRAS and EGFRmutant lung adenocarcinoma by cosuppression of STAT3 and the SRC/ARHGAP35 axis. Oncol Rep. 2018;40(3):1761–1768. doi:10.3892/or.2018.6536
24. Kang DY, Sp N, Kim DH, et al. Salidroside inhibits migration, invasion and angiogenesis of MDAMB 231 TNBC cells by regulating EGFR/Jak2/STAT3 signaling via MMP2. Int J Oncol. 2018;53(2):877–885. doi:10.3892/ijo.2018.4430
25. Lo HW, Hsu SC, Xia W, et al. Epidermal growth factor receptor cooperates with signal transducer and activator of transcription 3 to induce epithelial-mesenchymal transition in cancer cells via up-regulation of TWIST gene expression. Cancer Res. 2007;67(19):9066–9076. doi:10.1158/0008-5472.CAN-07-0575
26. Budhraja A, Turnis ME, Churchman ML, et al. Modulation of navitoclax sensitivity by dihydroartemisinin-mediated MCL-1 repression in BCR-ABL(+) B-lineage acute lymphoblastic leukemia. Clin Cancer Res. 2017;23(24):7558–7568. doi:10.1158/1078-0432.CCR-17-1231
27. Zhang M, Liu T, Sun H, et al. Pim1 supports human colorectal cancer growth during glucose deprivation by enhancing the warburg effect. Cancer Sci. 2018;109(5):1468–1479. doi:10.1111/cas.2018.109.issue-5
28. Plosker GL. Ruxolitinib: a review of its use in patients with myelofibrosis. Drugs. 2015;75(3):297–308. doi:10.1007/s40265-015-0351-8
 © 2020 The Author(s). This work is published and licensed by Dove Medical Press Limited. The
full terms of this license are available at https://www.dovepress.com/terms
and incorporate the Creative Commons Attribution
- Non Commercial (unported, 3.0) License.
By accessing the work you hereby accept the Terms. Non-commercial uses of the work are permitted
without any further permission from Dove Medical Press Limited, provided the work is properly
attributed. For permission for commercial use of this work, please see paragraphs 4.2 and 5 of our Terms.
© 2020 The Author(s). This work is published and licensed by Dove Medical Press Limited. The
full terms of this license are available at https://www.dovepress.com/terms
and incorporate the Creative Commons Attribution
- Non Commercial (unported, 3.0) License.
By accessing the work you hereby accept the Terms. Non-commercial uses of the work are permitted
without any further permission from Dove Medical Press Limited, provided the work is properly
attributed. For permission for commercial use of this work, please see paragraphs 4.2 and 5 of our Terms.