Back to Journals » Medical Devices: Evidence and Research » Volume 15
Effects of Titanium Implant Surface Topology on Bone Cell Attachment and Proliferation in vitro
Authors Levin M, Spiro RC ![]() , Jain H, Falk MM
, Jain H, Falk MM
Received 28 January 2022
Accepted for publication 7 April 2022
Published 26 April 2022 Volume 2022:15 Pages 103—119
DOI https://doi.org/10.2147/MDER.S360297
Checked for plagiarism Yes
Review by Single anonymous peer review
Peer reviewer comments 3
Editor who approved publication: Dr Scott Fraser
Michael Levin,1 Robert C Spiro,2 Himanshu Jain,3 Matthias M Falk4
1Department of Bioengineering, P.C. Rossin College of Engineering & Applied Science, Lehigh University, Bethlehem, PA, 18015, USA; 2Research and Development, Aesculap Implant Systems, LLC, Breinigsville, PA, 18031, USA; 3Department of Materials Science & Engineering, P.C. Rossin College of Engineering & Applied Science, Lehigh University, Bethlehem, PA, 18015, USA; 4Department of Biological Sciences, Lehigh University, Bethlehem, PA, 18015, USA
Correspondence: Himanshu Jain; Matthias M Falk, Email [email protected]; [email protected]
Purpose: Titanium is commonly used for implants because of its corrosion resistance and osseointegration capability. It is well known that surface topology affects the response of bone tissue towards implants. In vivo studies have shown that in weeks or months, bone tissue bonds more efficiently to titanium implants with rough surfaces compared to smooth surfaces. In addition, stimulating early endosseous integration increases the long-term stability of bone-implants and hence their clinical outcome. Here, we evaluated the response of human MG-63 osteoblast-like cells to flat and solid, compared to rough and porous surface topologies in vitro 1– 6 days post seeding. We compared the morphology, proliferation, and attachment of cells onto three smooth surfaces: tissue culture (TC) plastic or microscope cover glasses, machined polyether-ether-ketone (PEEK), and machined solid titanium, to cells on a highly porous (average Ra 22.94 μm) plasma-sprayed titanium surface (composite Ti-PEEK spine implants).
Methods: We used immuno-fluorescence (IF) and scanning electron microscopy (SEM), as well as Live/Dead and WST-1 cell proliferation assays.
Results: SEM analyses confirmed the rough topology of the titanium implant surface, compared to the smooth surface of PEEK, solid titanium, TC plastic and cover glasses. In addition, SEM analyses revealed that MG-63 cells seeded onto smooth surfaces (solid titanium, PEEK) adopted a flat, planar morphology, while cells on the rough titanium surface adopted an elongated morphology with numerous filopodial and lamellipodial extensions interacting with the substrate. Finally, IF analyses of focal adhesions (vinculin, focal adhesion kinase), as well as proliferation assays indicate that MG-63 cells adhere less and proliferate at a slower rate on the rough than on a smooth titanium surface.
Conclusion: These observations suggest that bone-forming osteoblasts adhere less strongly and proliferate slower on rough compared to smooth titanium surfaces, likely promoting cell differentiation, which is in agreement with other porous implant materials.
Keywords: cell adhesion and proliferation, implant surface topology, MG-63 cells, polyether-ether-ketone, PEEK, porous titanium implants, Ti-PEEK
Introduction
Understanding bone structure, different types of bone cells, and how cells respond to environmental stimuli are important to producing better regenerative bone implants and to obtain the highest, optimal implant integration. When osteoblasts encounter a bone or a favorable material, they secrete and surround themselves with bone matrix turning into osteocytes. These osteocytes control regeneration, maturation, and resorption, which is critical for fracture healing and osseointegration.1 Spine implants are used to stabilize the fractured region of the backbone that is caused by trauma or slipped vertebrae, eg, spondylolisthesis.2 Ideally, bone tissue integrates into and strongly bonds to the implant to stabilize the injured region.
Much research has focused on osseointegration under load-bearing conditions as they impact implant’s lifetime expectancy the most.3,4 This requires the implant material to be bioinductive and have matching elastic moduli. A promising approach to accomplish this combination of properties for osseointegration is to make the implant core out of a polymer and coat it with a suitable metal. Polyether-ether-ketone (PEEK) is often used as a core, as it exhibits similar mechanical properties to bone, can be machined well, and has favorable imaging characteristics.5 Among metals, stainless steel, chromium, cobalt, and iron were used first, but eventually titanium became the metal of choice.6,7 In 1952, Brånemark discovered that implanted titanium chambers strongly fused with rabbit femurs, an observation that then led to the term “osseointegration”.6,8 From that point on, in general, titanium has been used as implant material for knee and hip replacements, dental sockets, as well as spine implants.7 Titanium has good biocompatible properties including minimal-to-no foreign body responses due to its resistance to corrosion by body fluids.7 It can osseointegrate with bone and has a high fatigue life.9,10 Butterman states that 10 years after an Anterior Cervical Discectomy Fusion (ACDF) surgery using autografts and rigid plate implants, 85–95% of patients stated that the treatment was successful, and that in addition, narcotic usage to leverage pain decreased.11 Butterman also states that for ACDF surgery, caged titanium implant’s lifetime expectancy was established to be at least 10 years if bone grafts were included.11 However, there is still significant room for improvement of titanium-based bone implants.
It is now clear that surface characteristics of titanium implants, including roughness and porosity, similar to the surface characteristics of other biomaterials, influence implant characteristics such as wettability, hydroxyapatite (HA) deposition, and protein adsorption, and thus regulate implant/tissue integration.6,12–24 Clinical and in vivo studies, for example, have shown that flat, polished, titanium implants are bio-inert and that they take a long time for bones to attach.7,25 However, when manufacturing the titanium implant’s surface rough, an increase in bone cell and tissue interactions was observed, thus a stronger bone-implant interface resulted.14,16,19,20,26 The fabrication procedure of such rough titanium bone-implants employs either titanium plasma-spray (TPS) or sandblasting/acid-etching (SLA) processes. TPS (characterized here) typically creates a highly porous surface with larger “roughness” (~micrometer scale) than those prepared by the SLA process (~nanometer scale).27
The rough titanium surface examined here is derived from titanium plasma-sprayed PEEK (composite Ti-PEEK) implants.13 They are hollow cylindrical spinal fusion cage implants (Figure 1A) that are inserted between two vertebrae. In addition to implant insertion, bone grafts (small bone pieces) are inserted in between the two vertebrae. The goal is to accomplish complete osseointegration by permanently fusing all bone pieces (bone grafts inside the cage and the two flanking vertebrae) with the implant, and thus having patients’ life and function normally without deliberating back pain.28 ArcadiusXP L Ti-PEEK implants investigated here consist of a PEEK polymer core that is coated with a plasma-sprayed titanium layer (Figure 1A), combining the favorable mechanical and imaging properties of PEEK with the strong tissue bonding properties of rough, porous titanium.13,17,23 To better understand how cells react and respond to surface topologies, we have investigated adhesion, proliferation, and morphology of human MG-63 osteoblast-like cells adhering and proliferating on the rough titanium implant surface and compared it to cells on smooth surfaces, specifically, machined solid titanium, machined inert PEEK derived from the implant core, tissue culture (TC) plastic, or poly-L-lysine-coated microscopic cover glasses using scanning electron and immunofluorescence light microscopic analyses, as well as enzymatic and more direct live-cell staining and cell counting-based assays.
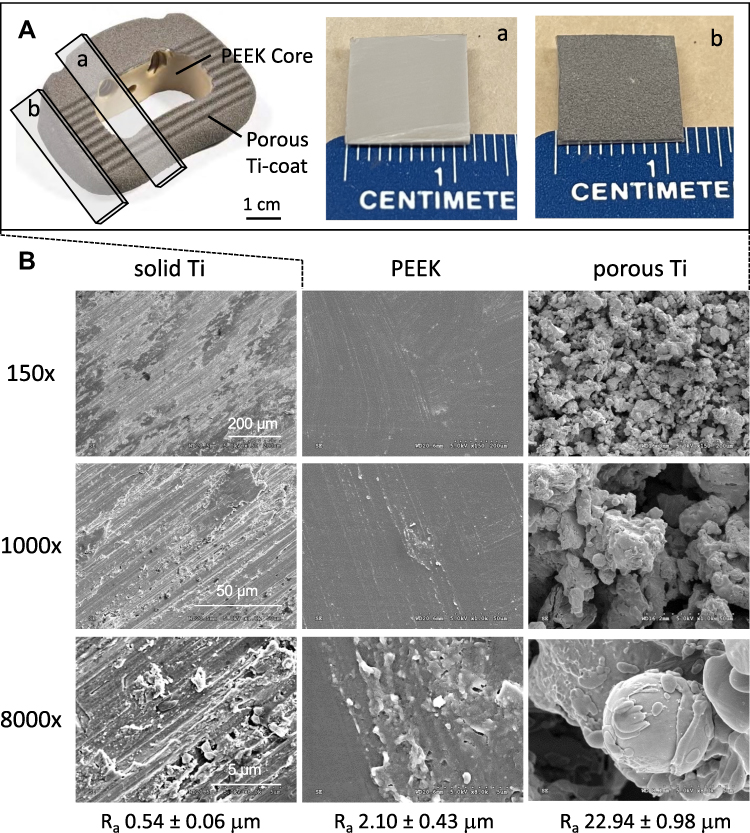 |
Figure 1 Substrate surface microstructure. (A) Aesculap Implant Systems, LLC ArcadiusXP L vacuum titanium plasma-spray coated (PlasmaporeXP) PEEK spine implant. Planar, approximately 1–2 mm thick disks were cut from the core (PEEK only (a)) and the surface (the Ti-coating on a thin layer of PEEK) (b)) of the implants. Disks were cut into smaller pieces before being used in our experiments. (B) Representative scanning electron microscope images acquired at indicated magnifications of disks cut from solid titanium, PEEK core, and plasma sprayed titanium coat that were used as substrates in this study. Images demonstrate the relatively smooth surfaces of solid titanium (av. Ra 0.54 μm) and PEEK (av. Ra 2.10 μm), compared to that of plasma sprayed titanium (av. Ra 22.94 μm). Scale bars are given in cm in (A) and μm in (B). |
Materials and Methods
Sample Description
Four types of materials were investigated in this study: Solid titanium (Fisher Scientific, Catalog # AA4239406 for 3.175 mm diameter rods used for WST-1 assays in 96-well plates, and Catalog # AA13999BP for 12.7 mm diameter rods used for Live/Dead and immunofluorescence analyses; both are of identical composition with ≥99.99% purity), highly porous plasma sprayed titanium (ultra-pure, the coating of ArcadiusXP L spine implants), surgical grade PEEK (polyether-ether-ketone, an organic polymer), the core of the ArcadiusXP L spine implants (PEEK-Optima™; Invibio, Lancashire, UK), and as a control, TC plastic and poly-L-lysine-coated microscope cover glasses. Aesculap Implant Systems, LLC. provided the vacuum plasma-sprayed titanium-coated PEEK implants (ArcadiusXP L).
Cutting and Sterilizing Samples
Planar, approximately 1–2 mm thick, 3–5 mm in diameter disks were cut from the surface (including the Ti-coating) and the core (PEEK only) of the implants using a Struers, abrasive aluminum oxide (Al2O3), high-quality cut-off wheel on a Struers Accutom-50 high-speed circular saw. Water was used as a coolant/lubricant during cutting. Similarly, solid titanium disks were cut from the rods. Samples were cleaned and sterilized by heating to 121°C at 115 kPa pressure in an autoclave, running a “Dry” cycle for one hour (30 minutes “sterilize” and 30 minutes “dry”) and were kept in sterilized containers until used in experiments. Attachment and proliferation of cells growing on the samples were compared to cells growing in tissue culture (TC) plastic dishes and on poly-L-lysine-coated microscopic cover glasses.
Surface Roughness Analyses
An Alpha-Step D-500 Stylus Profiler (KLA Instruments, Milpitas, CA) was used to measure the surface roughness (Ra) of solid titanium and PEEK discs after they were cut. The plasma-sprayed titanium surface was too rough to be measured with this instrument as the instrument stylus could not penetrate the pores completely. However, this surface was characterized previously.13 Microscopic cover glasses and TC plastic surfaces were optically smooth.
Scanning Electron Microscopy (SEM) Analyses
To characterize the surface topology of the three sample types, disks were mounted on a sample holder with a carbon tape, then sputter-coated (EM/SEM Specimen Coating – Model EMS575X) with iridium for 30 seconds to prevent charging. Afterwards, samples were investigated using a Hitachi 4300 Field Emission (FE) SEM, operated in secondary electron mode using a 5.0 kV acceleration voltage and imaged under identical conditions. Images of samples at 150x, 1000x, and 8000x magnifications are shown.
To investigate the ultrastructural morphology, cells were seeded (10,000 cells/cm2) on top of each sample and incubated at 37°C for four days. After incubation, cell media were aspirated off and replaced with 1xPBS. Next, cells were fixed in 4% glutaraldehyde (Sigma, St. Louis, MI, cat. # G5882) at 4°C overnight followed by dehydration in a series of ethanol dilutions (twice 35%, 60% - 10 min each; 80%, 90%, 100% ethanol – 15 min each). Lastly, samples were incubated for 10 min in hexamethyldisilazane (HMDS; Sigma, St. Louis, MI, cat. # 52619) for complete removal of residual moisture.29 Dehydrated samples were stored in a desiccator until analysis. Just before examination by SEM, samples were prepared as described above and examined. Images of cells at 150x, 1000x, and 8000x magnifications are shown. To determine cell sizes on the different substrates, 10 cells/substrate were outlined in ImageJ software, and cell area was determined in μm2 using the ImageJ measuring tool.
Cell Culture
The human MG-63 osteoblast-like osteosarcoma cell line (ATCC CRL-1427; American Type Culture Collection, Manassas, VA, USA) was used to allow comparison with an earlier study.13 Cells were cultured in Eagle’s Minimal Essential Medium (EMEM) (ATCC, Manassas, VA, USA, Cat. # 30-2003) supplemented with FBS (10% final conc.) (R&D Systems, Minneapolis, MN, USA, Cat. # S11150), L-Glutamine (2 mM final conc.) (Gibco, Fisher Scientific, Nazareth, PA, USA, Cat. # 25030081), Penicillin (50 units final conc.) and Streptomycin (50 μm final conc.) (Gibco, Fisher Scientific, Nazareth, PA, USA, Cat. # 15070063) in a cell culture incubator at 37°C, 100% humidity and 5% CO2 atmosphere. Media were exchanged every 48 hours. Cells were cultured until reaching confluency (~5–7 days) and passaged at a ratio of 1:10 using trypsin-EDTA (0.25%, Gibco, Fisher Scientific, Nazareth, PA, USA, Cat. # 25200056). For experiments, confluent dishes were trypsinized, cells counted using a hemocytometer, and seeded into 35 and 60 mm-diameter tissue culture dishes and 6 and 96-well plates at 1000 and 10,000 cells/cm.2
Live/DeadTM Staining and Imaging
To observe cells directly when proliferating on the samples, they were seeded into the wells of 6-well plates (each well containing one sample type), and into 35-mm diameter TCP plastic dishes (supplemented or not with poly-L-lysine coated glass coverslips) as control. On days 1, 2, 4, 5, and 6, medium was removed, and each dish was stained for 15–20 minutes with a LIVE/DEAD™ Viability/Cytotoxicity Kit for mammalian cells (Invitrogen, Fisher Scientific, Nazareth, PA, USA, Cat. # L3224) at room temperature (RT) according to manufacturer’s instructions. For every 10 mL of 1xPBS used, 5 µL of calcein-AM (green fluorescence) and 20 µL of ethidium homodimer-1 (red fluorescence) were used. Samples were placed upside down into glass-bottom dishes (Mattek, Ashland, MA Cat #P35G-1.5–14-C) in 1xPBS and imaged using a Nikon Eclipse TE2000-U inverted fluorescence microscope equipped with a 20x air objective and a SPOT Advanced CCD camera with version 5.1 software. At least 3 images of representative regions of the samples were acquired. Once all cells on the images of all samples and at all time points were counted and graphed, average, and standard deviations for each sample were calculated using Microsoft Excel software. Average cell-duplication times (hours/generation) were calculated from the graphs to determine cell proliferation rates on the different substrates.30
Immunofluorescence (IF) Staining and Imaging
To investigate the rate and strength of cell attachment on the samples, cells were washed with 1xPBS and fixed using 3.7% formaldehyde for 15 minutes at RT followed by permeabilization with 0.2% Triton X-100 (15 minutes at RT) and blocking in 5% BSA/PBS solution at RT for 1 hour, or overnight. Samples were incubated with anti-vinculin (mouse monoclonal, Sigma, Cat. # V9131) and anti-tyrosin397-phospho-focal adhesion kinase (FAK) (rabbit polyclonal, Fisher Scientific, Cat. # 700255) specific primary antibodies diluted 1:300 and 1:500, respectively, in blocking solution at room temperature for 1 hour by placing samples upside-down on a drop (50 µL) of antibody solution. After washing in 1xPBS cells were incubated in blocking solution containing Alexa488 or Alexa568-conjugated goat-anti-mouse (Molecular Probes/Invitrogen, Grand Island, NY, Cat. # A32723TR and A11031) and goat-anti rabbit (Molecular Probes/Invitrogen, Grand Island, NY, Cat. # A32731TR and A11036) secondary antibodies (diluted 1:300 or 1:500), Alexa488 (or Alexa568)-conjugated phalloidin (Molecular Probes/Invitrogen, Grand Island, NY, Cat. # A12379 and A12380) (diluted 1:100), and DAPI (1 μg/mL, Molecular Probes/Invitrogen, Grand Island, NY, Cat. # 62248) at room temperature for 1 hour. Samples were mounted facing up-side down on a drop (50 µL) of Fluoromount-GTM Mounting Medium (SouthernBiotechTM, Birmingham, AL, Cat. # 0100-01) placed into a 35 mm diameter glass bottom dish (Mattek). Cells on reference cover glasses were mounted onto microscopic glass slides and sealed with nail polish. Samples and slides (latter placed upside-down on the microscope stage) were imaged using a Nikon Eclipse TE2000-U inverted fluorescence microscope equipped with a 60x NA1.4 oil-immersion objective, and a SPOT Advanced CCD camera. To quantify the number of focal adhesions per cell on the different substrates, phalloidin and anti-vinculin-stained cells were marked using the multi-point tool in ImageJ and focal adhesions counted in 28 cells/substrate. Similarly, to quantify the number of active focal adhesions/cell on the different substrates, phalloidin/anti-FAK, and anti-vinculin/anti-FAK-stained cells were marked and active focal adhesions counted in 18 cells/substrate.
Water-Soluble Tetrazolium 1 (WST-1) Enzyme Assay
To determine the number of cells proliferating on the substrates by their enzymatic activity, cells were seeded at 10,000 cells/cm2 into the wells of 96-well plates each supplemented with one sample type. MG-63 cells grown without a sample served as control to generate a standard absorption curve. At days 1, 4, 5, and 6 cell numbers were determined using an enzymatic, Cell Proliferation Reagent WST-1 assay kit (Sigma Aldrich, Milwaukee, WI, USA, Cat. # 11644807001) according to manufacturer’s instructions. Samples were incubated at 37°C for 3–4 hours for accurate absorbance readings. WST-1 assay absorbance at OD 450 nm was read and corrected by subtracting the reading of the reference wavelength (OD 600 nm) as described by the manufacturer using a Tecan Infinite M200 Pro Plate reader (Tecan Instruments, Männedorf, Switzerland). Three independent experiments were performed, and averages and standard deviations calculated. In addition, average cell-duplication times (hours/generation) were calculated from the graphs and compared to cell-duplication times calculated by counting Live/Dead stained cells.30
Statistical Analyses
For the quantification of MG-63 cell counts in Live/Dead stained and WST-1 enzyme assays, two-way ANOVA analyses were performed in Microsoft Excel to determine whether overall cell proliferation on the different substrates was statistically significant from each other. One-tail Student’s t-tests were also performed in Microsoft Excel to individually compare cell numbers on the substrates to each other on each day. For the quantification of total focal adhesions/cell (anti-vinculin-stained) and active focal adhesions/cell (anti-FAK-stained), one-tail Student’s t-tests were performed in Microsoft Excel to individually compare numbers of focal adhesions, and active focal adhesions per cell on the different substrates to each other. For the quantification of average MG-63 cell-size on each substrate, one-tail Student’s t-tests were performed in Microsoft Excel to individually compare cell sizes on the individual substrates to each other. All data are presented as mean ± s.e.m. p-values of p<0.05 (*), p<0.01 (**), and p <0.001 (***) were considered statistically significant.
Results
Microstructure and Composition of Substrates
To compare bone cell response to smooth and rough titanium as well as other smooth surfaces, we investigated attachment and proliferation of human MG-63 osteoblast-like cells grown for 1 to 6 days on disks cut parallel to the plasma-sprayed titanium surface of composite Ti-PEEK spine implants, disks cut from the implant’s PEEK-polymer core, and disks cut from solid titanium rods (Figure 1A). Cells grown on optically smooth tissue culture (TC) plastic or microscope glass coverslips were analyzed as controls. First, we performed scanning electron microscopic (SEM) analyses of all three samples to analyze and compare their surface characteristics.
The representative SEM images shown in Figure 1B demonstrate that the surface of cut solid titanium as well as PEEK, although unpolished are much smoother than the plasma sprayed titanium coating (solid Ti: Ra 0.54 ± 0.06 µm; PEEK: Ra 2.10 ± 0.43 µm). Images of the titanium coating acquired at different magnifications clearly show a rough surface topology composed of solidified molten Ti-droplets creating deep pockets, irregular peaks, and angled surfaces. In a previous publication, the Ti-PEEK implant surface was characterized as having 35–60% porosity and 60–150 μm thickness range (average Rz value 136.5 ± 6.3 μm) with an average Ra value of 22.94 ± 0.98 μm.13 The SEM surface image shown here, together with an SEM cross-section image, as well as an AFM surface image presented in Cheng et al illustrate the rough, porous topology consisting of deep pockets intermixed with titanium peaks created by the plasma-spray technique.13 Together, our findings confirm and complement findings by Cheng et al and convincingly demonstrate the rough surface topology of the plasma-sprayed titanium surface compared to all other surfaces tested here.13
Proliferation Rate of MG-63 Cells on Different Substrates
To investigate bone cell proliferation and overall morphology directly, Live/Dead-stained cells were counted and morphologically evaluated for 6 days post seeding. In addition, cell proliferation was evaluated indirectly based on enzymatic activity using WST-1 assays. Figure 2A shows representative fluorescence light microscopic images of Live/Dead stained MG-63 cells acquired at the indicated time points. Figure 2B describes the corresponding growth data of three independent experiments, and Figure 2C the growth data of three independent enzymatic WST-1 assays. Tables 1–3 summarize average cell numbers/mm2 and cell-duplication time in hours (average generation times) that were calculated from the corresponding growth curves.
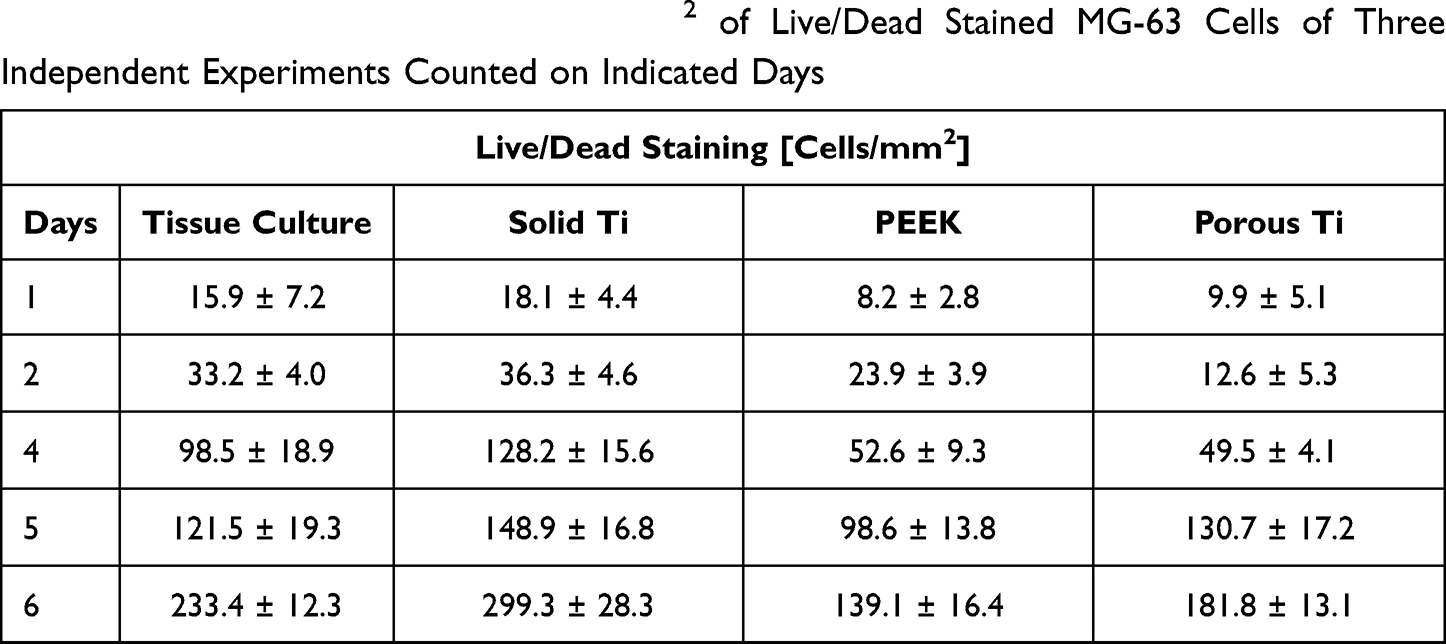 |
Table 1 Average Cell Numbers per mm2 of Live/Dead Stained MG-63 Cells of Three Independent Experiments Counted on Indicated Days |
 |
Table 2 Average Numbers of MG-63 Cells per mm2 Calculated from Their Enzymatic Activity (WST-1 Assay) on Indicated Days |
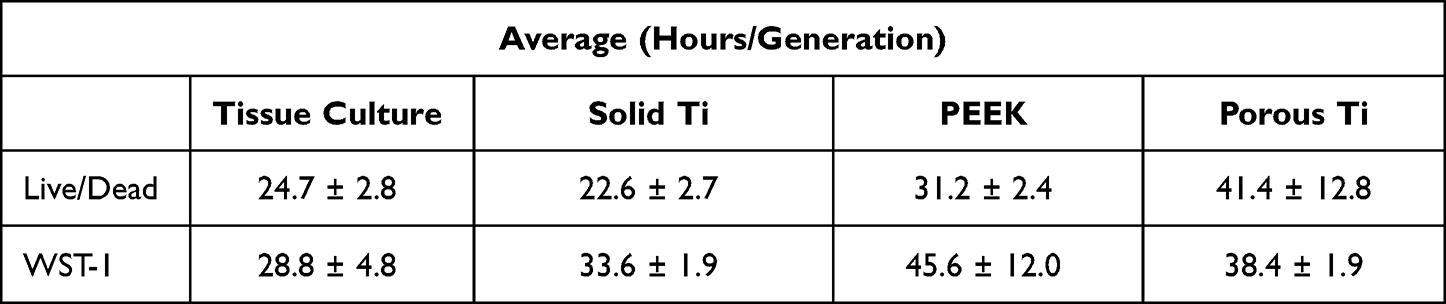 |
Table 3 Average Times in Hours Required for Cells to Double in Number Calculated from the Growth Curve Generated of Live/Dead Stained Cells, and from Enzymatic (WST-1 Assay) Activity |
 |
Figure 2 Proliferation rate of MG-63 cells on different substrates. MG-63 cells were seeded at equal density (1000 cells/cm2) on the surface of thin discs as shown in Figure 1A consisting of solid titanium, porous titanium, machined PEEK, and into tissue culture (TC) plastic dishes. Cell proliferation was determined by staining cells with a fluorescent Live/Dead staining kit (live cells fluoresce green, dead cells red) and counting cells at indicated times (A and B), and by determining their enzymatic activity using a WST-1 assay kit (C). Representative images of stained cells in (A), and proliferation data of 3 independent experiments in (B and C). Data are mean ± s.e.m.; ns, not significant; *p<0.05, **p<0.01, ***p<0.001. A scale bar representative for all images is given in μm. |
Only live cells take up calcein-AM and fluoresce green, while dead cells take up ethidium homodimer-1 and fluoresce red. The data show that cells attach to and proliferate on all four surfaces, however with significantly different rates. Cells proliferate almost twice as fast on TC plastic and flat and solid titanium compared to cell proliferation on PEEK and porous titanium (Figure 2A and B and Tables 1 and 3). Similar results were obtained when cell proliferation was evaluated using colorimetric enzyme activity (Figure 2C and Tables 2 and 3). In addition, 15.9 ± 7.2 and 18.1 ± 4.4 calcein-AM stained cells were detected per mm2 on TC plastic and solid titanium 24 hours post seeding (day 1), respectively, compared to only 8.2 ± 2.8 and 9.9 ± 5.1 cells/mm2 on PEEK and rough titanium, suggesting that more of the seeded cells adhered to TC plastic and solid titanium compared to PEEK and rough titanium, however a trend that was not reproduced by enzymatic WST-1-based cell proliferation assays (Tables 1 and 2). In addition, no cells that took up the ethidium homodimer-1 (red, dead) were visible on the smooth surfaces, while a few dead cells were visible on the porous titanium surface. It is possible that dead cells were dislodged from the smooth surfaces during staining and washing procedures, while some dead cells remained lodged in the highly porous plasma sprayed titanium surface (Figure 2A). Note that PEEK visibly auto-fluoresces, especially in the red channel, a common feature of PEEK in fluorescence microscopic applications, and overpowers immunofluorescence cell stains (Figures 3–5).31–33 However, its autofluorescence is not strong enough to overwhelm the calcein-AM and ethidium homodimer-1 staining (Figure 2A).
 |
Figure 3 Adhesion of MG-63 cells to different substrates, focal adhesions and actin cytoskeleton. MG-63 cells were seeded on solid and porous titanium discs, PEEK discs, and on poly-L-lysine-coated microscopic glass coverslips, and incubated for 4 days, then processed for indirect immunofluorescence analysis. (A) Focal adhesions were visualized using an anti-vinculin (a focal adhesion protein component) specific antibody (green), the actin cytoskeleton was decorated with Alexa568-conjugated phalloidin (red), and cell nuclei were stained with DAPI (blue). Merged images, and magnified images zoomed in on selected areas (boxed) are shown below. Numerous typical focal adhesions (green puncta, depicted by arrows) and actin stress fibers (reddish and greenish filaments) were clearly detectable on solid titanium and coverslips, but not on porous titanium. (B) Total number of focal adhesions per cell were determined by counting vinculin-positive adhesions (bright green comma on the tips of actin filaments) in 27 cells on each substrate. Data are mean ± s.e.m.; **p<0.01, ***p<0.001. Scale bars representative for all images and zoomed in areas are given in μm. |
 |
Figure 4 Adhesion of MG-63 cells to different substrates, active focal adhesions and actin cytoskeleton. MG-63 cells were seeded on solid and porous titanium disks, and on poly-L-lysine-coated microscopic glass coverslips, and incubated for 4 days, then processed for indirect immunofluorescence analysis. Actively signaling focal adhesions were visualized using a phospho-specific (pTyr397) anti-focal adhesion kinase (FAK) antibody (red), and the actin cytoskeleton was decorated with Alexa488-conjugated phalloidin (green). Merged images, and images zoomed in on selected areas (boxed) are shown below. Numerous active focal adhesions (red puncta, depicted by arrows) and actin stress fibers (green filaments) were clearly detectable on solid titanium and coverslips, but not on porous titanium consistent with data presented in Figure 3. Scale bars representative for all images and zoomed in areas are given in μm. |
 |
Figure 5 Adhesion of MG-63 cells to different substrates, vinculin and phospho-FAK co-localization. MG-63 cells were seeded on solid and porous titanium disks, and on poly-L-lysine-coated microscopic glass coverslips, and incubated for 4 days, then processed for indirect immunofluorescence analysis. (A) Focal adhesions were visualized using anti-vinculin specific antibodies (red), active focal adhesions were visualized using phospho-specific (pTyr397) anti-FAK antibodies (red), and cell nuclei were stained with DAPI (blue). Merged images, and images zoomed in on selected areas (boxed) are shown below. Numerous typical focal adhesions (yellow/orange puncta, depicted by arrows) double-labeled with both antibodies were clearly detectable on solid titanium and coverslips. Some may also be present in cells on porous titanium. (B) Total number of active focal adhesions per cell were determined by counting phospho-FAK positive adhesions (yellow/orange comma) in 18 cells on each substrate. Data are mean ± s.e.m.; *p<0.05, ***p<0.001. Scale bars representative for all images and zoomed in areas are given in μm. |
Cells growing on smooth TC plastic, solid titanium and PEEK surfaces mostly exhibit an elongated, epithelioid morphology, while cells on the rough plasma sprayed titanium surface mostly appear rounded and irregularly shaped and are significantly smaller in diameter (compare Figure 6). Taken together, cells interacting with any of the smooth surfaces (TC plastic and poly-L-lysine treated microscopic cover glasses, solid titanium, or PEEK) share similar morphological characteristics, while cells on the rough titanium surface have a distinctly different morphology. In contrast, cell proliferation characteristics do not exhibit a comparable trend correlating with PEEK polymer’s inert biological properties.
 |
Figure 6 Ultrastructural morphology of MG-63 cells attached to different substrates. MG-63 cells were seeded on solid and porous titanium and on PEEK disks and incubated for 4 days, then processed for scanning electron microscopic analyses. (A) Representative images at indicated magnifications are shown. Cells at 1000x magnification were in addition pseudo-colored transparent blue to better visualize cells and the areas covered by cells. Note pronounced difference in numbers and ultrastructural morphology of cells attached to the smooth and rough titanium, and the PEEK surface. (B) The average size of cells was determined by outlining 10 cells per substrate and measuring their area in mm2. Data are mean ± s.e.m.; ns = not significant, *p<0.05. Scale bars are given in μm. |
Adhesion of MG-63 Cells to Different Substrates
To further investigate adhesion of MG-63 cells to the different substrates, we visualized vinculin (a protein component of cellular focal cell adhesions that links their trans-membrane integrin receptors with the actin cytoskeleton), and phosphorylated focal adhesion kinase (FAK) (the kinase component of focal adhesions) by indirect immunofluorescence techniques using anti-vinculin and anti-phospho-FAK-specific antibodies. In addition, the actin cell cytoskeleton was labeled by decorating actin filaments (F-actin) with fluorescence-labeled phalloidin, and the cell nucleus by staining with DAPI. Focal adhesions are dynamic macromolecular assemblies in which cells assemble to signal via integrin receptors between the extracellular matrix and the cell nucleus and thus can serve as representative structures to characterize the significance and strength of cell to substrate attachment.34,35 Thus, the presence of robust focal adhesions (indicated by robust vinculin staining) indicates a strong adhesion of the cell to its substrate. In addition, in actively signaling focal adhesions, FAK is phosphorylated on tyrosine 397. Thus, phosphorylated FAK is routinely used as a representative marker for the characterization of functional, actively signaling focal adhesions.36 In Figure 3A, representative fluorescence light microscopic images of MG-63 cells are shown in which focal adhesions (vinculin) and the connecting actin cytoskeleton (phalloidin) were stained and visualized. In Figure 4, representative micrographs of MG-63 cells are shown in which active focal adhesions (phospho-FAK) and the connecting actin cytoskeleton (phalloidin) were visualized; and in Figure 5A, representative micrographs of MG-63 cells are shown in which vinculin and active, phosphorylated FAK were stained. Figures 3B and 5B show quantitative analyses of total and active focal adhesions of cells assembled on the different substrates.
MG-63 cells growing for four days on microscopic glass coverslips and solid, flat titanium disks showed canonical, robust focal adhesions (reddish/yellowish coma) located at the tips of F-actin stress fibers (visible especially in the merged higher magnified inserts and labeled with arrows), and a well-assembled dense actin-based cytoskeletal network (green filaments; especially well visible on glass coverslips) as is typical for cells adhering to hard substrates (Figure 3A).37 Cell nuclei (blue) are visible as well. In contrast, none, or only a very limited number of focal adhesions and actin stress fibers were detectable in the cells growing on the rough, plasma-sprayed titanium surfaces, as is typical for cells growing on soft substrates.38 In these cells, both vinculin and actin appear more or less homogenously distributed in the cell cytosol. Cell nuclei are clearly visible located within the cell bodies (Figure 3A). While MG-63 cell nuclei are visible on the PEEK sample surfaces, focal adhesions (vinculin) and actin filaments (phalloidin) remain obscure and cannot be detected in our experiments due to PEEK’s strong autofluorescence properties at these wavelengths.
In addition, cells on coverslips as well as on solid titanium samples spread out flat and exhibit typical epithelioid morphology including large lamellipodial and filopodial extensions (eg, on coverslips), while cells on the rough titanium surface exhibit a more rounded, much less spread-out morphology, and appear much smaller. However, filopodial and lamellipodial extensions are visible in all representative images of cells on rough titanium as well (Figures 3–5).
Similar results were obtained when the cells were stained for their actin cytoskeleton and phosphorylated FAK (Figure 4), or focal adhesions were double stained for vinculin and phosphorylated FAK (Figure 5A, indicated by the two co-localizing red and green stains resulting in a yellow appearance). Cells growing on PEEK are not shown in Figures 4, and 5 due to their intense autofluorescence at these wavelengths. Note that in all cells, not all vinculin, phosphorylated FAK, and F-actin molecules are located in focal adhesions and stress fibers, and partially localized to the cell body as the cytosol serves as the default location for vinculin, FAK, and actin proteins not assembled in focal adhesions and stress fibers (indicated by a diffuse green or red cytosolic stain in all micrographs).
Taken together, cells growing on smooth surfaces (solid titanium and especially coverslips) assemble significantly more total and active focal adhesions, and well-organized actin-based stress fibers, compared to cells growing on the rough titanium surface (Figures 3B and 5B). These observations are in agreement with MG-63 and MC3T3-E1 osteoblastic cells growing on smooth and highly porous bioactive glass surfaces we have analyzed previously (see Discussion).
Ultrastructural Morphology of MG-63 Cells Attached to Different Substrates
To investigate the morphology of cells attaching to the different surfaces on an ultrastructural level, we examined PEEK, solid, and rough titanium samples onto which MG-63 cells were seeded at equal densities (10,000 cells/cm2) 4 days prior to processing for scanning electron microscopy (SEM). SEM images of MG-63 cells growing on TC plastic and microscopic cover glasses have been published previously.39–41 Their morphology closely resembles that of cells growing on the flat, solid titanium examined here (see below). Figure 6A shows representative SEM images taken at indicated magnifications. Note that cells in the 1000x magnification image were in addition pseudo-colored transparent blue for better visualization of the covered area as it can be challenging to make out the cells in these monochrome SEM images.
SEM analyses clearly showed that not only did cells attach to all samples but also cell number, size, and overall morphology were quite different. Correlating with Live/Dead and WST-1-based proliferation assays described above, cells were almost confluent on solid titanium covering almost the entire sample surface, while on the rough titanium surface and especially on the PEEK surface much fewer cells were present. In addition, their morphology and size differed significantly from the morphology and size of cells attached to solid titanium (Figure 6B). Cells on solid titanium were spread out flat, covered significantly larger areas, exhibited triangular and epithelioid morphology, and exhibited extended robust extensions of their cell body, correlating with their morphology observed by fluorescence microscopy (Figures 3–5). In contrast, cells on PEEK, and even more prominently on rough titanium, overall were significantly smaller (Figure 6B) and exhibited a more spindle-like morphology with a large number of elaborate wider and thinner cell extensions. In addition, cells were often observed to be located with their cell body suspended in the titanium-free voids, only attaching to the substrate via cell-body extensions. Note that the size of the cells on the rough titanium surface is often smaller than the size of the voids in the porous titanium contours, especially visible in the 1000x magnified image.
Discussion
It is well known that the surface topology of titanium implants plays an important role in bone integration and that a rough titanium surface manufactured by sandblasting/acid-etching (SLA) or, in particular by plasma spraying (TPS) leads to stronger tissue bonding.13,14,16,17,19,23,42,43 However, our knowledge on how exactly the surface roughness of a biomaterial influences cell behavior is still limited. To better understand how cells react and respond to different surface topologies, we investigated the adhesion, proliferation, and morphology of human MG-63 osteoblast-like cells to smooth surfaces (solid titanium Ra = 0.54 ± 0.06 μm; smooth PEEK, Ra = 2.10 ± 0.43 μm; TC plastic and microscopic glass coverslips, optically smooth), compared to a very rough and porous plasma-sprayed titanium surface (Ra = 22.94 ± 0.98 μm, Rz = 136.59 ± 6.3 μm). We (i) confirmed smooth and rough surface topology of our samples by SEM analyses (Figure 1); (ii) investigated cell proliferation directly by loading cells with calcein-AM (green, live) and ethidium homodimer-1 (red, dead) (Live/Dead staining) followed by counting cells 1 to 6 days post seeding, and indirectly by measuring cell’s enzymatic activity (WST-1 assays) (Figure 2); (iii) characterized cell attachment by staining cells with antibodies specific for focal adhesion marker proteins (vinculin, focal adhesion kinase (FAK)) and decorating the actin cytoskeleton with fluorescent phalloidin (Figures 3–5); and (iv) determined cell size and morphology on an ultrastructural level (Figure 6).
We found that cells interacting with any of the smooth surfaces (TC plastic, coverslips, solid titanium, or PEEK) shared similar morphological characteristics, while cells on the rough titanium surface exhibited a different morphology. In contrast, cell proliferation characteristics did not correlate with cell morphology. Cells on smooth titanium and TC plastic proliferated rapidly (24.7 ± 2.8 and 22.6 ± 2.7-hour generation time), while cells on PEEK and rough titanium proliferated much more slowly (31.2 ± 2.4 and 41.4 ± 12.8-hour generation time), correlating with PEEK polymer’s inert, less favorable biological properties,5 and with other rough surfaces including porous bioactive glasses that we characterized previously.44–49 Our findings also correlate with an earlier study performed on the plasma sprayed Ti-PEEK composite implants investigated here.13
Staining with calcein-AM and counting cells on indicated days, as well as calculating cell numbers by enzymatic activity (WST-1 assays) gave comparable results, both indicating a significantly slower proliferation rate on rough compared to smooth titanium. It is well known that cell proliferation inversely correlates with cell differentiation, suggesting that a slower proliferation rate on the rough titanium surface will likely promote cell differentiation.50,51 Indeed, this has been seen previously on the Ti-PEEK implants investigated here as indicated by the upregulation of cell differentiation markers such as alkaline phosphatase (ALP), and bone morphogenic proteins (BMPs) as well as on other rough titanium surfaces engineered by plasma spray, or sandblast/acid-etch techniques.12–14,17
Loading cells with calcein-AM, and more convincingly by examining the ultrastructure of cells by SEM and staining the actin cytoskeleton and focal adhesions, all techniques consistently showed that cells on the smooth surfaces (TC plastic, microscopic glass coverslips, and solid titanium) adhered stronger, spread out more and covered more area, and were more cuboidal shaped with less pronounced cellular extensions compared to cells attaching to the rough titanium surface. This is indicated by the formation of extensive stress fibers and many robust, actively signaling focal adhesions (based on pTyr397-specific staining). In contrast, on rough titanium, the actin cytoskeleton and focal adhesions were much less developed. Cells attaching to PEEK showed morphology and adhesion characteristics in between that correlated with PEEK’s inert biological properties.5 To our knowledge, cytoskeletal structure, cell adhesion, and ultrastructural morphology of osteoblastic cells have not been investigated on plasma sprayed titanium surfaces before, however they were investigated on sandblasted/acid-etched or otherwise roughened titanium surfaces and their findings correlate with ours.21,52,53
We were surprised to find efficient adhesion and proliferation of MG-63 cells to our smooth machined solid titanium surfaces (Ra = 0.54 ± 0.06 μm) as smooth titanium does not bond well to tissues as it forms a layer of titanium oxides on its surface that causes its bio-inertness.27 However, titanium attracts calcium and phosphate ions, readily adsorbs proteins, and stimulates cells to secrete hydroxyapatite (HA) and extracellular matrix proteins and to form an osteogenic microenvironment.27,54,55 It is likely that these surface modifications also occurred on the smooth titanium samples under our culture conditions. Several studies have, however, shown that the process is strongly enhanced on rough titanium surfaces.20,27,54,55
Interestingly, many of the biological characteristics described for rough and porous titanium implants are shared by other engineered implant materials, eg, highly porous bioactive glasses that we fabricated and characterized in detail previously.44–49 Porous bioactive glasses, as described for roughened titanium surfaces above, form a layer of HA, readily absorb proteins, reduce osteoblast adhesion and proliferation, and stimulate pre-osteoblast differentiation.44–49 Furthermore, research including our own has shown that these cellular responses are largely driven by the material’s chemical and physical surface characteristics.14,16,17,19,23,44,46,47,49 Taken together, it becomes clear that increasing surface roughness and porosity not only increase the reactive surface area of the biomaterial, but more importantly that osteoblastic cells are able to detect surface topology on a wide nanometer scale range (tens to hundreds of nanometers), and will react differently, according to specific surface parameters.12,14,15,24,44,46,47,49 While a large number of studies suggest that rough titanium surfaces offer a better implant performance compared to smooth titanium surfaces, in part because of their increased surface roughness, ultrahigh values of roughness (Ra of 52–74 μm) are not correctly sensed by osteoblastic cells and thus are not compatible with optimal titanium implant performance.12,14–17,19,23,42,43,54,55 Interestingly, osteoclasts (bone-degrading cells), were found to react to smooth and rough titanium surfaces similarly to osteoblasts.56 Thus, in vitro studies, such as this one, are helpful to better understand much more complex in vivo implant/tissue interactions.
Conclusions
Here, we examined the response of MG-63 osteoblast-like cells including cell adhesion, proliferation, and ultrastructural morphology to a rough and porous plasma-sprayed titanium surface and compared it to MG-63 cells seeded onto smooth surfaces including solid titanium, PEEK, TC plastic, and microscopic cover glasses. We found that cells adhered stronger and proliferated faster on smooth surfaces compared to the rough titanium surface, suggesting that the rough titanium surface promoted cell differentiation more strongly than any of the smooth surfaces. Our findings are mostly in agreement with previously published results examining cell response to rough, plasma sprayed, sandblasted/acid-etched, or otherwise roughened titanium surfaces.
Interestingly, our findings on rough titanium also correlate with osteoblastic cell adhesion, proliferation, and differentiation on highly porous bioactive glasses that we have engineered and characterized previously. The shared results indicate that osteoblastic cells are capable of sensing and discerning surface topology of an implant material in a wide nanometer range (tenth to hundreds of nanometers), materials and surface characteristics influence the amount and topology of adsorbed HA and proteins, and that these in turn stimulate adhesion, proliferation, and differentiation characteristics of interacting cells, and ultimately the clinical performance of an implant material. In summary, our data convincingly demonstrate that surface topology even of the same material (in this case titanium), drastically affects cell proliferation, adhesion and cell morphology, and that surface topology considerably modulates cell response.
Author Details
The current address of Michael Levin is Department of Bioengineering, College of Engineering, Temple University, Philadelphia, PA 19122, USA.
Acknowledgments
ML thanks Dr. Caitlyn Hyland, and Dr. Susan Perry for helping with cell culture and fluorescence microscopy, and Bill Mushock and Robert Keyse for helping perform SEM analyses. We would like to thank Dr. Byron Masai for critical discussions during the initial face of this study. This project was financed (in part) by a grant from the Commonwealth of Pennsylvania, Department of Community and Economic Development through its Pennsylvania Manufacturing Innovation Program. Matching funds were provided by Aesculap Implant Systems, LLC, as well as supplemental support by the T.L. Diamond Chair endowment at Lehigh University. Any opinions, findings, conclusions, or recommendations expressed herein are those of the author(s) and do not reflect the views of the Commonwealth of Pennsylvania.
Disclosure
This study was supported by a Manufacturing Innovation Program grant from the State of Pennsylvania and matching funds provided by our industry partner (Aesculap Implant Systems, LLC) that covered ML’s salary and tuition as well as some materials. ML was a Lehigh Master’s student, MMF and HJ are Lehigh professors. All three have no financial relations with Aesculap and have not declared any conflicts of interest. RCS is a paid employee of Aesculap Implant Systems, LLC, and Aesculap Biologics, LLC. The authors report no other potential conflicts of interest for this work.
References
1. Betts JG. Anatomy and physiology, OpenStax college; 2013. Available from: http://cnx.org/contents/[email protected]. Accessed April 12, 2022.
2. Sumita M, Hanawa T. 9.04 - failure processes in biometallic materials. (R. O. In I Milne, Ed.). Comprehen Struct Integr. 2003;9:131–167.
3. Albrektsson T, Brånemark PI, Hansson HA, Lindström J. Osseointegrated titanium implants. Requirements for ensuring a long-lasting, direct bone-to-implant Anchorage in man. Acta Orthop Scand. 1981;52(2):155–170. doi:10.3109/17453678108991776
4. Brånemark PI, Breine U, Johansson B, Roylance PJ, Röckert H, Yoffey JM. Regeneration of bone marrow. Cells Tissues Organs. 1964;59(1–2):1–46. doi:10.1159/000142601
5. Torstrick FB, Safranski DL, Burkus JK, et al. Getting PEEK to stick to bone: the development of porous PEEK for interbody fusion devices. Tech Orthop. 2017;32(3):158–166. doi:10.1097/BTO.0000000000000242
6. Abraham CM. A brief historical perspective on dental implants, their surface coatings and treatments. Open Dent J. 2014;8:50–55. doi:10.2174/1874210601408010050
7. Saini M, Singh Y, Arora P, Arora V, Jain K. Implant biomaterials: a comprehensive review. World J Clin Cases. 2015;3(1):52–57. doi:10.12998/wjcc.v3.i1.52
8. Brånemark PI. Osseointegration and its experimental background. J Prosthet Dent. 1983;50(3):399–410. doi:10.1016/S0022-3913(83)80101-2
9. Corrosion resistance of titanium; 2011. Available from: https://www.nrc.gov/docs/ML9932/ML993210187.pdf. Accessed April 12, 2021.
10. Parithimarkalaignan S, Padmanabhan TV. Osseointegration: an update. J Indian Prosthodont Soc. 2013;13(1):2–6. doi:10.1007/s13191-013-0252-z
11. Butterman GR. Anterior cervical discectomy and fusion outcomes over 10 years: a prospective study. Spine. 2018;43(3):207–214. doi:10.1097/BRS.0000000000002273
12. Borsari V, Giavaresi G, Fini M, et al. Physical characterization of different-roughness titanium surfaces, with and without hydroxyapatite coating, and their effect on human osteoblast-like cells. J Biomed Mater Res Part B Appl Biomater. 2005;75(2):359–368. doi:10.1002/jbm.b.30313
13. Cheng BC, Koduri S, Wing CA, Woolery N, Cook DJ, Spiro RC. Porous titanium-coated polyetheretherketone implants exhibit an improved bone-implant interface: an in vitro and in vivo biochemical, biomechanical, and histological study. Med Devices. 2018;11:391–402. doi:10.2147/MDER.S180482
14. Galli C, Guizzardi S, Passeri G, et al. Comparison of human mandibular osteoblasts grown on two commercially available titanium implant surfaces. J Periodontol. 2005;76(3):364–372. doi:10.1902/jop.2005.76.3.364
15. Gui N, Xu W, Abraham AN, et al. A comparative study of the effect of submicron porous and smooth ultrafine-grained Ti-20Mo surfaces on osteoblast responses. J Biomed Mater Res A. 2018;106(7):2020–2033. doi:10.1002/jbm.a.36402
16. Guizzardi S, Galli C, Martini D, et al. Different titanium surface treatment influences human mandibular osteoblast response. J Periodontol. 2004;75(2):273–282. doi:10.1902/jop.2004.75.2.273
17. Hickey DJ, Lorman B, Fedder IL. Improved response of osteoprogenitor cells to titanium plasma-sprayed PEEK surfaces. Colloids Surf B Biointerfaces. 2019;175:509–516. doi:10.1016/j.colsurfb.2018.12.037
18. Kulkarni M, Patil-Sen Y, Junkar I, Kulkarni CV, Lorenzetti M, Iglič A. Wettability studies of topologically distinct titanium surfaces. Colloids Surf B Biointerfaces. 2015;129:47–53. doi:10.1016/j.colsurfb.2015.03.024
19. Lange R, Lüthen F, Beck U, Rychly J, Baumann A, Nebe B. Cell-extracellular matrix interaction and physico-chemical characteristics of titanium surfaces depend on the roughness of the material. Biomol Eng. 2002;19(2–6):255–261. doi:10.1016/S1389-0344(02)00047-3
20. Nebe JGB, Luethen F, Lange R, Beck U. Interface interactions of osteoblasts with structured titanium and the correlation between physicochemical characteristics and cell biological parameters. Macromol Biosci. 2007;7(5):567–578. doi:10.1002/mabi.200600293
21. Parisi L, Ghezzi B, Bianchi MG, et al. Titanium dental implants hydrophilicity promotes preferential serum fibronectin over albumin competitive adsorption modulating early cell response. Mater Sci Eng C. 2020;117:111307. doi:10.1016/j.msec.2020.111307
22. Singh AV, Vyas V, Patil R, et al. Quantitative characterization of the influence of the nanoscale morphology of nanostructured surfaces on bacterial adhesion and biofilm formation. PLoS One. 2011;6(9):e25029. doi:10.1371/journal.pone.0025029
23. Yoon BJ, Xavier F, Walker BR, Grinberg S, Cammisa FP, Abjornson C. Optimizing surface characteristics for cell adhesion and proliferation on titanium plasma spray coatings on polyetheretherketone. Spine J. 2016;16(10):1238–1243. doi:10.1016/j.spinee.2016.05.017
24. Zhao G, Zinger O, Schwartz Z, Wieland M, Landolt D, Boyan BD. Osteoblast-like cells are sensitive to submicron-scale surface structure. Clin Oral Implants Res. 2006;17(3):258–264. doi:10.1111/j.1600-0501.2005.01195.x
25. López-Esteban S, Saiz E, Fujino S, Oku T, Suganuma K, Tomsia AP. Bioactive glass coatings for orthopedic metallic implants. J Eur Ceram Soc. 2003;23:2921–2930. doi:10.1016/S0955-2219(03)00303-0
26. Kim MH, Park K, Choi KH, et al. Cell adhesion and in vivo osseointegration of sandblasted/acid etched/anodized dental implants. Int J Mol Sci. 2015;16(5):10324–10336. doi:10.3390/ijms160510324
27. Stepanovska J, Matejka R, Rosina J, Bacakova L, Kolarova H. Treatments for enhancing the biocompatibility of titanium implants. Biomed Pap Med Fac Univ Palacky Olomouc Czech Repub. 2020;164(1):23–33. doi:10.5507/bp.2019.062
28. Aesculap ArcadiusXP L; 2017. Available from: https://docplayer.net/47122457-Arcadius-xp-l-spinal-system-product-brochure-aesculap-spine.htm. Accessed April 12, 2022.
29. Wong M, Eulenberger J, Schenk R, Hunziker E. Effect of surface topology on the osseointegration of implant materials in trabecular bone. J Biomed Mater Res A. 1995;29(12):1567–1575. doi:10.1002/jbm.820291213
30. Butner S. How to Calculate the Time for Cell Doubling; 2017. Available from: https://sciencing.com/calculate-time-cell-doubling-8219903.html. Accessed April 12, 2022.
31. Althaus J, Padeste C, Köser J, Pieles U, Peters K, Müller B. Nanostructuring polyetheretherketone for medical implants. Eur J Nanomed. 2012;4(1):7–15. doi:10.1515/ejnm-2011-0001
32. Novotna Z, Reznickova A, Rimpelova S, Vesely M, Kolska Z, Svorcik V. Tailoring of PEEK bioactivity for improved cell interaction: plasma treatment in action. RSC Adv. 2015;5:41428–41436. doi:10.1039/C5RA03861H
33. Ruijtenberg S, van den Heuvel S. Coordinating cell proliferation and differentiation: antagonism between cell cycle regulators and cell type-specific gene expression. Cell Cycle. 2016;15(2):196–212. doi:10.1080/15384101.2015.1120925
34. Hirata H, Sokabe M, Lim CT. Molecular mechanisms underlying the force-dependent regulation of actin-to-ECM linkage at the focal adhesions. Prog Mol Biol Transl Sci. 2014;126:135–154.
35. Lele TP, Thodeti CK, Ingber DE. Force meets chemistry: analysis of mechanochemical conversion in focal adhesions using fluorescence recovery after photobleaching. J Cell Biochem. 2006;97(6):1175–1183. doi:10.1002/jcb.20761
36. Mitra SK, Hanson DA, Schlaepfer DD. Focal adhesion kinase: in command and control of cell motility. Nat Rev Mol Cell Biol. 2005;6(1):56–68. doi:10.1038/nrm1549
37. Discher DE, Janmey P, Wang YL. Tissue cells feel and respond to the stiffness of their substrate. Science. 2005;310(5751):1139–1143. doi:10.1126/science.1116995
38. Georges PC, Janmey PA. Cell type-specific response to growth on soft materials. J Appl Physiol. 2005;98(4):1547–1553. doi:10.1152/japplphysiol.01121.2004
39. Marques LM, Alves MM, Eugénio S, et al. Potential anti-cancer and anti-candida activity of Zn-derived foams. J of Mate Chem B. 2018;6(18):2821–2830. doi:10.1039/C7TB02726E
40. Santini MT, Rainaldi G, Romano R, et al. MG-63human osteosarcoma cells grown in monolayer and as three-dimensional tumor spheroids present a different metabolic profile: a 1 H NMR study. FEBS Lett. 2004;557(1–3):148–154. doi:10.1016/S0014-5793(03)01466-2
41. Zhao X, Olsen I, Li H, et al. Reactive calcium-phosphate-containing poly(ester-co-ether) methacrylate bone adhesives: chemical, mechanical and biological considerations. Acta Biomater. 2010;6(3):845–855. doi:10.1016/j.actbio.2009.09.020
42. Brett PM, Harle J, Salih V, et al. Roughness response genes in osteoblasts. Bone. 2004;35(1):124–133. doi:10.1016/j.bone.2004.03.009
43. Schwartz Z, Olivares-Navarrete R, Wieland M, Cochran DL, Boyan BD. Mechanisms regulating increased production of osteoprotegerin by osteoblasts cultured on microstructured titanium surfaces. Biomaterials. 2009;30(20):3390–3396. doi:10.1016/j.biomaterials.2009.03.047
44. Kowal TJ, Golovchak R, Chokshi T, et al. Role of phase separation on the biological performance of 45S5 Bioglass®. J Mater Sci Mater Med. 2017;28(10):161. doi:10.1007/s10856-017-5976-6
45. Kowal TJ, Hahn NC, Eider S, et al. New bioactive glass scaffolds with exceptional qualities for bone tissue regeneration: response of osteoblasts and osteoclasts. Biomed Mater. 2018;13(2):025005. doi:10.1088/1748-605X/aa9385
46. Thamma U, Kowal TJ, Falk MM, Jain H. Influence of nanoporosity on the nature of hydroxyapatite formed on bioactive calcium silicate model glass. J Biomed Mater Res B Appl Biomater. 2018;107(4):886–899. doi:10.1002/jbm.b.34184
47. Thamma U, Kowal TJ, Falk MM, Jain H. Nanostructure of bioactive glass affects bone cell attachment via protein restructuring upon adsorption. Sci Rep. 2021;11(1):5763. doi:10.1038/s41598-021-85050-7
48. Wang S, Falk MM, Rashad A, et al. Evaluation of 3D nano-macro porous bioactive glass scaffold for hard tissue engineering. J Mater Sci Mater Med. 2011;22(5):1195–1203. doi:10.1007/s10856-011-4297-4
49. Wang S, Kowal TJ, Marei MK, Falk MM, Jain H. Nanoporosity significantly enhances the biological performance of engineered glass tissue scaffolds. Tissue Eng Part A. 2013;19(13–14):1632–1640. doi:10.1089/ten.tea.2012.0585
50. Brown G, Hughes PJ, Michell RH. Cell differentiation and proliferation–simultaneous but independent? Exp Cell Res. 2003;291(2):282–288. doi:10.1016/S0014-4827(03)00393-8
51. Lynch JP, Silberg DG. To differentiate or proliferate? The interaction between PI3K/PTEN and Cdx2. Gastroenterology. 2002;123(4):1395–1397. doi:10.1053/gast.2002.36374
52. Salido M, Vilches JI, Gutiérrez JL, Vilches J. Actin cytoskeleton in human osteoblasts grown on different dental titanium implant surfaces. Histol Histopathol. 2007;22(12):1355–1364. doi:10.14670/HH-22.1355
53. Uggeri J, Guizzardi S, Scandroglio R, Gatti R. Adhesion of human osteoblasts to titanium: a morpho-functional analysis with confocal microscopy. Micron. 2010;41(3):210–219. doi:10.1016/j.micron.2009.10.013
54. Boyan BD, Lossdörfer S, Wang L, et al. Osteoblasts generate an osteogenic microenvironment when grown on surfaces with rough microtopographies. Eur Cell Mater. 2003;24(6):22–27. doi:10.22203/eCM.v006a03
55. Nishimoto SK, Nishimoto M, Park SW, et al. The effect of titanium surface roughening on protein adsorption, cell attachment, and cell spreading. Int J Oral Maxillofac Implants. 2008;23(4):675–680.
56. Brinkmann J, Hefti T, Schlottig F, Spencer D, Hall H. Response of osteoclasts to titanium surfaces with increased surface roughness: an in vitro study. Biointerphases. 2012;7(1–4):34. doi:10.1007/s13758-012-0034-x
 © 2022 The Author(s). This work is published and licensed by Dove Medical Press Limited. The
full terms of this license are available at https://www.dovepress.com/terms
and incorporate the Creative Commons Attribution
- Non Commercial (unported, 3.0) License.
By accessing the work you hereby accept the Terms. Non-commercial uses of the work are permitted
without any further permission from Dove Medical Press Limited, provided the work is properly
attributed. For permission for commercial use of this work, please see paragraphs 4.2 and 5 of our Terms.
© 2022 The Author(s). This work is published and licensed by Dove Medical Press Limited. The
full terms of this license are available at https://www.dovepress.com/terms
and incorporate the Creative Commons Attribution
- Non Commercial (unported, 3.0) License.
By accessing the work you hereby accept the Terms. Non-commercial uses of the work are permitted
without any further permission from Dove Medical Press Limited, provided the work is properly
attributed. For permission for commercial use of this work, please see paragraphs 4.2 and 5 of our Terms.