Back to Journals » Eye and Brain » Volume 13
Effects of tACS-Like Electrical Stimulation on On-Center Retinal Ganglion Cells: Part I
Received 23 March 2021
Accepted for publication 11 June 2021
Published 12 July 2021 Volume 2021:13 Pages 175—192
DOI https://doi.org/10.2147/EB.S312402
Checked for plagiarism Yes
Review by Single anonymous peer review
Peer reviewer comments 3
Editor who approved publication: Professor Margaret Wong-Riley
Franklin R Amthor, Christianne E Strang
Department of Psychology, The University of Alabama at Birmingham, Birmingham, AL, 35294-1170, USA
Correspondence: Franklin R Amthor
Department of Psychology, The University of Alabama at Birmingham, 1300 University Blvd, Birmingham, AL, 35294-1170, USA
Tel +1 (205) 934-2694
Email [email protected]
Purpose: Electrical stimulation of the human central nervous system via surface electrodes has been used for both learning enhancement and the amelioration of neurodegenerative or psychiatric disorders. However, data are sparse on how such electrical stimulation affects neural circuits at the cellular level. This study assessed the effects of tACS-like currents at 10 Hz on On-center retinal ganglion cell responsiveness, using the rabbit retina eyecup preparation as a model for central nervous system effects.
Methods: We made extracellular recordings of light-evoked spike responses in different classes of On-center retinal ganglion cells before, during and after brief applications of 1 microampere alternating currents using single electrodes and microelectrode arrays.
Results: tACS-like currents (tACS) of 1 microampere produced effects on On-center ganglion cell response profiles immediately after initiation or cessation of tACS, without driving phase-locked firing in the absence of light stimuli. tACS affected the initial transient responses to light stimulation for all cells, sustained response components (if any) more strongly for sustained cells, and the center-surround balance more strongly for transient cells.
Conclusion: tACS sculpted light-evoked responses that lasted for one or more hours after cessation of current without, itself, directly inducing significant firing changes. Functionally, tACS effects could result in effects on contrast thresholds for both broad classes of cells, but because tACs differentially affects the center-surround balance of transient On-center cells, there may be greater effects on the spatial resolution and gain. The isolated retina appears to be a useful model to understand tACS actions at the neuronal level.
Keywords: retina, tACS mechanisms, CNS, in vitro model, neural coding, neuro-modulation
Introduction
There is considerable research on the use of external electrical stimulation of the brain for both the enhancement of normal capabilities, such as learning,1,2 and the amelioration of neurodegenerative or psychiatric disorders,3 Alzheimer’s,4 depression,5 substance abuse,6 schizophrenia,7 binge eating disorder,8 and dyslexia.9 External electrical stimulation of the brain with currents of a few milliamperes using scalp electrodes is non-invasive and appears to modulate ongoing activity rather than driving neurons in the brain directly.10,11 tDCS has been used in pregnant women for depression, for example, because they cannot take antidepressants due to potential harm to the fetus of pharmacological agents.12
There are four main transcranial electrical stimulation protocols: transcranial direct current stimulation (tDCS), transcranial alternating current stimulation (tACS), transcranial pulsed current stimulation (tPCS), and transcranial random noise stimulation (tRNS). tACS is also being used in many human studies. For example, tACS over visual cortex affects the time course of visual perception,13 and the ability to track visual objects.14 Low gamma frequency tACS may enhance processing in dyslexia,15 while theta frequency tACS affects visuospatial working memory.16
Despite the use of various types of electrical stimulation in hundreds of human studies, little is known about its mechanism of action at the neural circuit level. Given the continued use, and promise of external electrical brain stimulation, it would be prudent to have a better understanding of its mechanism of action. Evidence exists in brain slices17 that electrical brain stimulation at field strengths in human use protocols modulates ongoing neural activity, rather than driving it directly. tDCS effects have been investigated by Ozen and colleagues in cortical and hippocampal slices,18 who reported that current stimulation increased synchronous firing in these slices in a current intensity-dependent manner, with thresholds for effects occurring at field strengths as low as 1mV/mm. The effects of tDCS stimulation in intact subcortical structures such as the red nucleus in anesthetized animals were investigated by Baczyk and Jankowska,19 who found a polarity-dependent effect on the excitability of preterminal axonal branches of interposito-rubral neurons for up to 1 hour post-tDCS.
The mechanisms of tACs are even more complex, as the direct effects of current stimulation can be conflated with or depend on other secondary effects. For example, tACS evokes retinal phosphenes20 that can in turn contribute to the effects of tACS [reviewed by Schutter21] or modulate activity through neural entrainment. Synchronization of neural firing by tACS has been reported in the hippocampus and visual cortex22 and synchronization in the frontoparietal network has been reported to improve performance on working memory tasks.23 If electrical stimulation effects near threshold modulate, synchronize, or entrain, rather than directly drive neural activity, investigation of the mechanism of its effects requires that there be ongoing activity to be modulated. However, most brain slice and deeply anesthetized preparations, where currents and cell responses can be investigated quantitatively, have little or unnatural ongoing activity. The retina is an exception in that it can be removed from a euthanized animal completely intact, and, light, the input that drives the retina, can be supplied in vitro in the isolated preparation.
Recordings of the same retinal ganglion cell classes in intact, anesthetized, versus in vitro preparations show that ganglion cell responses are essentially identical in the two preparations, particularly in the rabbit retina, where the first descriptions of different physiological ganglion cell classes were done in anesthetized preparations,24 but work on function/structure identities and central projections involved recordings from the same cells in isolated preparations.25,26 Although the retina is not part of the brain, it is part of the central nervous system, with a well-studied, hierarchical processing structure similar in many ways to that of other central nervous system areas. Because retinal ganglion cells integrate graded signals created by the entire neural processing chain from photoreceptors through bipolar cells,27 effects anywhere in the retina should alter ganglion cell responses.
In a previous study, we examined the effects of tDCS in retina,28 showing that currents of a few microamperes affected most ganglion cell classes during current application, and up to hours afterward. In this study, we have made a similar examination of tACS effects on On-center ganglion cells with currents of 1–2 microamperes, at a frequency of 10 Hz. This study sought to test several hypotheses about the location and mechanism of tACS effects in the retina near threshold in the same isolated eyecup preparation. If electrical stimulation primarily affects photoreceptor responses near threshold, similar effects should be seen in all classes of ganglion cells. Threshold effects on horizontal cells should modify gain and center-surround balance across most ganglion cells. Differential effects on bipolar cells would be expected to modulate On and Off pathways independently. Effects on amacrine cells might more strongly modulate responses of some ganglion cell classes versus others. Finally, effects on ganglion cells, such as on the ganglion cell threshold, should reveal themselves as a continuous modulation of ganglion cell firing directly in or out of phase with the alternating current, such as has been observed in hippocampus and visual cortex.22
tACS currents of 1 microampere had similar effects as tDCS, but appeared to be more consistent. Ten minutes of tACS current, a time typically used in human electrical stimulation studies,29 produced persistent firing changes up to 1.5 hours after cessation of current (the longest duration we examined). The retina appears to be an attractive model of electrical stimulation effects on the central nervous system.
Materials and Methods
All methods were similar to those in a previous tDCS study28 except for the use of microelectrode arrays and alternating, rather than direct stimulating current.
Animals
All animals were maintained in accordance with the National Institute of Health Guide for the Care and Use of Laboratory Animals (NIH Publications No. 80-23, revised 1996), and the Global Statement on the Use of Animals in Research (Federation of European Neuroscience Societies, Japan Neuroscience Society, International Brain Research Organization, and Society for Neuroscience). All experimental procedures were approved by The University of Alabama at Birmingham (UAB) Institutional Animal Care and Use Committee. UAB is accredited by the American Association for Accreditation of Laboratory Animal Care. Retina preparations and electrophysiology methods were similar to those previously reported.28
Retina Preparation
New Zealand albino rabbits (1.6–4.2 kg) of both sexes were dark adapted and anesthetized with urethane (2 g/kg i.p.; Sigma-Aldrich, St. Louis, MO). The eyes were enucleated under dim red light and the animal euthanized with 1 mL Fatal Plus (i.v.; Vortech Pharmaceuticals, Dearborn, MI). After removal, each eye was hemisected in refrigerated oxygenated bicarbonate-buffered (95% O2 and 5% CO2) Ames medium (Sigma-Aldrich), and the lens and vitreous removed. The resulting eyecup containing the retina was everted onto a domed chamber where it was superfused with heated (35–38°C) bicarbonate-buffered Ames medium (about 3.5 mL/min). Ganglion cell somas were sometimes visualized using Azure B (Sigma-Aldrich) solution, a few drops of which were added to the superfusate flowing over the retina at the beginning of recording.30 Under these conditions, retinas can remain stably responsive for 8 or more hours.
Ganglion Cell Recordings
Recordings were made with multi-electrode array elements with silver-plated, stainless steel electrode wires were used to obtain recordings of light responses from ganglion cells in central and mid-peripheral inferior retina, typically from just below the visual streak of the rabbit retina. Multi-electrode arrays allowed testing the effects of tACS current on neighboring ganglion cells simultaneously. The multi-electrode arrays were similar to those of Amthor et al,30 except that stainless steel wires were used rather than carbon fibers. Extracellularly recorded signals of spiking ganglion cells were amplified conventionally and digitally stored via a Measurement Computing data acquisition boards (USB-1608 and USB-201, Measurement Computing Corp., Norton, MA) and analyzed offline as described below.
Spike extractions from the analog recordings were performed by thresholding template convolved traces using MATLAB (MathWorks, Natick, MA). Thresholded spikes were integrated, graphed, and analyzed for statistical significance using programs written for MATLAB. Ganglion cell activity (average spikes/sec) that occurred within the 1000 msec following light stimulus onset was defined as the On epoch, and activity that occurred within the 1000 msec after light offset was defined as the Off epoch. Activity occurring during the 1000 msec prior to spot onset was used to define the maintained epoch firing rate. This study reports only data runs where spike height and stability were maintained throughout the experiment, other than the obvious effects on spike time patterning at the onset and offset of current application.
Light Stimuli
Light stimuli generated by a custom LED array shown schematically in Figure 1 were projected through the microscope objective onto the retinal surface in single microelectrode recordings, or through a lens above the retina for multi-electrode array recordings. Stimuli were generated using 3 mm white LEDs (Adafruit P3819A) in a 7×7 array (total extent 30×30 mm), driven by an Arduino Mega microcontroller, which also controlled the experimental sequence and data acquisition. The timing precision of light flashes in this system was better than 100 microseconds. The LED array was mounted on a micromanipulator to allow centering with respect to the recording electrode(s). In microelectrode array experiments, light from the LED array was projected by a focal length 30 mm lens onto the retina where the LED array image spanned about 4×4 mm on the retina. In the single microelectrode recordings, the LED array was projected through a 20× water immersion objective to a size of 1.5 mm on the retina.
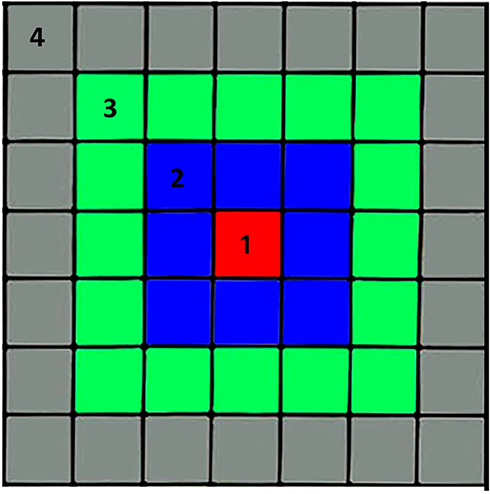 |
Figure 1 Stimuli were generated using 3-mm white LEDs (Adafruit P3819A) in a 7×7 array. Five stimulus configurations were used: 1) the central single LED (red), 2) the central 9 LEDs (red plus blue), 3) the central 25 LEDs (red plus blue plus green), 4) all LEDs, and (5) the annular ring of outer LEDs (gray). Two intensities were presented: 20 microampere and 10 microampere per LED for all LEDs. Each stimulus sequence consisted of 1000 msec period of baseline spiking activity, 1000 msec with the LED(s) on, and 1000 msec after LED illumination, for the off period. Stimuli were presented in the same order, from smallest to largest spot, then annulus, at high intensity, followed by the same order at half intensity. |
The layout of the LED array is shown schematically in Figure 1. The stimuli used to generate retinal responses were as follows: 1) the central single LED, 2) the central 9 LEDs, 3) the central 25 LEDs, 4) all LEDs, and 5) the annular ring of outer LEDs. Configurations 1–4 are referred to in the figures as Spot 1, Spot 2, and so forth. The annular ring is referred to as “Annulus”. Two intensities were presented: 20 microampere and 10 microampere per LED for all LEDs. Spots 6–10 are the same as 1–5 except half intensity. In early experiments (Sep 12 and Oct 10) the lower intensities were created using pulse width modulation of the Arduino at 960 Hz, but after that, reduced intensity was created by a higher resistance in series with the LED so that intensity was continuous. At maximum brightness, the LED array intensity was 12.5 times that of a standard 100 cd/m2 computer monitor. The LED array intensity was usually attenuated by a factor of 5–10 with neutral density filters in each experiment so that half intensity stimuli were consistently above threshold. We used a limited number of stimuli in order to record, as rapidly as possible, responses before, during, and after tACS, so that changes in responsiveness due to rundown of the isolated retina, or other time factors, was minimized.
Each stimulus sequence consisted of a 1000 msec period of baseline spiking activity, then 1000 msec with the LED(s) for the On period, and then 1000 msec after LED illumination, for the Off period. Experiments presented each of the 10 stimulus types (spots 1–4 and annulus) for 20 presentations of each type typically lasted about 30 minutes (3 seconds per stimulus × 10 stimulus types × 20 stimuli for each pre-, during, post-tACS epoch). Stimuli were presented in the same order, from smallest to largest spot, then annulus, at high intensity, followed by the same order at half intensity. In post-experiment timing verification, we found that at the beginning of some recording runs Windows inexplicably delayed the onset of DAQ acquisition by up to 100 msec in the 1000 msec pre-stimulus epoch for the first presentation of Spot-1, so we generally excluded results from Spot-1 in comparative quantitative data analysis.
Alternating Current Application
The recording and electrical stimulus configurations were similar to those we used for the tDCS study.28 One current electrode was a stainless steel wire shallowly immersed in the superfusion bath over the retina near the recording electrode(s). The reference electrode was a silver–silver chloride ring at the chamber bottom that served as both the ground/reference electrode for recording and as the other electrode for tACS current application. The tACS currents were generated by a sinusoidal function generator (Instek GFG-8219A) through a current limiting resistor. The current RMS amplitude in all microelectrode array experiments in this study was 1 microampere, continuously monitored by an in-line digital multimeter (Neotek) in micro-ammeter mode. All microelectrode array results in this study used phase-locked sinusoidal current stimulation, so that the phase of the injected current was the same in every base, light stimulation on, light off trial. The alternating current frequency was 10 Hz, a frequency capable of evoking retinal phosphenes20 and affecting visual perception13 in human tACS studies.
We did not directly record the tACS current waveform with the cellular response data. Rather, we averaged and filtered the ganglion cell analog data itself and extracted the average tACS waveform, which is shown in the phase-locking figure at the end of the ‘Results’ section.
Ganglion Cell Classification
Given the limited number of stimuli, and the fact that the LED array was centered only on the middle electrodes in the microelectrode array, it was not possible to unambiguously assign each recorded ganglion cell to a particular known final class from the responses to the small set of stimuli used. In particular, for cells recorded with microelectrodes near the edge of the array, the concentric spots were not centered on some cell’s receptive fields, and the smallest spot (Spot 1) may have been in the surround of those cells, not the center. Data from the four concentric spot sizes, and one annulus, at two intensities, were sufficient only to classify cells into the broad groups of On-center versus Off-center, and sustained versus transient. Given that there are over 30 ganglion cell classes27 in mammalian retina, it is obvious that ganglion cells in each broadly defined group, such as On-center sustained and On-center transient, almost certainly include members of several actual classes.
Data Processing
The analog recordings of ganglion cell responses, digitized at 4 kHz with 12 bit resolution, were processed in MATLAB as described previously28 to extract spikes. The stimulus spot (called a case in figures) with the largest unequivocal light-evoked response(s) prior to electrical stimulation is generally shown in most detail in this report. For each condition (before tACS current, during tACS, post-tACS), 20–30 epochs of baseline, light on, light off were acquired. All peri-stimulus time histograms (PST) were calculated with 20 msec bins. The mean and standard deviation of these 20 msec bins of responses during 18–30 trials was calculated and exported from MATLAB. We also computed average PST firing profiles for all pre-tACS, during tACS, and post-tACS stimuli. Center versus surround effects were identified by comparing responses to the different spot sizes and annuli.
Data were also imported into GraphPad Prism 9 (La Jolla, CA, USA) to assess the overall statistical differences between conditions. Two-way ANOVAs (alpha set at 0.05) were used to compare the column means for each condition, followed by Tukey’s multiple comparison to analyze light responses and bin by bin (20 msec) differences between pre, during, and post-current epochs for each data run (simple row effects). Tukey’s multiple comparison tests were adjusted to limit the familywise error rate to 0.05. The multiplicity adjusted p-values (*p<0.05, **p<0.001, ***p<0.0001) as determined by the family of comparisons are indicated in the figure panels and figure legends. The error bars represent 95% confidence interval (CI).
Spatial Heat Maps
The responses as a function of stimulus configuration are illustrated by “heat maps” computed from the responses to spots 2–4. The central nine squares, which comprise spot 2, show the average response to that spot configuration. Spot 3 is comprised of the spot 2 plus the ring of squares around spot 2. What is plotted in the heat maps for that ring of squares is the difference between the response to spot 3 and the response to spot 2. Thus, if there was no difference between the responses to spot 2 and spot 3, this ring is plotted green. If spot 3 generated more spikes than spot 2, this ring is colored yellow through red. If spot 3 inhibited the response to spot 2, the ring is colored a shade of blue. The same plotting scheme is used for the outer ring of squares, which takes the difference between the response to spot 4 and spot 3. Data from the annulus are shown in figures, but annular responses were not used to make the heat maps.
Results
We concentrated on obtaining data from the first tACS application in each retina, because of the variability seen in effects from multiple applications in our previous tDCS study.28 This variability is not surprising given our finding in that study that 15-minute 1 microampere tDCS application had effects lasting for hours, so that subsequent applications of tDCS current were acting on a retina already dynamically modified by the previous current applications. We show here the results from eight complete data runs (baseline, during, and after current application) from the first, run-1 tACS application in that retina. The multi-electrode array allowed us to obtain as numerous simultaneous recordings from applications of tACS current to the retina.
tACS Can Induce Sudden Changes
An example of the sudden change in the responsiveness of an On-center sustained ganglion cell (Oct10R1Ch2) at the onset of 1 µA of current is shown in the raster plots in Figure 2A. The tACS current is on throughout the red area. The light stimulus is on for 1 second in each stimulus epoch in the green area. Black dots are the pre-tACS epochs, red dots during tACS, and blue dots post-tACS. At the onset of tACS current (top of red area, red dots), the initial transient component of the On-center response is severely reduced, and the brief, weak transient surround-Off response is nearly eliminated. These effects tend to persist after cessation of tACS current (blue dots). Note that the tACS current does not itself induce any significant firing outside the On response area (green), indicating that it sculpts light elicited responses rather than driving the ganglion cell directly at the stimulation levels used in this study. The bar plots to the right of the raster plots in Figure 2A show the total spike counts in each stimulus epoch for the On responses (yellow bars) and Off responses (black bars).
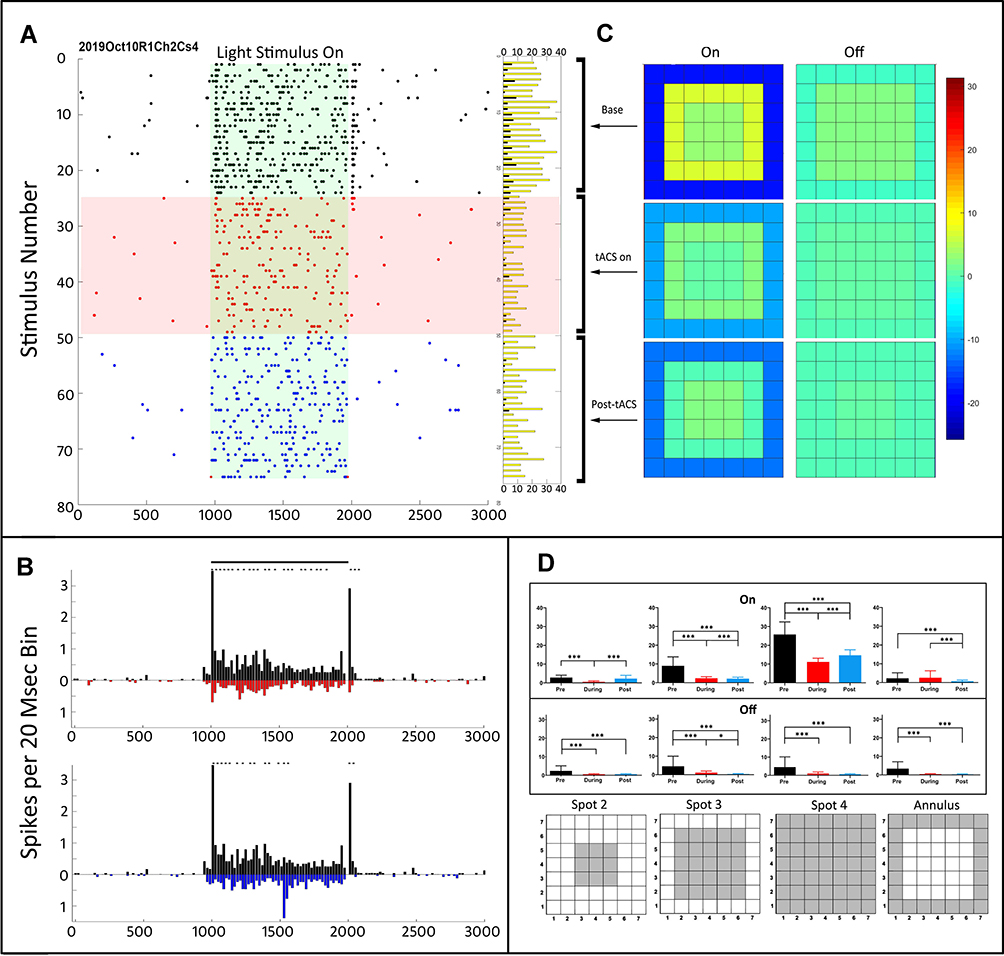 |
Figure 2 (A) Raster plot of all spikes elicited by light stimuli pre-tACS (black), during tACS (red), and post-tACS current (blue). Each raster line is a 3-second epoch consisting of 1 second of recording before light on, 1 second of recording during light on, and 1 second after light off. The green area indicates the time during which the stimulus light was on in each epoch. The red area indicates the time during which the 1-microampere tACS current was on. The horizontal columns to the right of the raster lines indicate the total spikes for on (yellow) and off (black) from each raster line. Overall ANOVA p=0.05; column effect p<0.0001; all cases. (B) Peri-stimulus time profiles comparing firing pattern before tACS (black) vs during tACS (red) in the top panel, and pre-tACS vs post-tACS in bottom panel. Asterisks indicate statistical differences between individual bins in the two plots at the <0.05 level. (C) Heat maps of the On and Off responses as a function of stimulus configuration (see the ‘Methods’ section). (D) Average (95% CI) On responses (top) and Off responses (bottom) as a function of spatial configuration for all pre-tACS epochs (black), epochs during tACS (red), and post-tACS (blue). Asterisks denote statistical significance between responses, *p<0.05, ***p<0.0001. The data from spots 2–4 were used to make the heat maps. Spot configurations are shown below. |
Figure 2B shows the PST histograms of the light-elicited responses before (black), during (red) and post-tACS (blue). The top plot compares the pre-tACS responses with those during tACS (plotted as red, negative going). It is clear that the onset of tACS severely reduces the fast initial transients in both On and Off responses, as well as the overall firing level in the sustained portion of the On response. The bottom panel compares pre-tACS with post-tACS PST histograms, showing that most of the changes induced by tACS current persist after cessation of the current. We found that 1 µA tACS always induced changes in the PST histograms, whether or not significant changes in total spike count occurred.
Figure 2C shows heat maps for the On and Off responses as a function of stimulus configuration (see the ‘Methods’ section for how these were computed). The On-response center excitation and surround inhibition is weakened during tACS. Post-tACS, the surround inhibition increases, but the On-center excitation remains reduced. Figure 2D shows bar plots of the On (top) and Off (bottom) responses for each spatial configuration (Spots 2–4) upon which the heat maps above were computed, plus that for the annulus.
On-Center Sustained Cells
We used the microelectrode array to make simultaneous recordings from several ganglion cells to determine whether previously observed variability in electrical stimulation effects was due to factors such as retinal condition, location of the cell with respect to the stimulating electrode, or other unknown factors in different recording and current applications. Figure 3 shows raster plots of spike responses of four simultaneously recorded On-center sustained ganglion cells in the first (R1) tACS application in that retinal preparation. Changes in response patterns appear to occur in all four cells without large changes in total spike counts. These changes occur in specific parts of the light-evoked response, and are best appreciated by examining the PST profiles before, during and after tACS, shown in Figure 4.
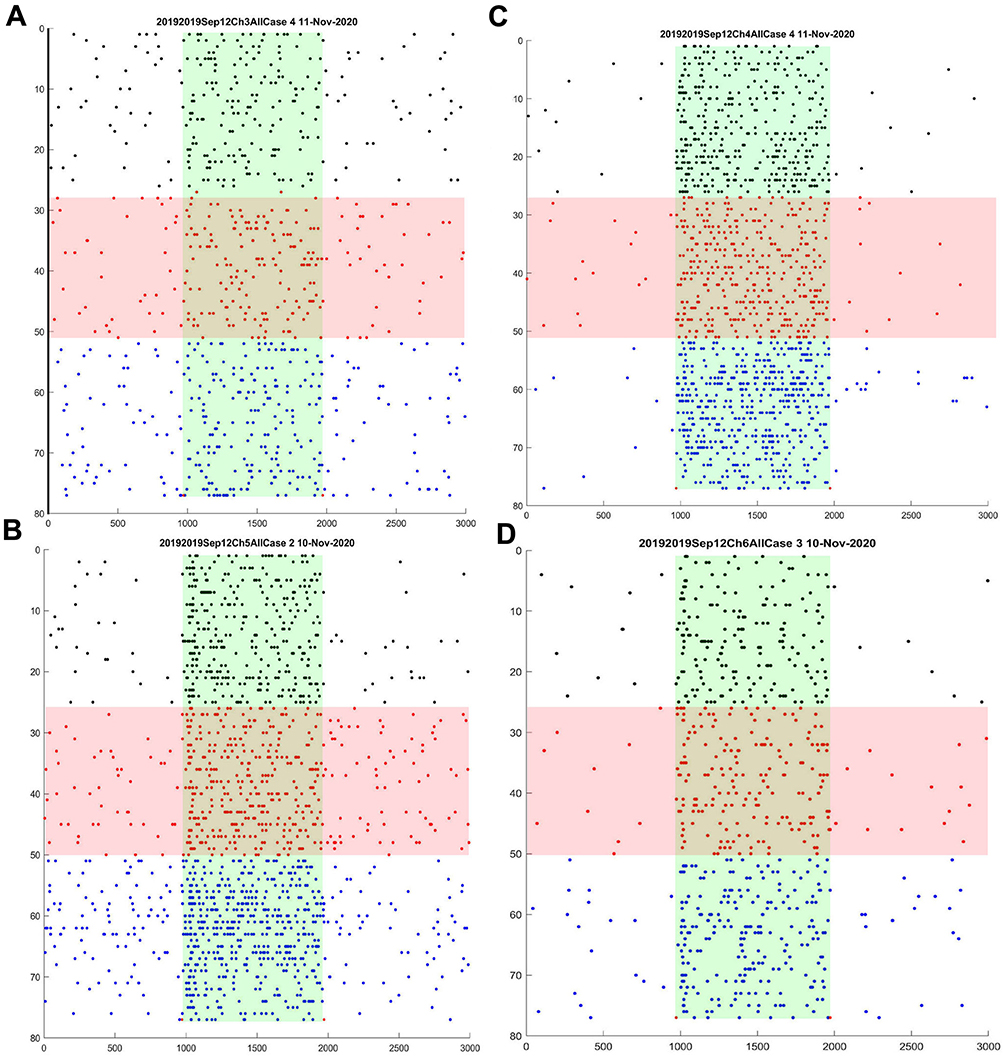 |
Figure 3 (A–D) Raster responses of four simultaneously recorded On-center sustained cells before, during, and after 1-microampere tACS current. Plot conventions are the same as for the raster panel in Figure 2. Overall ANOVA p=0.05; column effect p<0.0001; all cases. |
Figure 4A and B show the average On and Off response spikes elicited by each stimulus in the four simultaneously recorded ganglion cells during the baseline pre-tACS period (black), during tACS (red) and post-tACS (blue). Significant average spike count differences are noted with asterisks (see the ‘Methods’ section).
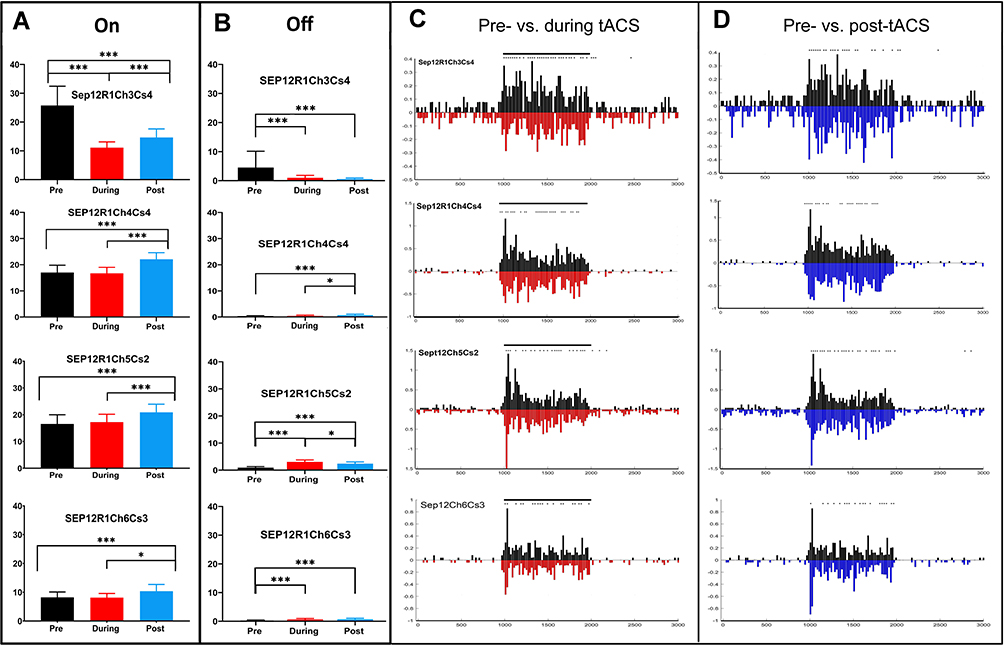 |
Figure 4 Effects of tACS on four simultaneously recorded On-center sustained ganglion cells. (A) Average (95% CI) total On-response spikes before tACS onset (black), during tACS (red) and post tACS (blue). (B) Average Off response spikes during the same epochs. Overall ANOVA p=0.05; column effect p<0.0001; all cases. Asterisks denote statistical significance between responses, *p<0.05, **p<0.001, ***p<0.0001 for A and B. (C) PST histogram responses of pre-tACS (black) versus during tACS (red, plotted negative-going; 20 msec bins, see the ‘Methods’ section). (D) Pre-tACS (black) versus post-tACS (blue, plotted negative-going) average PST histograms. Asterisks indicate statistical differences between individual bins in the two plots at the <0.05 level. |
Figure 4C shows the average PST histograms of the pre-tACS (black) versus during tACS (red, plotted negative-going), for each of the four On-center sustained cells, showing a general reduction in the initial transient On response during tACS current for the four cells. These changes are complex and somewhat different for each of the four cells. For example, the cell in the third row (Sep12R1Ch4Cs2) exhibits an increase in a single early PST bin in the On response during tACS compared to baseline, but later bins in the early transient On response are reduced (asterisks indicated significant differences in individual bins, see METHODS).
Figure 4D compares the pre-tACS response profile with that after tACS cessation, showing that differences in PST shape tend to persist after tACS cessation, although, again the cells behave somewhat differently. For example, the initial transient response post-tACS of the cell in the bottom row (Sep12R1Ch6Cs3) is larger than baseline. tACS effects near threshold on most On-center sustained cells, such as these, virtually always sculpted response shapes, and sometime, but not always, produced changes in overall On and Off spike counts.
Center-Surround Balance
On-sustained cells showed similar patterns of spatial modulation for On and Off responses for the spot sizes used in our experiments. The responses as a function of different stimulus configuration are shown in Figure 5 for the pre-tACS (base), during tACS and post-tACS epochs. The bar plots show the average spike total for each stimulus epoch for the 1 second On and Off periods for each of the spot configurations, as in Figure 2. To the right of the bar plots for the different stimulus configurations for each cell are the heat maps generated from the responses to spots 2–4 as described in the ‘Methods’ section. tACS stimulation only moderately changed center-surround balance from the pre-tACS responses in these cells, despite the significant changes tACS induced in the PST response waveforms. All four On-sustained ganglion cells were affected by tACS similarly, with small increases in both center excitation and surround inhibition.
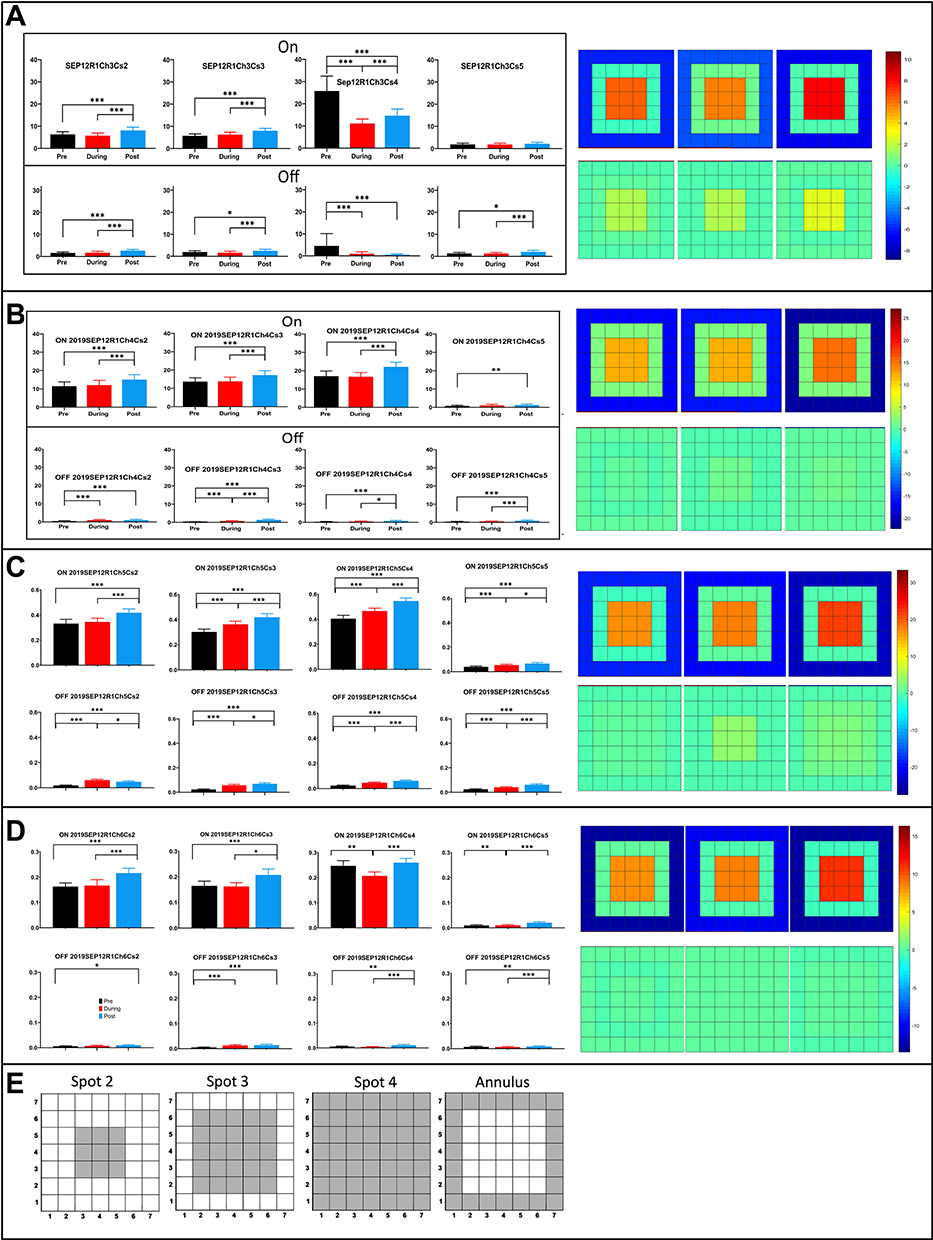 |
Figure 5 Average (95% CI) spike responses as a function of stimulus configuration for four simultaneously recorded On-center sustained ganglion cells. (A) On (top) and Off (bottom) spike responses for Spots 2–4, and the annulus (configurations described in the ‘Methods’ section) for On-center sustained cell Sep12R1Ch3. Heat maps derived from spots 2–4 are shown to the right (B) Spatial responses and heat maps for Sep12R1Ch4. (C) Spatial responses and heat maps for Sep12R1Ch5. (D) Spatial responses and heat maps for Sep12R1Ch6. (E) Configurations of the stimulating spots 2–4, and the annulus. Overall ANOVA p=0.05; column effect p<0.0001; all cases. (A–D) Asterisks denote statistical significance between responses, *p<0.05, **p<0.001, ***p<0.0001. |
In general, most On-center sustained retinal ganglion cells exhibited similar behavior during and post-tACS in the first tACS application in that retina. The greatest tACS effects were usually on the initial transient component of the On response, though the sustained components of the On response were also sometimes affected. Sometimes, there were significant changes in light-evoked spike counts both during tACS current and after cessation of tACS current. In some On-center sustained ganglion cells, tACS inhibited firing during the current, with responses partly recovering afterward (not shown).
On-Center Transient Ganglion Cells
On-center transient ganglion cells reacted differently to tACS from On-center sustained cells, and from each other. The effect of first run tACS current on an On-center transient cell is shown in Figure 6, which was simultaneously recorded with the four On-center sustained cells described in Figures 3–5. The raster plots in Figure 6A show that tACS almost immediately eliminated the small, sustained firing component of the On response, and this persisted after cessation of tACS. The PST histograms (Figure 6B) show that the initial transient portion of the On response was enhanced during tACs at the same time that the small sustained On component was eliminated. After tACS, the initial On transient declined to a level similar to baseline, while the sustained On component remained eliminated.
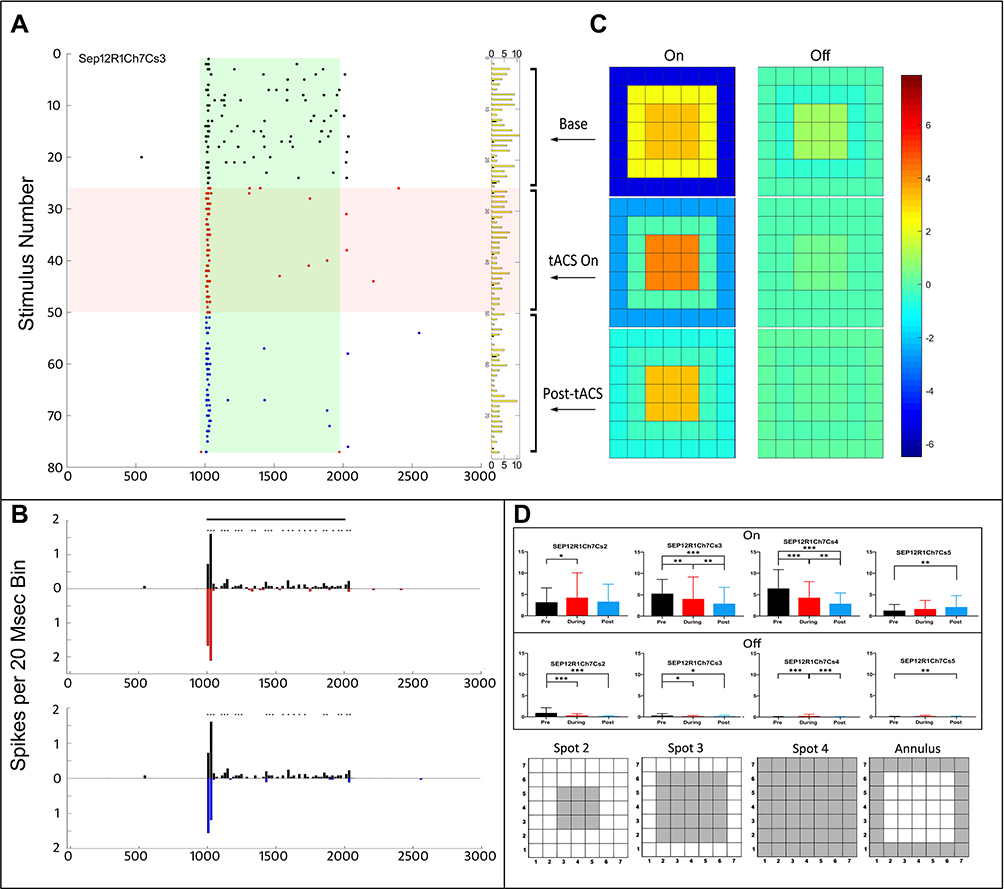 |
Figure 6 Responses of an On-center transient ganglion cell before, during and after tACS current. (A) Raster plots of responses to stimuli before tACS (black), during tACS (red) and post-tACS (blue). Light stimulus is on from 1000 to 2000 msec, as in other plots. Overall ANOVA p=0.05; case 2 column effect p<0.0057, cases 3–4 column effect p<0.0001, annulus column effect p=0.0004. (B) PST histograms comparing responses before with during tACS (top panel), and before with after tACS (bottom panel). (C) Heat maps of spatial configuration effects before, during and post-tACS, conventions the same as in previous figures. Asterisks indicate statistical differences between individual bins in the two plots at the <0.05 level. (D) Bar graphs of average (95% CI) On (top) and Off (bottom) spike responses for spots 2–4 and the annulus. Spot configurations shown schematically below. Asterisks denote statistical significance between responses, *p<0.05, **p<0.001, ***p<0.0001. |
The responses as a function of stimulus configuration are shown in the heat maps in Figure 6C, based on the average responses for the different spot configurations shown in Figure 6D. During tACS, the inhibitory surround is weakened, but the center response strengthened (left, central panel Figure 6C). Post-tACS, the inhibitory surround virtually disappeared (bottom heat map Figure 6C).
Looking at the individual spot configuration responses in Figure 6D, the Spot 2 On responses increased during tACS, but returned to baseline afterward, but the pattern was different for the larger spots 3–4. The On response to the annulus also increased during tACS compared to baseline, and increased again afterward, a pattern not seen for any of the other stimulus configurations in this recording. On response spike counts declined during tACS and afterward for most spots mainly because of the elimination of the sustained On response component. The few Off response spikes elicited by the stimulus followed a similar pattern as the On responses.
Two Simultaneously Recorded, Run-1 On-Center Transient Ganglion Cells
Figure 7 shows recorded data of tACS effects on two, simultaneously recorded run-1 On-center transient retinal ganglion cells. The difference in the response properties of these cells suggests they are members of different On-transient ganglion cell classes, and the tACS effects on these cells are different. The On response of the cell on the left (Figure 7A and B) becomes weaker and more transient during tACS, but post-tACS the On response becomes larger. The heat maps showing the center-surround strength in Figure 7C show that the surround inhibition weakens somewhat during tACS, and is almost entirely lost post-tACS. Figure 7D shows data for the individual spot configurations from which the heat map was generated, as in previous figures.
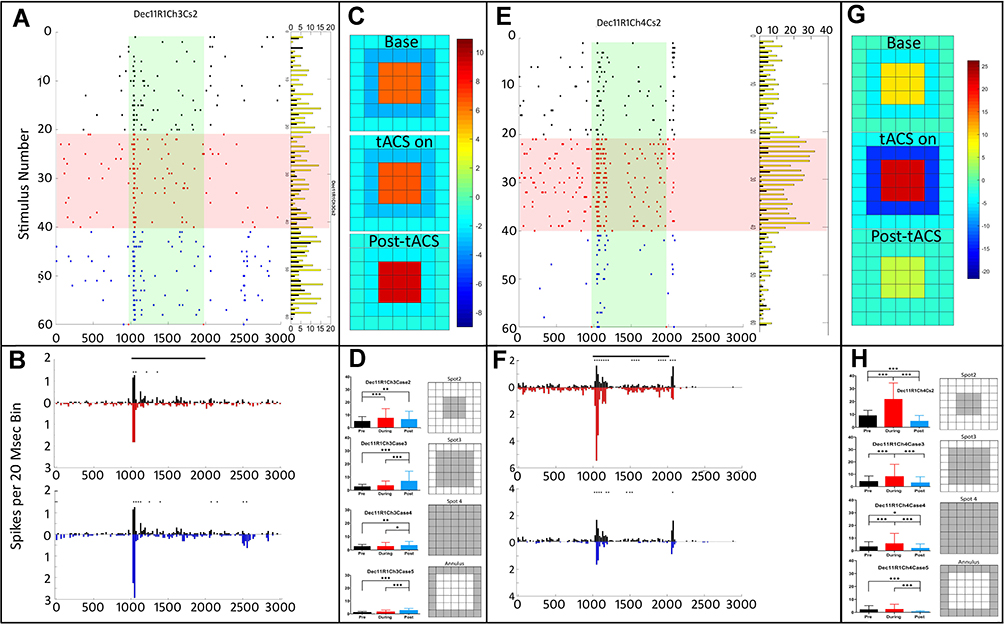 |
Figure 7 tACS effects on two simultaneously recorded run 1 On-center transient ganglion cells. (A). Raster plots of On-center transient cell Dec11R1Ch3Cs2. Overall ANOVA p=0.05; column effect p<0.0001; all cases. (B). PST histograms of the same data, showing baseline, pre-tACS responses in black, responses during tACS in red, and post-tACS responses in blue. Asterisks indicate statistical differences between individual bins in the two plots at the <0.05 level. (C) Heat maps of center-surround spatial organization based on average (95% CI) responses of spots 2–4, which are shown in (D–H) same for simultaneously recorded cell Dec11R1Ch4Cs2. Overall ANOVA p=0.05; column effect p<0.0001; all cases. Asterisks denote statistical significance between responses, *p<0.05, **p<0.001, ***p<0.0001. |
The other simultaneously recorded On-center transient cell in Figure 7E–H exhibits a different pattern. During tACS, there is significant transient response enhancement, with a return to something like the baseline pattern, post-tACS (Figure 7E and F). The small transient Off response that was present in the baseline recording is also reduced during and post-tACS. The heat maps (Figure 7G) show that both the center excitation and surround inhibition are intensified during tACS, but return to near baseline afterward. On-center transient cells more often showed significant tACS-induced receptive field configuration changes than On-center sustained cells in the first, run-1 tACS application.
Phase-Locked Firing
In order to determine the relationship between response sculpting and the tACS waveform, we always phase-locked the tACS stimulation to the light stimulus epoch in microelectrode array recordings (see the ‘Methods’ section) in order to see if any phase-locking was in or out of phase with the tACS waveform.
Most ganglion cell responses did not appear to be visibly modulated in a phase-locked manner with the tACS current waveform. However, we did find a minority of cases in which tACS did appear to modulate the light responses. Two such cases are shown in Figure 8, which shows the PST histograms of two ganglion cells during the pre-tACS epoch (black), compared to that during tACS (red), with the tACS waveform superimposed on the responses at an arbitrary scale. The top panel (Figure 8A) is the same On-center transient cell Dec11R1Ch4 described in the two previous figures. The tACs waveform positive peaks coincide with two peaks in the pre-tACS baseline response. At these two response peaks, strong enhancements in the early transient On response occur during tACS. However, at the peak of the short, transient surround Off-response, which is also at a positive peak of the tACS waveform, there is not enhancement during tACS. The bottom panel (Figure 8B) is for another cell in which the enhancement of the initial transient occurred in the negative phase of the tACS waveform.
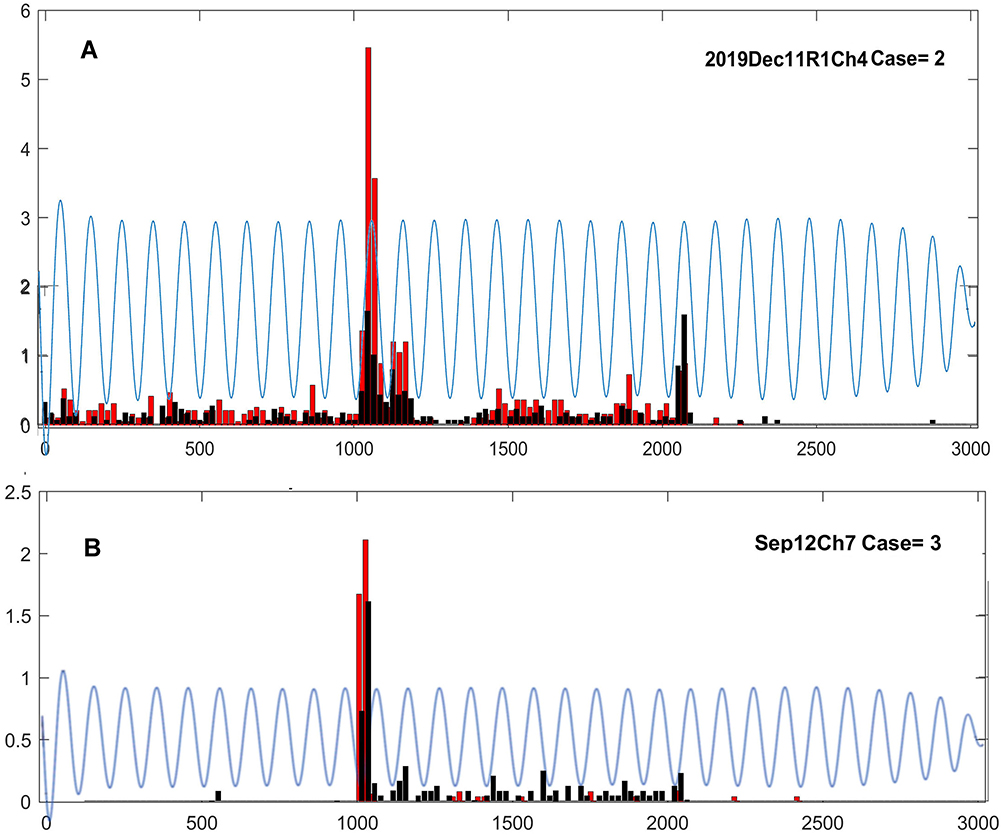 |
Figure 8 PST histograms of ganglion cell firing during the pre-tACS epoch (black), compared to that during tACS (red), with the tACS waveform superimposed on the responses at an arbitrary scale. (A). Cell Dec11R1Ch4. (B). Cell 2019Dep12Ch7. Overall ANOVA p=0.05; column effect p<0.0001; all cases. |
It is unclear why positive phase-locking appeared to occur in some cells, negative in others, and none at all in most. We cannot exclude the hypothesis that occasionally observed phase-locking effects are completely coincidental. This is consistent with the fact that increased, phase-locked firing was virtually never observed during maintained ganglion cell activity, only as sculpting of responses elicited by light. Testing hypotheses about phase-locking explicitly would require manipulating the tACS phase independently with respect to the light stimulus onset and offset.
Discussion
Effects of 1 Microampere tACS at 10 Hz on On-Center Retinal Ganglion Cells
We never observed a failure of tACS currents of 1 microampere at 10 Hz to sculpt ganglion cell PST firing profiles in its first application in that retinal preparation. Generally, tACS currents had small effects on total spike counts, but these were significant in some cases. tACS effects were often observed immediately after initiation of the current, and sometimes, immediately upon cessation of the current. Effects after cessation of current could last for at least 1 hour.
In the first tACS run-1 data reported here, most On-center sustained ganglion cells were slightly inhibited during tACS, but, after cessation, responses typically returned to near baseline or were slightly higher than baseline. The greatest tACS effects in these cells was usually on the initial transient component of the On response, but tACS could also affect the sustained component of the On response. tACS currents typically did not strongly alter the center-surround balance of On-center sustained ganglion cells.
tACS typically had larger effects on On-center transient cells than On-center sustained cells. However, when there were small sustained On-response components in some On-center transient cells, these could be eliminated by tACS application both during the current and afterward. This could occur at the same time the initial transient component was enhanced. The On responses of some On-center transient cells were strongly enhanced during tACS, but strongly decremented afterward. On-center transient cells showed larger changes in center-surround balance than On-center sustained cells. Spike counts in On-center transient ganglion cells were more strongly affected by tACS than On-center sustained cells, but both groups show significant changes in PST histogram shape during and after tACS.
While the groups of sustained and transient On-center ganglion cells almost certainly comprise several additional subclasses, each with different inputs that shape the specific response properties,31 some preliminary conclusions may be drawn. The primary effects of tACS were in changes to the PST histogram shape during and after tACS, specifically on the initial transient response to light stimulation for both sustained and transient cells, while the center-surround balance was more strongly affected for transient cells than for sustained cells. Center-surround receptive field organization controls the spatial properties of ganglion cell receptive fields.32 In general, sustained ganglion cells are specialized for the detection of contrast and form while transient cells are specialized for fast detection of objects and movement.33 Thus, tACS effects on the initial transient may affect contrast thresholds34 for both broad classes of cells, but because tACs differentially affects the spatial resolution and gain of transient On-center cells, there may be greater effects on the detection of visual stimuli for this class of cells.
Together, these indicate that tACS does not modulate ganglion cell firing in a manner consistent with an additive/subtractive mechanism, such as a change in threshold, because the tACS current did not, by itself, cause ganglion cell firing at the stimulation levels used in this study. There was generally no increase in ganglion cell firing in the pre-light stimulus period during tACS stimulation, or in the sustained component of sustained responses. Rather, the effects of the tACS current were to sculpt the light-induced firing pattern, particularly at the onset and offset of the light stimulus. While greater current amplitudes could potentially be sufficient to directly drive ganglion cell firing, our results are consistent with electrical stimulation protocols in typical human interventions where current application is thought only to modulate ongoing neural activity.10,11,17,18
We rarely observed stimulus phase-locked firing in sustained cells, but sometimes in transient cells. Enhancement in some cells was associated with positive peaks of the tACS current, in others, negative peaks. In most cells, however, no phase-locking could be detected. If the effect of the tACS current is via a multiplicative mechanism that sculpts the light-evoked ganglion cell firing, it might, depending on its mechanism and locus, modulate firing that is in or out of phase with the tACS waveform. Phase locking might increase at higher currents, however, which we did not test in this study.
Potential Mechanisms
The tACS-induced changes in the On and Off responses in On-center ganglion cells recorded at the same time, in virtually the same retinal location, argue against hypotheses that attribute most tACS response variability to retinal condition, run number, or location with respect to the stimulating electrode. The results also argue against the locus of effects being early in the retinal processing hierarchy. On and Off responses can change in different directions in the same cells. On and Off responses in different cells recorded at the same time can also change in different directions. This is inconsistent with threshold effects being on photoreceptor, horizontal or bipolar cells, whose responses are relatively sustained.
tACS probably has multiple effects at different thresholds and with different time courses on cells making both excitatory and inhibitory contributions to the responses of integrating neurons like retinal ganglion cells. The most likely locus of these effects is the inner plexiform layer, given the diversity of amacrine cell classes and their effects on different ganglion cell classes. The interpretation that cell-type specific changes in ganglion cell responses arise from the tACs effects on amacrine cells is consistent with the anatomy and physiology of inner retinal circuity. Different classes of On-center ganglion cells would be expected to have somewhat different amacrine cell input from among the more than 50 known mammalian amacrine cell classes,35 and these many different amacrine cell classes could be differentially affected by the tACS current. Effects on amacrine cells might more strongly modulate responses of some ganglion cell classes versus others. For example, center-surround receptive field organization is tuned by inner retinal circuitry.36,37 Thus, the stronger effects of tACS on transient On-cell center-surround balance are consistent with threshold effects on different amacrine cell types. Threshold effects on amacrine cells are also consistent with the fact that larger tACS effects were seen in transient than sustained cells, because transient ganglion cells would be expected to have relatively more amacrine cell input.
Neurotransmitter systems that have been postulated to be affected by electrical stimulation in the CNS include GABA,38 glutamate,39 and BDNF,40 consistent with data showing that CNS electrical stimulation may modulate synaptic plasticity.41,42 Neuroplastic effects are supported by the finding that NMDA-receptor blockade reduces tDCS effects on human motor cortex.43 Brain-derived neurotrophic factor (BDNF) has also been found to be required for tDCS-induced long-term potentiation in mouse primary motor slices,44 and to enhance LTP in rat hippocampal slices via the BDNF TrK pathway.45 tACS effects have been postulated to depend on the location of the stimulating electrode with respect to neurite orientation of the affected cells.46
One potential candidate for mediating electric field effects in the nervous system is the voltage-dependent calcium channel.47 If electric fields open calcium channels, the resulting calcium flux can affect not only neurotransmission but also longer lasting second messenger functions such as protein phosphorylation. This idea is consistent with the variability and long duration of electric field effects we have observed in this study, because calcium flux can produce effects of different kinds and durations in different neurons.
tACS versus tDCS
Although we did not directly estimate current response thresholds in this or our previous tDCS study, we observed generally that tACS effects were more reliable and consistent compared to tDCS effects. In a companion paper, we tested other frequencies than 10 Hz, and observed some frequency-dependent effects. If different frequencies affect different cells differently, it suggests that varying electrical stimulation frequency from 0 Hz (tDCS) to frequencies up to 100 Hz may allowing tuning of effects in human applications to potentiate desirable ones and avoid negative ones. This interpretation is consistent with the possibility that tACS can affect neural synchronization21 that could contribute to spike timing dependent plasticity48 and contribute to gain control and attentional modulation,49 as previously described for entrainment resulting from tACS.22,23
Effects Specific to Retina
Given that electric current affects the retina, possibly for hours or more, it is prudent to consider that stimulation of the retina may occur as a side effect of brain stimulation. For example, electrical stimulation in frontal lobe areas cause some current to pass through the retina, which could be the source of phosphenes reported during current onset and offset in such studies.20 Plasticity induced in retina by electrical brain stimulation may have unknown beneficial or detrimental effects. Neuro-plastic changes in the retina would also be expected to occur as part of electrical stimulation prosthetic treatment for retinal dysfunction itself50,51 that may affect retinal development, function, disease progression or regeneration.52
Beyond the fact that the retina preparation has many properties to suggest itself as a model of electrical stimulation effects in the CNS, there are also reasons to investigate effects of current stimulation on the retina for its own sake. Transcorneal electric stimulation has been used to enhance ganglion cell survival and axon regrowth in an optic nerve crush model of glaucoma.53,54 Electric fields can influence the growth of neurites in cell cultures of CNS neural tissue.55 Electric current may preserve retinal function in a number of retinal degeneration models.56–59 BDNF has been shown to be protective against retinal degeneration,60,61 but delivery usually requires intra-vitreal injection. Electrical stimulation45 could potentially provide a non-invasive method for increasing BDNF-mediated neural protection.
Limitations and future Directions
This study is a survey across a sample of On-center ganglion cell classes of tACS effects near threshold at 10 Hz. It does not establish the actual threshold, the response as a function of current magnitude, nor the threshold for phase locking in any class. The study does not address why multiple applications of tDCS or tACS have different effects in later, than earlier applications. We did not examine tACS effects beyond 1.5 hours. The isolated retina obviously cannot be used to assess effects over the weeks or months which is conducted in humans for putative neuroplastic effects.
It is also possible that tACS increases synchronous firing by entraining neural activity, as reported by Vieira et al,22 which we did not investigate here, but intend to do so in a companion study using nearby, simultaneously recorded ganglion cells using the microelectrode array.
Conclusion
It is important to understand the cellular mechanisms of tDCS because it is being used to modify behavior and treat a myriad of medical conditions and psychiatric disorders. Elucidating these mechanisms can help optimize parameters for greater treatment efficacy, help explain individual differences in responses to tDCS, and avoid possible negative neuroplastic changes. Investigation of electrical stimulation in the well-known circuitry and neurochemistry of the retina may help reveal cellular mechanisms modulated by electric current stimulation and suggest novel pharmacological and neuromodulation targets to potentially enhance the treatment potential of tDCS.
Acknowledgments
This work was supported by a VSRC core (UAB Vision Science Research Center, grant P30 EY003039). The content is solely the responsibility of the authors and does not necessarily represent the official views of the National Institutes of Health (NIH).
Author Contributions
All authors made substantial contributions to conception and design, acquisition of data, or analysis and interpretation of data; took part in drafting the article or revising it critically for important intellectual content; agreed to submit to the current journal; gave final approval of the version to be published; and agree to be accountable for all aspects of the work.
Disclosure
No conflicts of interest for this work, financial or otherwise, are declared by the authors.
References
1. Esmaeilpour Z, Schestatsky P, Bikson M, et al. Notes on human trials of transcranial direct current stimulation between 1960 and 1998. Front Hum Neurosci. 2017;11:71. doi:10.3389/fnhum.2017.00071
2. Hashemirad F, Zoghi M, Fitzgerald P, Jaberzadeh S. The effect of anodal transcranial direct current stimulation on motor sequence learning in healthy individuals: a systematic review and meta-analysis. Brain Cogn. 2016;102:1–12. doi:10.1016/j.bandc.2015.11.005
3. Kekic M, Boysen E, Campbell IC, Schmidt U. A systematic review of the clinical efficacy of transcranial direct current stimulation (tDCS) in psychiatric disorders. J Psychiatr Res. 2016;74:70–86. doi:10.1016/j.jpsychires.2015.12.018
4. Andrade SM, de Mendonça CTPL, Pereira TCL, Fernandez-Calvo B, Araújo RCN, Alves NT. Adjuvant transcranial direct current stimulation for treating Alzheimer’s disease: a case study. Dement Neuropsychol. 2016;10(2):156–159. doi:10.1590/S1980-5764-2016DN1002013
5. Bennabi D, Haffen E. Transcranial direct current stimulation (tDCS): a promising treatment for major depressive disorder? Brain Sci. 2018;8(5):81. doi:10.3390/brainsci8050081
6. Lupi M, Martinotti G, Santacroce R, et al. Transcranial direct current stimulation in substance use disorders: a systematic review of scientific literature. J ECT. 2017;33(3):203–209. doi:10.1097/YCT.0000000000000401
7. Valiengo L, Goerigk S, Gordon PC, et al. Efficacy and safety of transcranial direct current stimulation for treating negative symptoms in schizophrenia: a randomized clinical trial. JAMA Psychiatry. 2020;77(2):121–129. doi:10.1001/jamapsychiatry.2019.3199
8. Burgess EE, Sylvester MD, Morse KE, et al. Effects of transcranial direct current stimulation (tDCS) on binge eating disorder. Int J Eat Disord. 2016;49(10):930–936. doi:10.1002/eat.22554
9. Rios DM, Correia rios M, Bandeira ID, Queiros Campbell F, de Carvalho Vaz D, Lucena R. Impact of transcranial direct current stimulation on reading skills of children and adolescents with dyslexia. Child Neurol Open. 2018;5:5. doi:10.1177/2329048X18798255
10. Anastassiou CA, Montgomery SM, Barahona M, Buzsáki G, Koch C. The effect of spatially inhomogeneous extracellular electric fields on neurons. J Neurosci. 2010;30(5):1925–1936. doi:10.1523/JNEUROSCI.3635-09.2010
11. Creutzfeldt OD, Fromm GH, Kapp H. Influence of transcortical d-c currents on cortical neuronal activity. Exp Neurol. 1962;5(6):436–452. doi:10.1016/0014-4886(62)90056-0
12. Vigod S, Dennis C-L, Daskalakis Z, et al. Transcranial direct current stimulation (tDCS) for treatment of major depression during pregnancy: study protocol for a pilot randomized controlled trial. Trials. 2014;15:366. doi:10.1186/1745-6215-15-366
13. Battaglini L, Mena F, Ghiani A, Casco C, Melcher D, Ronconi L. The effect of alpha tACS on the temporal resolution of visual perception. Front Psychol. 2020;11. doi:10.3389/fpsyg.2020.01765
14. Bland NS, Mattingley JB, Sale MV. No evidence for phase-specific effects of 40 Hz HD–tACS on multiple object tracking. Front Psychol. 2018;9. doi:10.3389/fpsyg.2018.00304
15. Marchesotti S, Nicolle J, Merlet I, Arnal LH, Donoghue JP, Giraud A-L. Selective enhancement of low-gamma activity by tACS improves phonemic processing and reading accuracy in dyslexia. PLOS Biol. 2020;18(9):e3000833. doi:10.1371/journal.pbio.3000833
16. Wolinski N, Cooper NR, Sauseng P, Romei V. The speed of parietal theta frequency drives visuospatial working memory capacity. PLOS Biol. 2018;16(3):e2005348. doi:10.1371/journal.pbio.2005348
17. Buzsáki G, Anastassiou CA, Koch C. The origin of extracellular fields and currents--EEG, ECoG, LFP and spikes. Nat Rev Neurosci. 2012;13(6):407–420. doi:10.1038/nrn3241
18. Ozen S, Sirota A, Belluscio MA, et al. Transcranial electric stimulation entrains cortical neuronal populations in rats. J Neurosci off J Soc Neurosci. 2010;30(34):11476–11485. doi:10.1523/JNEUROSCI.5252-09.2010
19. Bączyk M, Jankowska E. Presynaptic actions of transcranial and local direct current stimulation in the red nucleus. J Physiol. 2014;592(19):4313–4328. doi:10.1113/jphysiol.2014.276691
20. Kar K, Krekelberg B. Transcranial electrical stimulation over visual cortex evokes phosphenes with a retinal origin. J Neurophysiol. 2012;108(8):2173–2178. doi:10.1152/jn.00505.2012
21. Schutter DJLG. Cutaneous retinal activation and neural entrainment in transcranial alternating current stimulation: a systematic review. NeuroImage. 2016;140:83–88. doi:10.1016/j.neuroimage.2015.09.067
22. Vieira PG, Krause MR, Pack CC. tACS entrains neural activity while somatosensory input is blocked. PLoS Biol. 2020;18(10):e3000834. doi:10.1371/journal.pbio.3000834
23. Violante IR, Li LM, Carmichael DW, et al. Externally induced frontoparietal synchronization modulates network dynamics and enhances working memory performance. eLife. 2017;6:6. doi:10.7554/eLife.22001
24. Levick WR. Receptive fields and trigger features of ganglion cells in the visual streak of the rabbit’s retina. J Physiol. 1967;188(3):285–307. doi:10.1113/jphysiol.1967.sp008140
25. Amthor FR, Takahashi ES, Oyster CW. Morphologies of rabbit retinal ganglion cells with concentric receptive fields. J Comp Neurol. 1989;280(1):72–96. doi:10.1002/cne.902800107
26. Amthor FR, Takahashi ES, Oyster CW. Morphologies of rabbit retinal ganglion cells with complex receptive fields. J Comp Neurol. 1989;280(1):97–121. doi:10.1002/cne.902800108
27. Sanes JR, Masland RH. The types of retinal ganglion cells: current status and implications for neuronal classification. Annu Rev Neurosci. 2015;38:221–246. doi:10.1146/annurev-neuro-071714-034120
28. Strang CE, Ray MK, Boggiano MM, Amthor FR. Effects of tDCS-like electrical stimulation on retinal ganglion cells. Eye Brain. 2018;10:65–78. doi:10.2147/EB.S163914
29. Bikson M, Grossman P, Thomas C, et al. Safety of transcranial direct current stimulation: evidence based update 2016. Brain Stimulat. 2016;9(5):641–661. doi:10.1016/j.brs.2016.06.004
30. Amthor FR, Tootle JS, Yildirim A. A new transparent multi-unit recording array system fabricated by in-house laboratory technology. J Neurosci Methods. 2003;126(2):209–219. doi:10.1016/S0165-0270(03)00094-3
31. Zhao X, Reifler AN, Schroeder MM, Jaeckel ER, Chervenak AP, Wong KY. Mechanisms creating transient and sustained photoresponses in mammalian retinal ganglion cells. J Gen Physiol. 2017;149(3):335–353. doi:10.1085/jgp.201611720
32. Muller JF, Dacheux RF. Alpha ganglion cells of the rabbit retina lose antagonistic surround responses under dark adaptation. Vis Neurosci. 1997;14(2):395–401. doi:10.1017/S0952523800011512
33. Ikeda H, Wright MJ. Receptive field organization of ‘sustained’ and ‘transient’ retinal ganglion cells which subserve different functional roles. J Physiol. 1972;227(3):769–800. doi:10.1113/jphysiol.1972.sp010058
34. Dhingra NK, Kao Y-H, Sterling P, Smith RG. Contrast threshold of a brisk-transient ganglion cell in vitro. J Neurophysiol. 2003;89(5):2360–2369. doi:10.1152/jn.01042.2002
35. Yan W, Laboulaye MA, Tran NM, Whitney IE, Benhar I, Sanes JR. Molecular identification of sixty-three amacrine cell types completes a mouse retinal cell atlas. bioRxiv. 2020. doi:10.1101/2020.03.10.985770
36. Cook PB, McReynolds JS. Lateral inhibition in the inner retina is important for spatial tuning of ganglion cells. Nat Neurosci. 1998;1(8):714–719. doi:10.1038/3714
37. Nirenberg S, Meister M. The light response of retinal ganglion cells is truncated by a displaced amacrine circuit. Neuron. 1997;18(4):637–650. doi:10.1016/S0896-6273(00)80304-9
38. Antonenko D, Schubert F, Bohm F, et al. tDCS-induced modulation of GABA levels and resting-state functional connectivity in older adults. J Neurosci off J Soc Neurosci. 2017;37(15):4065–4073. doi:10.1523/JNEUROSCI.0079-17.2017
39. Das S, Holland P, Frens MA, Donchin O. Impact of transcranial direct current stimulation (tDCS) on neuronal functions. Front Neurosci. 2016;10. doi:10.3389/fnins.2016.00550
40. Podda MV, Cocco S, Mastrodonato A, et al. Anodal transcranial direct current stimulation boosts synaptic plasticity and memory in mice via epigenetic regulation of BDNF expression. Sci Rep. 2016;6(1):22180. doi:10.1038/srep22180
41. Rohan JG, Carhuatanta KA, McInturf SM, Miklasevich MK, Jankord R. Modulating hippocampal plasticity with in vivo brain stimulation. J Neurosci. 2015;35(37):12824–12832. doi:10.1523/JNEUROSCI.2376-15.2015
42. Rosenkranz K, Nitsche MA, Tergau F, Paulus W. Diminution of training-induced transient motor cortex plasticity by weak transcranial direct current stimulation in the human. Neurosci Lett. 2000;296(1):61–63. doi:10.1016/S0304-3940(00)01621-9
43. Liebetanz D, Nitsche MA, Tergau F, Paulus W. Pharmacological approach to the mechanisms of transcranial DC-stimulation-induced after-effects of human motor cortex excitability. Brain J Neurol. 2002;125(Pt 10):2238–2247. doi:10.1093/brain/awf238
44. Fritsch B, Reis J, Martinowich K, et al. Direct current stimulation promotes BDNF-dependent synaptic plasticity: potential implications for motor learning. Neuron. 2010;66(2):198–204. doi:10.1016/j.neuron.2010.03.035
45. Yu T-H, Wu Y-J, Chien M-E, Hsu K-S. Transcranial direct current stimulation induces hippocampal metaplasticity mediated by brain-derived neurotrophic factor. Neuropharmacology. 2019;144:358–367. doi:10.1016/j.neuropharm.2018.11.012
46. Kabakov AY, Muller PA, Pascual-Leone A, Jensen FE, Rotenberg A. Contribution of axonal orientation to pathway-dependent modulation of excitatory transmission by direct current stimulation in isolated rat hippocampus. J Neurophysiol. 2012;107(7):1881–1889. doi:10.1152/jn.00715.2011
47. Pall ML. Electromagnetic fields act via activation of voltage-gated calcium channels to produce beneficial or adverse effects. J Cell Mol Med. 2013;17(8):958–965. doi:10.1111/jcmm.12088
48. Caporale N, Dan Y. Spike timing–dependent plasticity: a Hebbian learning rule. Annu Rev Neurosci. 2008;31(1):25–46. doi:10.1146/annurev.neuro.31.060407.125639
49. Obleser J, Kayser C. Neural entrainment and attentional selection in the listening brain. Trends Cogn Sci. 2019;23(11):913–926. doi:10.1016/j.tics.2019.08.004
50. Chow AY, Chow VY. Subretinal electrical stimulation of the rabbit retina. Neurosci Lett. 1997;225(1):13–16. doi:10.1016/s0304-3940(97)00185-7
51. Margalit E, Maia M, Weiland JD, et al. Retinal prosthesis for the blind. Surv Ophthalmol. 2002;47(4):335–356. doi:10.1016/s0039-6257(02)00311-9
52. Yin H, Yin H, Zhang W, et al. Transcorneal electrical stimulation promotes survival of retinal ganglion cells after optic nerve transection in rats accompanied by reduced microglial activation and TNF-α expression. Brain Res. 2016;1650:10–20. doi:10.1016/j.brainres.2016.08.034
53. Henrich-Noack P, Voigt N, Prilloff S, Fedorov A, Sabel BA. Transcorneal electrical stimulation alters morphology and survival of retinal ganglion cells after optic nerve damage. Neurosci Lett. 2013;543:1–6. doi:10.1016/j.neulet.2013.03.013
54. Tagami Y, Kurimoto T, Miyoshi T, Morimoto T, Sawai H, Mimura O. Axonal regeneration induced by repetitive electrical stimulation of crushed optic nerve in adult rats. Jpn J Ophthalmol. 2009;53(3):257–266. doi:10.1007/s10384-009-0657-8
55. McCaig CD, Rajnicek AM. Electrical fields, nerve growth and nerve regeneration. Exp Physiol. 1991;76(4):473–494. doi:10.1113/expphysiol.1991.sp003514
56. Ciavatta VT, Mocko JA, Kim MK, Pardue MT. Subretinal electrical stimulation preserves inner retinal function in RCS rat retina. Mol Vis. 2013;19:995–1005.
57. Hanif AM, Kim MK, Thomas JG, et al. Whole-eye electrical stimulation therapy preserves visual function and structure in P23H-1 rats. Exp Eye Res. 2016;149:75–83. doi:10.1016/j.exer.2016.06.010
58. Mocko JA, Kim M, Faulkner AE, Cao Y, Ciavatta VT, Pardue MT. Effects of subretinal electrical stimulation in Mer-KO mice. Invest Ophthalmol Vis Sci. 2011;52(7):4223–4230. doi:10.1167/iovs.10-6750
59. Pardue MT, Allen RS. Neuroprotective strategies for retinal disease. Prog Retin Eye Res. 2018;65:50–76. doi:10.1016/j.preteyeres.2018.02.002
60. Kimura A, Namekata K, Guo X, Harada C, Harada T. Neuroprotection, growth factors and BDNF-TrkB signalling in retinal degeneration. Int J Mol Sci. 2016;17:9. doi:10.3390/ijms17091584
61. Osborne A, Khatib TZ, Songra L, et al. Neuroprotection of retinal ganglion cells by a novel gene therapy construct that achieves sustained enhancement of brain-derived neurotrophic factor/tropomyosin-related kinase receptor-B signaling. Cell Death Dis. 2018;9(10):1–18. doi:10.1038/s41419-018-1041-8
 © 2021 The Author(s). This work is published and licensed by Dove Medical Press Limited. The
full terms of this license are available at https://www.dovepress.com/terms
and incorporate the Creative Commons Attribution
- Non Commercial (unported, 3.0) License.
By accessing the work you hereby accept the Terms. Non-commercial uses of the work are permitted
without any further permission from Dove Medical Press Limited, provided the work is properly
attributed. For permission for commercial use of this work, please see paragraphs 4.2 and 5 of our Terms.
© 2021 The Author(s). This work is published and licensed by Dove Medical Press Limited. The
full terms of this license are available at https://www.dovepress.com/terms
and incorporate the Creative Commons Attribution
- Non Commercial (unported, 3.0) License.
By accessing the work you hereby accept the Terms. Non-commercial uses of the work are permitted
without any further permission from Dove Medical Press Limited, provided the work is properly
attributed. For permission for commercial use of this work, please see paragraphs 4.2 and 5 of our Terms.