")
Back to Journals » Eye and Brain » Volume 14
Effects of tACS-Like Electrical Stimulation on Correlated Firing of Retinal Ganglion Cells: Part III
Received 28 March 2021
Accepted for publication 30 November 2021
Published 12 January 2022 Volume 2022:14 Pages 1—15
DOI https://doi.org/10.2147/EB.S313161
Checked for plagiarism Yes
Review by Single anonymous peer review
Peer reviewer comments 3
Editor who approved publication: Professor Margaret Wong-Riley
Franklin R Amthor, Christianne E Strang
Department of Psychology, The University of Alabama at Birmingham, Birmingham, AL, 35294, USA
Correspondence: Franklin R Amthor
Department of Psychology, The University of Alabama at Birmingham, 1300 University Blvd, Birmingham, AL, 35294-1170, USA
Tel/Fax +1 205 934-2694
Email [email protected]
Purpose: Transcranial alternating current stimulation (tACS) is a stimulation protocol used for learning enhancement and mitigation of cognitive dysfunction. Correlated firing has been postulated to be a meta-code that links neuronal spike responses associated with a single entity and may be an important component of high-level cognitive functions. Thus, changes in the covariance firing structure of CNS neurons such as retinal ganglion cells are one potential mechanism by which tACS can exert its effects.
Materials and Methods: We used microelectrode arrays to record light-evoked spike responses of 24 retinal ganglion cells in 7 rabbit eyecup preparations and analyzed the covariance between 30 pairs of neighboring retinal ganglion cells before, during, and after 10-minute application of alternating currents of 1 microampere at 10 or 20 Hz.
Results: tACS stimulation significantly changed the covariance structure of correlated firing in 60% of simultaneously recorded retinal ganglion cells. Application of tACS in the retinal preparation increased cross-covariance in 26% of cell pairs, an effect usually associated with increased light-evoked ganglion cell firing. tACS associated decreases in cross-covariance occurred in 37% of cell pairs. Increased covariance was more common in response to the first, 10-minute application of tACS in isolated retina preparation. Changes in covariance were rare after repeated stimulation, and more likely to result in decreased covariance.
Conclusion: Retinal ganglion cell correlated firing is modulated by 1 microampere tACS currents showing that electrical stimulation can significantly and persistently change the structure of the correlated firing of simultaneously recorded rabbit retinal ganglion cells.
Keywords: retina, tACS mechanisms, CNS, in vitro model, neural coding, neuromodulation, correlated firing, cross covariance
Introduction
External electrical brain stimulation has been used in many human studies for learning enhancement1,2 and mitigation of cognitive dysfunction3 with little knowledge of the mechanism of its effects. The four main electrical brain stimulation protocols, transcranial direct current stimulation (tDCS), transcranial alternating current stimulation (tACS), transcranial pulsed current stimulation (tPCS) and transcranial random noise stimulation (tRNS), use surface electrodes that deliver 1–2 milliamperes currents that are thought to sculpt ongoing neural activity.4,5
An important aspect of sculpting neural activity by electrical stimulation is the possible modulation of correlated firing. Correlated firing has been postulated to be a firing rate-independent tag that might link or bind attributes of specific objects represented in widespread areas of the brain. For example, in auditory cortex, auditory-responsive neurons coordinate the relative time of their action potentials via a spike rate-independent code to signal the presence of certain stimulus attributes.6 The mechanism by which correlated firing may work has been postulated to be that post-synaptic neurons are particularly responsive to coincident spikes in their input.7–9 Synchronous firing may also induce neuroplasticity via coincidence detection by NMDA receptors.10
Thus, the electrical stimulation used in many human interventions may engender plasticity by changing the covariance firing structure of stimulated neurons. Electrical stimulation of the retina that enhances or decreases synchronous firing would be expected to induce similar effects as those postulated for elsewhere in the CNS. In normal retina, there appear to be mechanisms that suppress correlated firing between ganglion cells so that such firing can signal properties of the stimulus, such as whether it is an extended single object, particularly if moving.11
In this study, we report the effects of tACS electrical stimulation on correlated firing in the isolated rabbit retina preparation using methods similar to those we reported for tDCS stimulation.12 The experiments were done with sinusoidal alternating current of 1 microampere, near the threshold for observable effects on retinal ganglion cells as determined in preliminary studies.
Materials and Methods
Stimulation and recording methods were the same as those used in our companion tACS paper13 and are reported in brief below. Analysis methods were based on and extended from our previous studies.12,13
Animals
All animals were maintained in accordance with the National Institute of Health Guide for the Care and Use of Laboratory Animals (NIH Publications No. 80–23, revised 1996), and the Global Statement on the Use of Animals in Research (Federation of European Neuroscience Societies, Japan Neuroscience Society, International Brain Research Organization, and Society for Neuroscience). All experimental procedures were approved by The University of Alabama at Birmingham (UAB) Institutional Animal Care and Use Committee. UAB is accredited by the American Association for Accreditation of Laboratory Animal Care.
Retina Preparation
Methods were based on those used by Strang et al.12 Male and female New Zealand albino rabbits (1.6 to 4.2 kg) were dark adapted and anesthetized after which the eyes were enucleated in dim red light and the animal euthanized. Each eye was hemisected and the resulting eyecup containing was everted onto a dome, superfused with heated (35–38°C) bicarbonate-buffered Ames medium (about 3.5 mL/min).
Ganglion Cell Recordings
Extracellular multi-electrode array recordings12–14 were made from just below the visual streak in the central and mid-peripheral inferior retina. The electrode separation in most arrays was about 200 micrometers which allowed testing the effects of tACS current on a number of ganglion cells simultaneously, particularly, changes in correlated firing. Extracellularly recorded signals of spiking ganglion cells were amplified conventionally. Measurement Computing data acquisition boards (USB-1608 and USB-201, Measurement Computing Corp., Norton, MA) were used for analogue to digital conversion for storage and offline analysis.
Spikes were extracted from the analog recordings by thresholding template convolved traces using programs, then integrated, graphed, and analyzed in MATLAB (MathWorks, Natick, MA). Light-evoked ganglion cell activity (average spikes/sec) was defined as previously described.12,13 This study reports only complete data runs where spike height and stability were maintained throughout the experiment.
Light Stimuli
Light stimuli generated by 3 mm white LEDs (Adafruit P3819A) in a 7×7 array (total extent 30×30 mm) were projected through a focal length 30 mm lens above the retina and centered with respect to the recording electrodes. The stimulus configurations used to generate retinal responses from the array were: (1) the central single LED, (2) the central 9 LEDs, (3) the central 25 LEDs, (4) all LEDs, and (5) the annular ring of outer LEDs. Each stimulus sequence consisted of a 1000 msec period of baseline spiking activity, 1000 msec with the LED(s) on, and 1000 msec after LED illumination, for the off period.12,13 Stimuli presentation, experimental sequence, and data acquisition were controlled by an Arduino Mega microcontroller.
Alternating Current Application
We used the same recording and electrical stimulus configurations as in our previous studies.12,13 One microampere phase-locked sinusoidal tACS currents were generated by a sinusoidal function generator (Instek GFG-8219A) through a current limiting resistor and continuously monitored by an in-line digital multimeter (Neotek) in micro-ammeter mode. Alternating current frequencies of 10, 20, 30 or 40 Hz were used as a probe to see if the effects were frequency dependent. Because we did not see any strong frequency dependence, most data were collected at 10 Hz, a frequency used in a previous human visual system study.15
Ganglion Cell Classification
Given that there are over 30 ganglion cell classes16 in mammalian retina, the limited number of stimuli, and the fact that the LED array was centered only on the middle electrodes in the microelectrode array, it was not possible to assign unambiguously each recorded ganglion cell to a particular known final class from the light-evoked responses of the cells. For example, the smallest spots for cells recorded with microelectrodes near the edge of the array were not centered on some concentric cell’s receptive fields and could have activated surround components.
Data Processing
The analog recordings of ganglion cell responses were digitized at 4 kHz with 12-bit resolution and processed in MATLAB as described above to extract spikes. The responses to all stimuli were plotted as rasters and peri-stimulus time histograms (PST; 20 msec bin). For each condition (before tACS current, during tACS, post-tACS), 20–30 epochs of baseline, light on, light off were acquired. The mean and standard deviation of these 20 msec bins of responses during 18–30 trials was calculated and exported from MATLAB. We also computed average PST firing profiles for all pre-tACS, during tACS, and post-tACS stimuli.
Firing Covariance
Cross-covariance functions were computed for the two spike trains in a manner similar to those used previously by ourselves11 and others in retina.17–21 The cross-covariance function was firing rate normalized using the shift-predictor or shuffle-corrected method (https://www.med.upenn.edu/mulab/crosscorrelation.html). This method subtracts the average cross-covariance between any single recording of two cells, and all the other non-simultaneous repetitions of the stimulus from that obtained during the simultaneous recording, thus normalizing for the cross-covariance expected from the stimulus driven firing rate change in the two cells.
We used shuffle-corrected covariance bins of one msec, with two different delay intervals: −200 to 200 milliseconds, and −50 to 50 milliseconds. The longer interval was used to check whether the 10 Hz stimulating current produced a driven correlation at a delay near 100 msec, while the shorter interval gave better resolution near the zero-delay peak, where most changes occurred.
Statistical Analysis
Data were imported into GraphPad Prism 9 to assess the overall and bin by bin statistical differences in cross-correlations between conditions. Two-way ANOVAs (Alpha was set at 0.05 for significance) were used to compare statistical differences between pre-, during-, and post-epochs for each data run (GraphPad Prism 9, La Jolla, Ca), followed by Tukey’s multiple comparison of simple row effects analyzed bin by bin (20 msec). The P-values for post hoc multiple comparison tests were adjusted to limit the familywise error rate to 0.05. Main factor effects, interaction effects, and F-values are reported in the figure legends. Significant row effects are denoted by square symbols above a bin. A single symbol indicates multiplicity adjusted p-values between the plots at the p < 0.05 level. Double height symbols above a bin denote significant differences between the plots at the p < 0.005 level, triple height symbols denote significant differences at the p < 0.0005 level. The statistical analysis for significance of individual cross-covariance bins was two-sided.
Results
Full data sets were obtained from 24 retinal ganglion cells in 7 rabbit eyecup preparations. These data sets were used to analyze the covariance structure between 30 pairs of neighboring retinal ganglion cells before, during, and after 10-minute application of alternating currents of 1 microampere at 10 or 20 Hz. tACS stimulation significantly changed the covariance structure of correlated firing in 60% of simultaneously recorded retinal ganglion cells.
Cross-covariance is a common technique that is used to determine the relationship between two series of events, such as correlations in firing between two neighboring ganglion cells seen in high measures of cross covariance. Retinal ganglion cell covariance is thought to contribute to information flow to the visual cortex.17,22–24
We show here the results from eight complete data runs (baseline, during, and after current application) from multi-electrode array recordings obtained from a variety of classes of retinal ganglion cells. The results are reported mostly from data from the first tACS application in each retina. Changes in covariance were rare after repeated stimulation, but always decreased in those cases. Most of the data were collected with the tACS frequency of 10 Hz, with a smaller number of recordings collected at 20 Hz.
As reported in companion papers,12,13 electrical stimulation of the retina can result in increases in light-evoked firing without directly inducing significant firing in a variety of ganglion cell classes. In this analysis, tACS-associated increases in normalized peaks of the cross-covariance functions (23% of cell-pairs) were always associated with tACS-induced increases in light-evoked firing. In other ganglion cell pairs, tACS resulted decreases in cross-covariance function peaks (37% of cell-pairs) that did not directly relate to changes in light-evoked responses. However, we found no cell pairs for which tACS-induced decreases in the light-evoked firing were associated with increased cross-covariance.
tACS-Associated Increases in Cross Covariance
Figure 1 shows peri-stimulus time (PST) responses (Figure 1A and C) and cross-covariance functions (Figure 1B and D) for two retinal ganglion cells recorded in the first tACS application in that retina. The top panels Figure 1A and B show these for a small spot (Cs2), while the bottom panels for a large spot (Cs4). The PST plots in Figure 1A show that the On-response firing rate of one of the two cells (green) goes up markedly during the tACS stimulation (Stim) compared to pre-tACS (base), while that of the other cell (magenta) is minimally affected. The bottom plot in Figure 1A shows that post-tACS the firing rate of both cells returns to near baseline. Note that there is little firing during the tACS epoch (Stim) outside the time when the light driven responses occur, thus indicating that tACS at one microampere does not drive firing in either of the two ganglion cells directly but sculpts the light-driven responses.
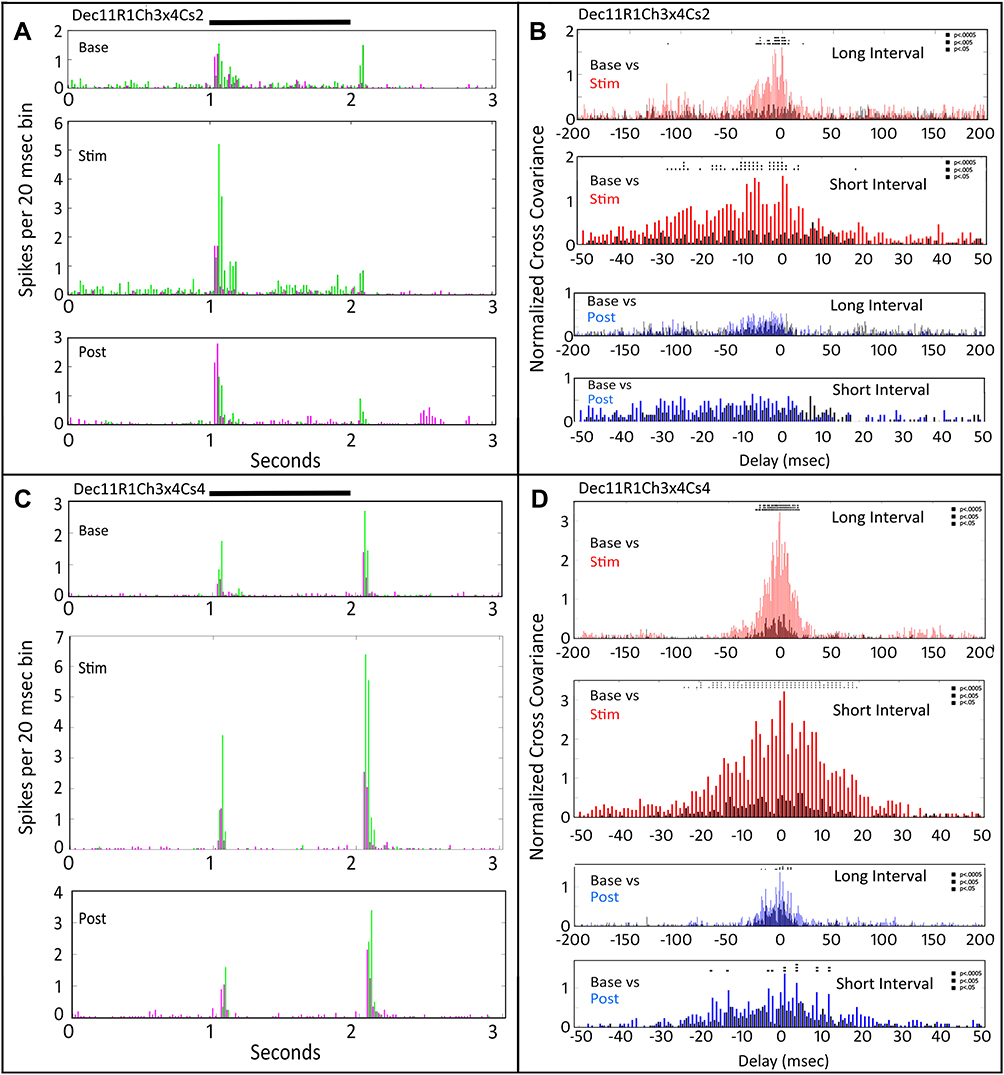 |
Figure 1 Peri-stimulus time responses and cross-covariance functions for two retinal ganglion cells recorded in the first tACS application in that retina. PSTH of each cells’ responses denoted by green (Ch4) and magenta (Ch2). (A) Dec11R1Ch3x4Cs2. Peri-stimulus time responses to a small spot (Cs2) during the pre-stimulus base period (top), during tACS current (middle), and after tACS cessation (bottom). Black bar at top indicates timing of stimulus presentation. (B) Normalized cross-covariance functions for the two cell responses in (A). The top plot compares the normalized cross-covariance during the base period in black, and the tACS (stim) period in red, for relative delays between the two cells from −200 to +200 msec. Below that the data are plotted at higher resolution from −50 to +50 msec. Below that are two plots as above showing the normalized cross-covariance comparing the base with the post-tACS period (blue). Two-way ANOVA p=0.05. Interaction, F (800, 22,857) = 0.7765, NS; Row Factor (20ms bin), F (800, 22,857) = 0.7765, p<0.0001. Column Factor (pre-during-post), F (400, 22,857) = 2.227, p<0.0001. Square symbols above a bin denote significant differences in the multiplicity adjusted p-values between the plots at the p<0.05 level. Double height symbols above a bin denote significant differences between the plots at the p<0.005 level, triple height symbols denote significant differences at the p<0.0005 level. (C) Dec11R1Ch3x4Cs4. Same layout as (A) for the same two cells, but for a large spot stimulus (Cs4). (D) same layout as (B), but for a large spot stimulus. Two-way ANOVA p=0.05. Interaction, F (800, 22,857) = 2.137, p<0.0001; Row Factor, F (400, 22,857) = 7.433, p<0.0001; Column Factor, F (2, 22,857) = 146.1, p<0.0001. Square symbols above a bin denote significant differences in the multiplicity adjusted p-values between the plots at the p<0.05 level. Double height symbols above a bin denote significant differences between the plots at the p<0.005 level, triple height symbols denote significant differences at the p<0.0005 level. |
The two right panels of Figure 1 show the normalized cross-covariance functions for the small spot (Figure 1B) and large spot (Figure 1D), respectively. In Figure 1B, the upper two panels compare the baseline (black) cross-covariation function with that of that obtained during tACS (red). The top plot, from −200 to 200 msec, shows a large increase in correlated firing (normalized for firing rate increase, see the Methods section) centered on zero delay. There is a small increase in correlated firing near −100 msec, indicating that firing in one cell of the pair is correlated with firing in the other one at about the time of the next 10 Hz tACS cycle. Interestingly, this cross-covariation is not symmetrical in that there is no increase at +100 msec relative delay. The second panel from the top in Figure 1B shows the same cross-covariance structure as the panel above it, but at higher resolution for delays from −50 to +50 msec.
The bottom two panels in Figure 1B compare the cross-covariation functions during baseline (black) with that of post-tACS (blue). Post-tACS, the evoked firing returns to near baseline, and so does the cross-covariance profile, although in most bins near zero the post-tACS cross-covariance function (blue) exceeds that from baseline (black). Statistical comparisons of the baseline versus stimulation cross-covariance profiles (Figure 1B, top two panels) indicate that many bins are significantly different at the 0.05, 0.005 and 0.0005 level. However, there are no statistically significantly different cross-covariance bins between baseline and post-tACS at the p < 0.05 level in the bottom two plots in Figure 1B.
Figure 1C shows the pre-tACS (Base), during tACS (Stim) and post-tACS (Post) PST histograms for the same two cells for stimulation with a large spot (Cs4, see METHODS), recorded in the same R1 data run. The large spot evokes a relatively larger increase in the Off response of the cell in channel 4 (green), although the On response is enhanced also. The cross-covariance functions in Figure 1D show a larger increase in the cross-covariance peak during tACS (red) than for the smaller spot in Figure 1B. There is also no suggestion of an increase in cross-covariance near ± 100 msec, as there was for the small spot. Post-tACS (bottom two plots, black vs blue) the cross-covariation function returns to near baseline, although most post-tACS bins (blue) are slightly elevated compared to baseline (black), and several bins are statistically different at p < 0.05 levels and below.
Although the small (Cs2) spot primarily elevates the On responses, while the large (Cs4) spot elevates the Off responses, both result in increased normalized cross-covariance near zero delay. This means that the new spikes in one or both cells tend to occur at the same time as spikes in the other cell, independent (that is, normalized for) of the overall changes in firing rate. Post-tACS, the cross-covariation function for the small spot is indistinguishable from baseline, whereas that of the large spot remains slightly elevated. Thus, tACS application produced transient changes in cross-covariance profiles during application, but, after cessation of tACS, only the large spot evoked a statistically significant increase in normalized cross-covariance that persisted.
Stimulation of the same two cells with an annulus (Figure 2) shows a similar large enhancement of the Off response, like the large spot (Figure 1). The cross-covariance function during tACS (red, Figure 2B) is not, however, nearly as elevated as that for the large spot in Figure 1D. Despite this, nearly all normalized cross-covariance bins within ±20 msec of zero delay are statistically elevated during tACS. The post-tACS cross-covariance functions (bottom plot, Figure 1B, black versus blue) are only slightly elevated from baseline. The PST histograms (Figure 2A, bottom plot) return to near baseline levels. There remains, however, statistical elevation of post-tACS bins within ±20 msec of zero (blue versus black) above baseline, even at the p < 0.0005 level.
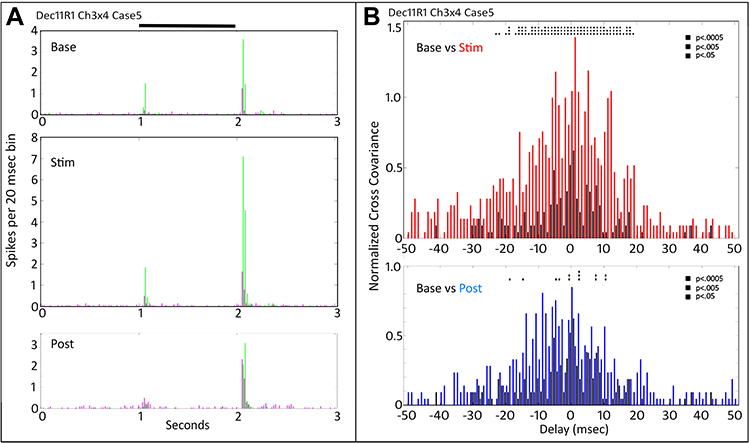 |
Figure 2 Peri-stimulus time histograms (A) and normalized cross-covariance functions (B) for the same two cells as Figure 1 (Dec11R1Ch3x4) for stimulation with an annulus (Cs5). (A) Most of the firing increase during tACS (Stim) occurs in the Off response of one cell (Ch4, green), associated with modest increases in the short term normalized cross covariation function (B). After tACS (Post) the On response of both cells falls to near zero. The Off response of the Ch4 cell (green) returns to near pre-tACS levels (Base), while the Off response of the Ch3 cell (magenta) remains slightly elevated above baseline. Black bar at top indicates timing of stimulus presentation. (B) The normalized post-tACS cross-covariance function (bottom panel) is reduced compared to that during tACS. Two-way ANOVA p=0.05. Interaction, F (800, 22,857) = 0.7856, NS. Row Factor, F (400, 22,857) = 4.393, p<0.0001. Column Factor, F (2, 22,857) = 59.30, p<0.0001. Square symbols above a bin denote significant differences in the multiplicity adjusted p-values between the plots at the p<0.05 level. Double height symbols above a bin denote significant differences between the plots at the p<0.005 level, triple height symbols denote significant differences at the p<0.0005 level. |
Increases in cross-covariance values occurred only after the first application of tACS stimulation. As shown in Figure 3, subsequent epochs of tACS stimulation decreased normalized cross-covariance values. Figure 3 shows the PST histograms (Figure 3A) and cross-covariation functions (Figure 3B) for cell pairs in the same retina as in Figures 1 and 2, but in a second tACS run (R2). The tACS frequency was 20 Hz in this run. Here, tACS stimulation decreased the Off-response firing rate of one of the cells (magenta), without affecting the On or Off responses of the other cell (green) significantly. The top plot in Figure 3B shows the normalized cross-covariance profile for the baseline period. The negative delay asymmetry around zero indicates that during the baseline, pre-tACS period spikes in one cell tend to lead those in the other, but not vice versa. The middle plot compares this same baseline cross-covariance profile (black) with that during tACS (red). There is a reduction in the negative delay, asymmetric portion of the cross-covariance profile in which many bins are significantly different. There is also a small increase simultaneously, in the positive delay cross covariation, but no bins are significant. Comparing baseline with post-tACS (bottom plot, Figure 3B), shows a further loss of cross-covariance after cessation of the tACS current, with more bins showing statistical difference compared to baseline than even during tACS.
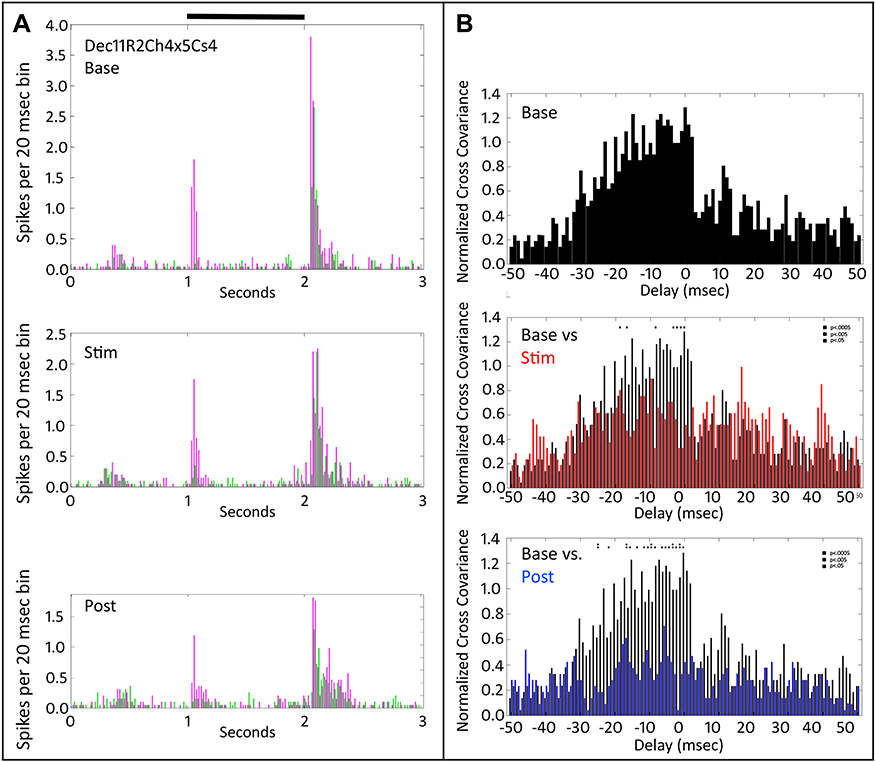 |
Figure 3 Peri-stimulus time histograms and normalized cross-covariance function for two On-Off retinal ganglion cells (Dec11R2Ch4x5Cs4) stimulated with a large spot. The tACS stimulation was at 20 Hz. (A) The top panel shows the average firing of the two cells (magenta vs green) during the pre-tACS base period. The middle panel shows that one of cells (magenta) decreases in firing during tACS (Stim). The bottom panel shows that responses of both cells fall below baseline after cessation of the tACS current. Black bar at top indicates timing of stimulus presentation. (B) The top panel shows the baseline, pre-tACS cross covariance. The middle panel shows normalized cross-covariance functions for base (black) and during tACS (red) for delays from −50 to +50 msec. The bottom panel compare cross-covariance during baseline (black) versus after cessation of tACS current (blue). Two-way ANOVA p=0.05. Interaction, F (800, 22,857) = 0.6358, NS. Row Factor, F (400, 22,857) = 2.088, p<0.0001. Column Factor, F (2, 22,857) = 12.92, p<0.0001. Square symbols above a bin denote significant differences in the multiplicity adjusted p-values between the plots at the p<0.05 level. Double height symbols above a bin denote significant differences between the plots at the p<0.005 level, triple height symbols denote significant differences at the p<0.0005 level. |
tACS Can Eliminate Prior High Cross-Covariance
The high cross-covariance that can occur between nearby retinal ganglion cells22,26,27 can be disrupted by tACS. Figure 4 illustrates one of these cases for two On-sustained retinal ganglion cells. The plots in Figure 4A show the pre-tACS (base), during tACS (Stim) and post-tACS (post) PST histograms. tACS increased the initial transient On response of both cells (middle plot compared to top plot). Post tACS (bottom plot, Figure 4A) the larger initial transient On response persisted.
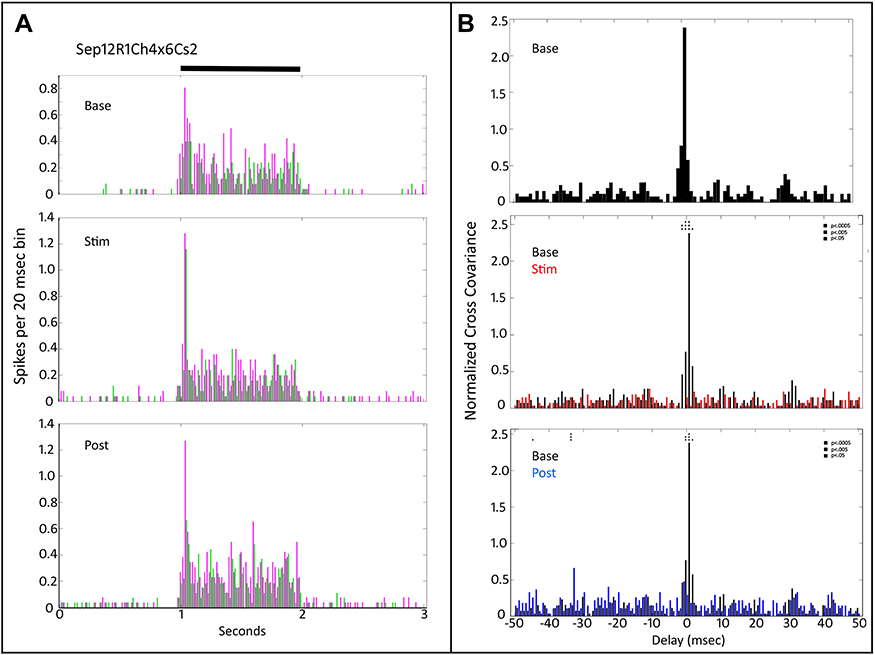 |
Figure 4 Peri-stimulus time histograms and normalized cross-covariance function for two On sustained retinal ganglion cells (Sep12R1Ch4x6) stimulated with a small spot (Cs2). (A) The top panel shows the average firing of the two cells (magenta vs green) during the pre-tACS base period. The middle panel shows that both cells increase in firing during tACS. The bottom panel shows that much of this firing increase persists after cessation of the tACS current. Black bar at top indicates timing of stimulus presentation. (B) The normalized cross-covariance function for delays from −50 to +50 msec in the top panel is for the baseline pre-tACS period. The middle panel compares cross-covariance during baseline (black) versus during tACS (red). The bottom panel compares baseline cross-covariance to that after cessation of tACS current (blue). Two-way ANOVA p=0.05. Interaction, F (800, 29,674) = 1.102, p=0.0244. Row Factor, F (400, 29,674) = 1.374, p<0.0001, Column Factor, F (2, 29,674) = 48.83, p<0.0001. Square symbols above a bin denote significant differences in the multiplicity adjusted p-values between the plots at the p<0.05 level. Double height symbols above a bin denote significant differences between the plots at the p<0.005 level, triple height symbols denote significant differences at the p<0.0005 level. |
In the cross-covariance plots in Figure 4B, there is a significant peak near zero delay in the baseline condition (top plot). During tACS (middle plot, black baseline versus red during tACS), although the firing rate increased, the large cross-variation peak near zero delay was virtually obliterated. Post-tACS this effect persisted. Thus, even though the firing rate of one of the ganglion cells was increased during tACS, the tendency to fire at the same time as the other ganglion cells that existed prior to tACS was eliminated, and this persisted after cessation of tACS current.
We also observed cases (40% of cell pairs) where the first application of tACS had little effect on cross-covariance, despite elevating light-evoked firing rate, as shown in Figure 5. Here, the top panel in Figure 5A shows the baseline, pre-tACS PST histograms for one of the Sustained-On cells shown in Figure 4 with an On transient retinal ganglion cell. The middle plot, during tACS (Stim) shows that the transient component of the On response was elevated during tACS. However, the bottom plot of the cross-covariation profile comparing baseline (black) to during tACS (red) in Figure 5B shows only a slight elevation of cross-covariation values. A few delay bins near zero are statistically significant. Post-tACS (not shown), both PST firing and cross-covariance profiles returned to near pre-tACS values.
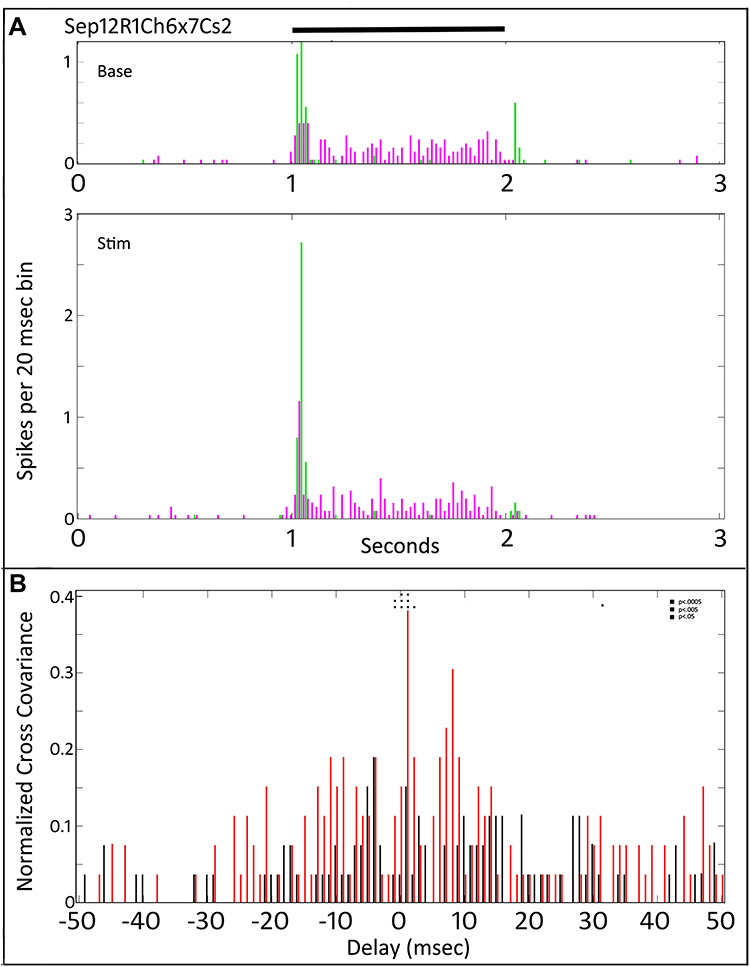 |
Figure 5 Peri-stimulus time histograms and normalized cross-covariance function for one of the Sustained-On cells shown in Figure 4 with an On transient retinal ganglion cell (Sep12R1Ch6x7Cs2). (A) The top panel shows the average firing of the two cells (magenta vs green) during the pre-tACS base period. The middle panel shows that both cells increase in firing during tACS. Black bar at top indicates timing of stimulus presentation. (B) The normalized cross-covariance function for −50 to +50 msec (bottom) shows increases in some bins (red) during tACS, compared to during baseline (black). Two-way ANOVA p=0.05. Interaction, F (800, 29,674) = 1.102, p=0.5984, NS. Row Factor, F (400, 29,674) = 1.284, p<0.0001, Column Factor, F (2, 29,674) = 6.161, p=0.0021. Square symbols above a bin denote significant differences in the multiplicity adjusted p-values between the plots at the p<0.05 level. Double height symbols above a bin denote significant differences between the plots at the p<0.005 level, triple height symbols denote significant differences at the p<0.0005 level. |
tACS Can Asymmetrically Change Cross-Covariance Profiles
Figure 6 shows the PST profiles and cross-covariance plots for two retinal ganglion cells that initially gave On-Off responses to a medium size spot (Cs3). During tACS (Figure 6A, middle plot), both On and Off responses of one cell (magenta) nearly vanished, while the other cell (green) was much less affected. The peak of the normalized cross-covariation function during tACS (Figure 6B middle plot, red) shifted toward more positive values, when spikes in the magenta cell were strongly reduced. Post-tACS (bottom plot, Figure 6B) both positive and negative cross-covariance values decreased, associated with further reduced firing in the first (magenta) cell.
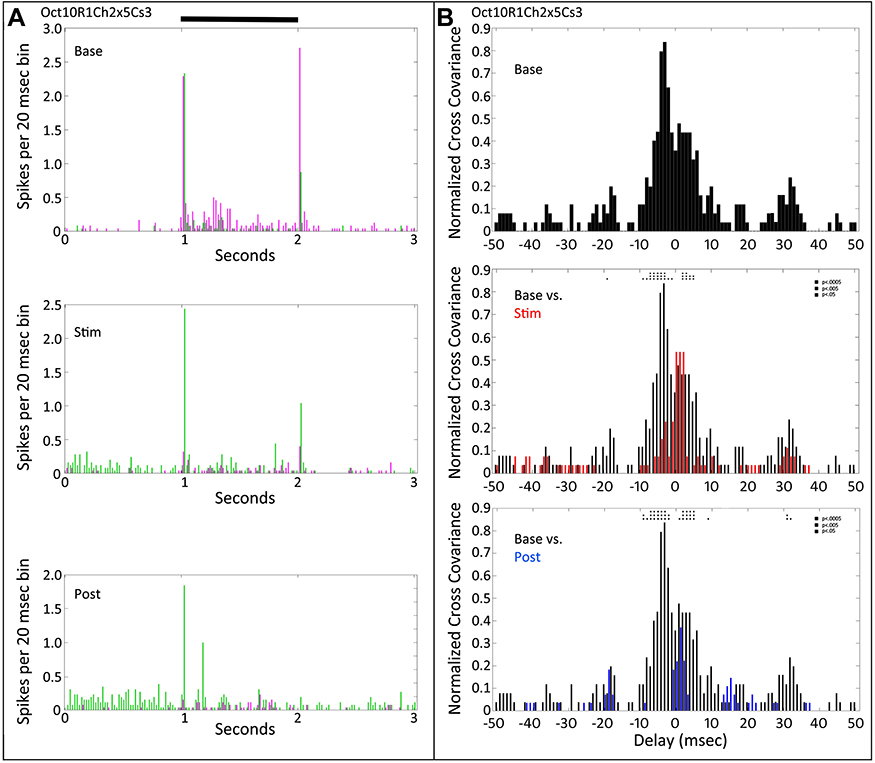 |
Figure 6 Peri-stimulus time histograms and normalized cross-covariance function for two On-Off retinal ganglion cells (Oct10R1Ch2x5Cs3). (A) The top panel shows the average firing of the two cells (magenta vs green) during the pre-tACS base period. The middle panel shows that one of cells (magenta) decreases in firing during tACS. The bottom panel shows that this firing decrease persists after cessation of the tACS current. Black bar at top indicates timing of stimulus presentation. (B) The normalized cross-covariance function for delays from −50 to +50 msec in the top panel is for the baseline pre-tACS period. The middle panel compares cross-covariance during baseline (black) versus during tACS (red). The bottom panel compares baseline cross-covariance (black) to that after cessation of tACS current (blue). Two-way ANOVA p=0.05. Interaction, F (800, 28,872) = 1.078, NS. Row Factor, F (400, 28,872) = 2.878, p<0.0001. Column Factor, F (2, 28,872) = 46.93, p<0.0001. Square symbols above a bin denote significant differences in the multiplicity adjusted p-values between the plots at the p<0.05 level. Double height symbols above a bin denote significant differences between the plots at the p<0.005 level, triple height symbols denote significant differences at the p<0.0005 level. |
tACS Effects on Endogenous Oscillations
Figure 7 shows the PST profiles (Figure 7A) and cross-covariance plots (Figure 7B) for two On-sustained cells that had brief transient Off responses to a large spot (Cs4). The baseline (black) cross-covariance plots (Figure 7B) show oscillatory behavior with a frequency of about 67 Hz. The effect of tACS was to reduce both On and Off transient responses in one of the cells (magenta in the middle plot, Figure 7A). The cross-covariance plots (Figure 7B) show continued oscillations during and after tACS, but at a level reduced to below about half. The reduction in firing and cross-covariance that occurred during tACS persisted afterward, as seen in the bottom two plots in Figure 7B that compare baseline (black) with post-tACS (blue) normalized cross covariance.
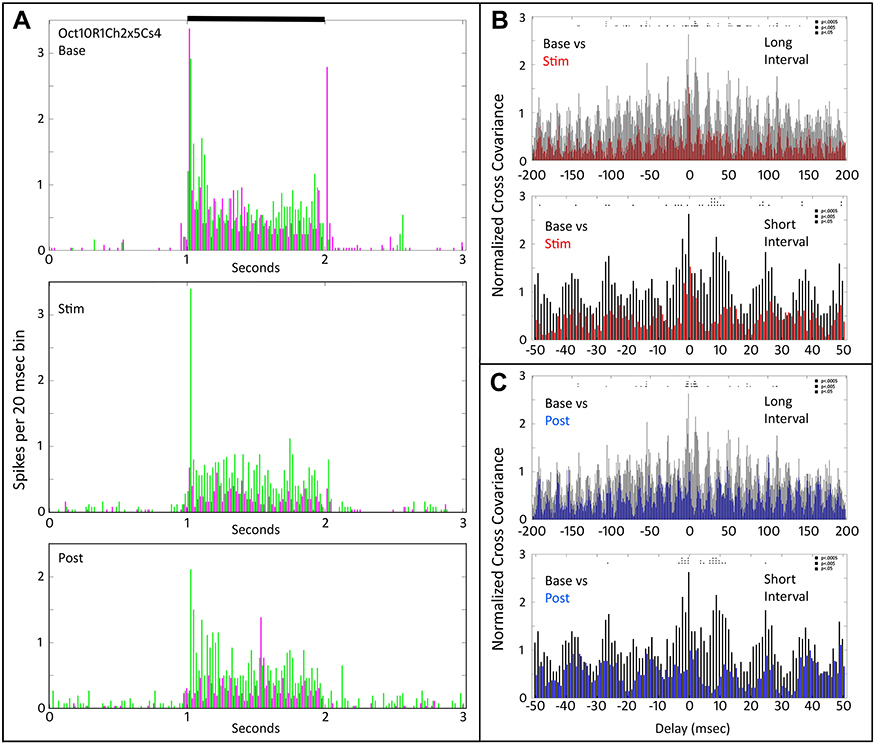 |
Figure 7 Peri-stimulus time histograms and normalized cross-covariance function for two On-Off retinal ganglion cells (Oct10R1Ch2x5Cs4) stimulated with a large spot. (A) The top panel shows the average firing of the two cells (magenta vs green) during the pre-tACS base period. The middle panel shows that one of cells (magenta) decreases in firing during tACS (Stim). The bottom panel shows that responses of both cells fall below baseline after cessation of the tACS current. Black bar at top indicates timing of stimulus presentation. (B) The top two panels show normalized cross-covariance functions for base (black) and during tACS (red) for long (−200 to +200 msec) and short (−50 to +50 msec) delays. (C) The bottom two panels compare cross-covariance during baseline (black) versus after cessation of tACS current (blue), at long and short delay intervals. Two-way ANOVA p=0.05. Interaction, F (800, 28,872) = 0.5657, NS. Row Factor, F (400, 28,872) = 2.359, p<0.0001. Column Factor, F (2, 28,872) = 490.7, p<0.0001. Square symbols above a bin denote significant differences in the multiplicity adjusted p-values between the plots at the p<0.05 level. Double height symbols above a bin denote significant differences between the plots at the p<0.005 level, triple height symbols denote significant differences at the p<0.0005 level. |
tACS Effects Beginning After Cessation
Figure 8 shows the PST and cross-covariance plots for two On-Off retinal ganglion cells. In Figure 8A, the middle plot shows little change in firing compared to baseline in the top plot. However, at tACS cessation (bottom plot, Figure 8A) the On response of the cell plotted in magenta is strongly reduced, with less effect on that cell’s Off response. Changes in the other cell (green) are much less, indicating that the reduction is not a result of cell rundown. Changes in cross-covariance profiles (Figure 8B) parallel the changes in firing rate. During tACS (Figure 8B, middle plot) the red cross-covariance plot is reduced from that of the baseline (black). Post-tACS, however, a persistent reduction in the firing-rate normalized cross-covariance parallels the drop in firing rate, with many more bins exceeding statistical significance.
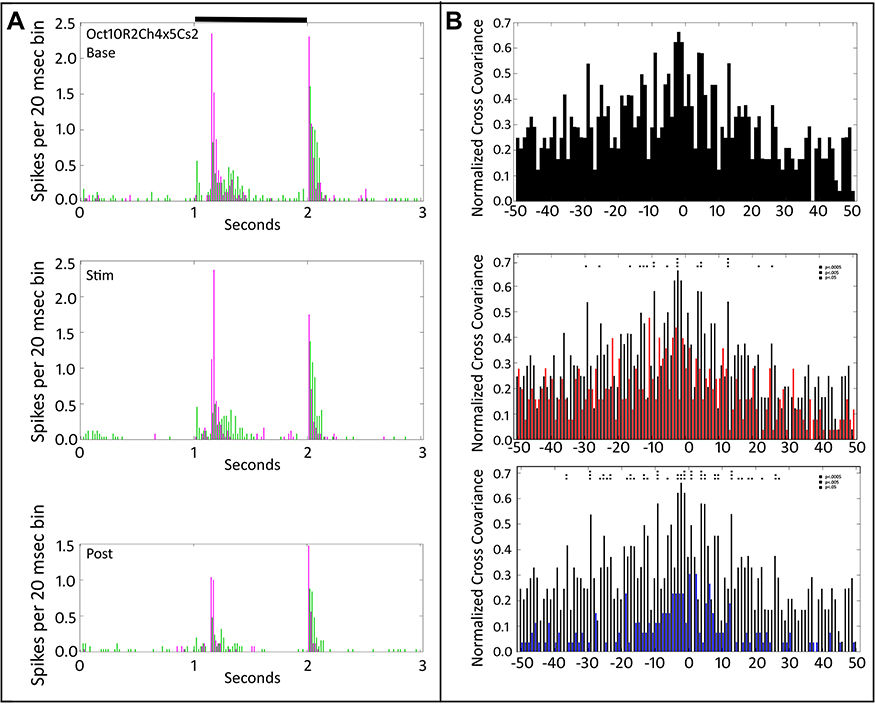 |
Figure 8 Peri-stimulus time histograms and normalized cross-covariance function for two On-Off retinal ganglion cells (Oct10R2Ch4x5Cs2) stimulated with a small spot. (A) The top panel shows the average firing of the two cells (magenta vs green) during the pre-tACS base period. The middle panel shows that one of cells (green) decreases in firing during tACS (Stim). The bottom panel shows that responses of both cells fall below baseline after cessation of the tACS current. (B) The top panel shows the baseline, pre-tACS cross covariance. The middle panel shows normalized cross-covariance functions for base (black) and during tACS (red) for delays from −50 to +50 msec. The bottom panel compares cross-covariance during baseline (black) versus after cessation of tACS current (blue). Two-way ANOVA p=0.05. Interaction, F (800, 27,669) = 0.7117, NS. Row Factor, F (400, 27,669) = 2.285, p<0.0001. Column Factor, F (2, 27,669) = 209.5, p<0.0001. Square symbols above a bin denote significant differences in the multiplicity adjusted p-values between the plots at the p<0.05 level. Double height symbols above a bin denote significant differences between the plots at the p<0.005 level, triple height symbols denote significant differences at the p<0.0005 level. |
Discussion
In this study, we investigated the effects of tACS stimulation on correlated firing among neighboring ganglion cells of the rabbit retina. As has been well described, synchronous and other firing correlations occur endogenously in nearby retinal ganglion cell pairs, and can be stimulus configuration-dependent,22,26,27 as we also observed in this study. tACS stimulation affected both firing rates and cross-covariation of firing between nearby retinal ganglion cells, both during current application, and afterward. High cross-covariance values were more often obtained for cells recorded on adjacent microelectrodes (within 400 micrometers) but could occur for cells separated by as much as one millimeter.
When tACS stimulation increased the firing rates of several cells, the cross-covariation tended to strongly increase. The vast majority of increased cross-covariance occurred around zero delay, indicating a tendency for ganglion cells to fire spikes at about the same millisecond, independent of firing rate (normalized).
Occasionally, there is a significant asymmetric cross-covariance induced at a stimulation frequency of 10 Hz, corresponding to a delay of 100 msec, but this is rare. The asymmetry occurs because when one of the two cells fires a spike, there is a tendency for the other cell to fire a spike 100 msec afterwards, but not vice versa. 100 msec is the period of the 10 Hz stimulation frequency so it is a delay corresponding to the next cycle. One way this asymmetry could occur is if a slowly rising, but long-lasting subthreshold excitatory input, such as from an amacrine cell, is activated by the excitatory input to cell1, but projected asymmetrically to cell2. Our data, of course, cannot distinguish between this and other possible retinal circuits that could produce asymmetrical spike correlations.
Thus, endogenous and changes in cross-covariance were typically found in the On or Off responses of both cells, respectively. Most of our sample cells showing endogenous or tACS-enhanced cross-covariance were of the same response type (On or Off, transient or sustained), but the sample is too small to make definitive statements about the frequency of significant cross-covariance between different ganglion cell classes. Our sample that showed covariance or covariance changes included pairs of On-sustained, On-transient, and On-Off cells. We found only weak covariance in Off-transient cells (N=3, not shown), and we had no examples of pairs of Off-sustained retinal ganglion cells.
We observed enhanced normalized cross-covariance almost exclusively in the first tACS application in that retinal preparation. Subsequent, ten-minute applications in the same retina rarely strongly increased firing rate or cross-covariation, although the profile of cross-covariation could still be decreased by these later tACS applications. When tACS stimulation strongly increased ganglion cell firing, upon cessation of the current, the firing tended to return to near baseline.
tACS stimulation reduced prior strong cross-covariance in 37% of cell pairs. Reduction of cross-covariance was larger after cessation of tACS stimulation than during the current for a subset of these cells. tACS stimulation also typically changed the covariance profile even when the overall firing and cross-covariance levels were not strongly modified. In cases where endogenous oscillations were observed in pairs of retinal ganglion cells, the oscillations were preserved, but reduced, during and after tACS. Retinal ganglion cell covariance,22 endogenous retinal oscillations induced by light step stimuli or flashes23,24 and synchronized firing, or entrainment24,25 are all thought to convey aspects of visual information to the visual cortex.
The fact that tACS strongly changes the cross-covariance firing profiles of retinal ganglion cells brings about two major questions: (1) by what mechanism does this happen, and (2) what are the likely downstream effects of these firing covariance changes?
Mechanisms of Correlated Firing
This study did not directly address what mechanisms mediate correlated firing in retinal ganglion cells, nor how tACS changes the cross-covariance profile. However, it is clear from the data that increases in correlated firing caused by tACS are not caused by it directly driving ganglion cell firing at one microampere. There was little change in firing outside periods when light-evoked responses occurred. Also, changes in the cross-covariance structure typically last for hours after cessation of the current. In addition, the first ten-minute application of tACS in any retinal preparation was almost always the most effective in changing cross-covariance profiles. tACS stimulation only marginally produced increases in cross-covariance in a few cells at delays of 100 msec corresponding to the 10 Hz frequency. One possible mechanism is via tACS effects that balance between excitatory and inhibitory inputs to ganglion cells. Increases in firing and cross-correlation would result from greater activation of excitatory inputs. Our small sample of cell pairs tested at 20 Hz suggested that 20 Hz currents may shift the balance toward greater activation of inhibitory inputs. One could speculate that such a shift could occur due to fatigue in excitatory neurotransmitter release or by the preferential activation of inhibitory pathways.
The tACS effects we observed are consistent with hypotheses that it affects neurotransmitter levels, such as by activating voltage-gated calcium channels and increasing neurotransmitter release. Alternatively, tACS-induced increases in firing and cross-covariance could be due to loss of an inhibitory input that normally reduces the common input to nearby retinal ganglion cells that would otherwise cause correlated firing. tACS-induced reduction of correlated firing could be associated with excitatory neurotransmitter depletion in cells that had common input to several retinal ganglion cells. Further studies will clearly be needed to shed light on this.
Oscillations
tACS-induced increases in correlated firing do not appear to depend on either endogenous or induced retinal oscillations. Oscillation-dependent cross-covariance functions would appear as a central positive peak, flanked by symmetrical negative covariance regions, and repeats at either the endogenous or stimulation period. When endogenous oscillations were observed in cell pairs, tACS stimulation shifted the level of cross-covariation as though through an additive mechanism. tACS stimulation only rarely produces increases in cross-covariance at the 10 Hz stimulation frequency.
Implications for Central Visual Processing
Stimulation of the retina with low levels of alternating current may result either directly, as with proposed retinal prostheses, or indirectly, as a by-product current of electrical brain stimulation that passes through the retina.22 In either case, changes in ganglion cross-covariance may induce plastic changes upstream of the retina. Synchronous firing is hypothesized to drive upstream neurons more efficiently than asynchronous firing28 and may activate plasticity mechanisms such as mediated by the NMDA receptor,29,30 which requires coincident input to remove the magnesium channel block.
How might increases in correlated firing change brain function? Specifically, tACS may have effects during application, and after application. During application, tACS has been shown to enhance phonemic processing in humans when applied at gamma frequencies31 in subjects in which endogenous, presumably functional gamma oscillations were subnormal. tACS may thus promote information processing by increasing the gain of some processes. On the other hand, during tACS, the temporal resolution of visual perception appears to be reduced.15 By phase-locking firing, tACS may reduce the efficiency of processes such as stochastic resonance, where noise can overcome nonlinearities in processing mechanisms.32
Effects post-tACS depend on assumptions about the mechanism of its action. If tACS activates voltage-dependent calcium channels such that levels of neurotransmitter release are enhanced, those changes would be expected to end at the cessation of current application. However, if the neurotransmitter was depleted, the effects should not normally last for hours. On the other hand, upstream plasticity effects produced by correlated firing could be longer lasting, and specific to the stimuli that were active when tACS was applied. By analogy, for example, what is the difference in the effect on the visual system and brain from watching a somewhat blurred movie presentation on a small screen, versus one viewed on IMAX. One would expect greater activity in at least some parts of the visual system in the latter case versus the former, but hypothesizing what these effects would be is purely speculative.
tACS versus Other Brain Stimulation Protocols
It is not known in any adequate detail how any of the electrical brain stimulation protocols (tDCS, tACS, tPCS or tRNS) produce effects in humans in which they are being used. tACS, like other protocols, has had mixed success in producing intended effects in human studies.33–36 tACS has additional parameters compared to tDCS of frequency and phase, and the potential interaction between the tACS frequency and ongoing EEG rhythms has been noted in the above-mentioned studies, and others.37,38
Conclusions
The retina, like the cortex, has multiple layers and a wide variety of cell types that integrate complex excitatory and inhibitory inputs. The retina also retains the ability to respond to natural stimuli for hours in vitro. The data presented here combined with that presented in our other papers12,13 probing the effects of electrical stimulation on light-evoked ganglion cell responses support the argument that the retina is a very strong model for identifying potential mechanisms involved in tACS effects in the rest of the CNS. Further, tACS stimulation in the retina may be a useful tool for studying CNS effects because post-tACS modulation of visual processing can be quantitatively probed in intact animals and humans. It is remarkable that ten minutes of tACS stimulation at one microampere in the retina produces changes in cell firing, and correlated firing, lasting for hours. Future studies are needed to address both the mechanisms of action and upstream effects of these brain stimulation protocols.
Acknowledgments
This work was supported by the VSRC core (UAB Vision Science Research Center, grant P30 EY003039). The content is solely the responsibility of the authors and does not necessarily represent the official views of the National Institutes of Health (NIH).
Author Contributions
Both authors made substantial contributions to conception and design, acquisition of data, or analysis and interpretation of data; took part in drafting the article or revising it critically for important intellectual content; agreed to submit it to the current journal; gave final approval for the version to be published; and agreed to be accountable for all aspects of the work.
Disclosure
The authors report no conflicts of interest in this work.
References
1. Esmaeilpour Z, Schestatsky P, Bikson M, et Al. Notes on Human Trials of Transcranial Direct Current Stimulation between 1960 and 1998. Front Hum Neurosci. 2017;11:71. doi:10.3389/fnhum.2017.00071
2. Hashemirad F, Zoghi M, Fitzgerald P, Jaberzadeh S. The effect of anodal transcranial direct current stimulation on motor sequence learning in healthy individuals: a systematic review and meta-analysis. Brain Cogn. 2016;102:1–12. doi:10.1016/j.bandc.2015.11.005
3. Kekic M, Boysen E, Campbell IC, Schmidt U. A systematic review of the clinical efficacy of transcranial direct current stimulation (tDCS) in psychiatric disorders. J Psychiatr Res. 2016;74:70–86. doi:10.1016/j.jpsychires.2015.12.018
4. Anastassiou CA, Montgomery SM, Barahona M, Buzsáki G, Koch C. The effect of spatially inhomogeneous extracellular electric fields on neurons. J Neurosci. 2010;30(5):1925–1936. doi:10.1523/JNEUROSCI.3635-09.2010
5. Creutzfeldt OD, Fromm GH, Kapp H. Influence of transcortical d-c currents on cortical neuronal activity. Exp Neurol. 1962;5:436–452. doi:10.1016/0014-4886(62)90056-0
6. deCharms RC, Merzenich MM. Primary cortical representation of sounds by the coordination of action-potential timing. Nature. 1996;381(6583):610–613. doi:10.1038/381610a0
7. Dan Y, Alonso JM, Usrey WM, Reid RC. Coding of visual information by precisely correlated spikes in the lateral geniculate nucleus. Nat Neurosci. 1998;1(6):501–507. doi:10.1038/2217
8. Singer W, Engel AK, Kreiter AK, Munk MHJ, Neuenschwander S, Roelfsema PR. Neuronal assemblies: necessity, signature and detectability. Trends Cogn Sci. 1997;1(7):252–261. doi:10.1016/S1364-6613(97)01079-6
9. Softky W, Koch C. The highly irregular firing of cortical cells is inconsistent with temporal integration of random EPSPs. J Neurosci. 1993;13(1):334–350. doi:10.1523/JNEUROSCI.13-01-00334.1993
10. Tabone CJ, Ramaswami M. Is NMDA receptor-coincidence detection required for learning and memory? Neuron. 2012;74(5):767–769. doi:10.1016/j.neuron.2012.05.008
11. Amthor FR, Tootle JS, Grzywacz NM. Stimulus-dependent correlated firing in directionally selective retinal ganglion cells. Vis Neurosci. 2005;22(6):769–787. doi:10.1017/S0952523805226081
12. Strang CE, Ray MK, Boggiano MM, Amthor FR. Effects of tDCS-like electrical stimulation on retinal ganglion cells. Eye Brain. 2018;10:65. doi:10.2147/EB.S163914
13. Amthor FR, Strang CE. Effects of tACS-like electrical stimulation on on-center retinal ganglion cells: part I. Eye Brain. 2021;13:175–192. doi:10.2147/EB.S312402
14. Amthor FR, Tootle JS, Yildirim A. A new transparent multi-unit recording array system fabricated by in-house laboratory technology. J Neurosci Methods. 2003;126(2):209–219. doi:10.1016/S0165-0270(03)00094-3
15. Battaglini L, Mena F, Ghiani A, Casco C, Melcher D, Ronconi L. The Effect of Alpha tACS on the Temporal Resolution of Visual Perception. Front Psychol. 2020;11:11. doi:10.3389/fpsyg.2020.01765
16. Sanes JR, Masland RH. The types of retinal ganglion cells: current status and implications for neuronal classification. Annu Rev Neurosci. 2015;38:221–246. doi:10.1146/annurev-neuro-071714-034120
17. Aertsen AM, Gerstein GL, Habib MK, Palm G. Dynamics of neuronal firing correlation: modulation of “effective connectivity”. J Neurophysiol. 1989;61(5):900–917. doi:10.1152/jn.1989.61.5.900
18. Arnett D, Spraker TE. Cross-correlation analysis of the maintained discharge of rabbit retinal ganglion cells. J Physiol. 1981;317:29–47. doi:10.1113/jphysiol.1981.sp013812
19. Grzywacz NM, Sernagor E. Spontaneous activity in developing turtle retinal ganglion cells: statistical analysis. Vis Neurosci. 2000;17(2):229–241. doi:10.1017/S0952523800172050
20. Mastronarde DN. Correlated firing of cat retinal ganglion cells. II. Responses of X- and Y-cells to single quantal events. J Neurophysiol. 1983;49(2):325–349. doi:10.1152/jn.1983.49.2.325
21. Meister M, Lagnado L, Baylor DA. Concerted Signaling by Retinal Ganglion Cells. Science. 1995;270(5239):1207–1210. doi:10.1126/science.270.5239.1207
22. Kakarwal S, Deshmukh R. Analysis of retina recognition by correlation and covariance matrix.
23. Koepsell K, Wang X, Hirsch J, Sommer F. Exploring the function of neural oscillations in early sensory systems. Front Neurosci. 2010;3:10. doi:10.3389/neuro.01.010.2010
24. Koepsell K, Wang X, Vaingankar V, et al. Retinal oscillations carry visual information to cortex. Front Syst Neurosci. 2009;3:4. doi:10.3389/neuro.06.004.2009
25. Obleser J, Kayser C. Neural entrainment and attentional selection in the listening brain. Trends Cogn Sci. 2019;23(11):913–926. doi:10.1016/j.tics.2019.08.004
26. Levine MW. Models for the cross-correlation between retinal ganglion cells. Biol Cybern. 1998;79(5):367–376. doi:10.1007/s004220050486
27. Petrig BL, Elsner AE, VanNasdale DA, Haggerty BP, Zhao Y, Burns SA. Detection of retinal disease by cross-correlation of different imaging modes. Invest Ophthalmol Vis Sci. 2008;49(13):5395.
28. Salinas E, Sejnowski TJ. CORRELATED NEURONAL ACTIVITY AND THE FLOW OF NEURAL INFORMATION. Nat Rev Neurosci. 2001;2(8):539–550. doi:10.1038/35086012
29. Mizuno H, Rao MS, Mizuno H, Sato T, Nakazawa S, Iwasato T. NMDA Receptor Enhances Correlation of Spontaneous Activity in Neonatal Barrel Cortex. J Neurosci. 2021;41(6):1207–1217. doi:10.1523/JNEUROSCI.0527-20.2020
30. Molina LA, Skelin I, Gruber AJ. Acute NMDA receptor antagonism disrupts synchronization of action potential firing in rat prefrontal cortex. PLoS One. 2014;9(1):e85842. doi:10.1371/journal.pone.0085842
31. Marchesotti S, Nicolle J, Merlet I, Arnal LH, Donoghue JP, Giraud A-L. Selective enhancement of low-gamma activity by tACS improves phonemic processing and reading accuracy in dyslexia. PLOS Biol. 2020;18(9):e3000833. doi:10.1371/journal.pbio.3000833
32. Harmer G, Davis B, Abbott D. A review of stochastic resonance: circuits and measurement. IEEE Trans Ins Measur. 2002;51(2):299–309. doi:10.1109/19.997828
33. Bland NS, Mattingley JB, Sale MV. No Evidence for Phase-Specific Effects of 40 Hz HD–tACS on Multiple Object Tracking. Front Psychol. 2018;9. doi:10.3389/fpsyg.2018.00304
34. Ergo K, Loof ED, Debra G, Pastötter B, Verguts T. Failure to modulate reward prediction errors in declarative learning with theta (6 Hz) frequency transcranial alternating current stimulation. PLoS One. 2020;15(12):e0237829. doi:10.1371/journal.pone.0237829
35. Vieira PG, Krause MR, Pack CC. tACS entrains neural activity while somatosensory input is blocked. PLOS Biol. 2020;18(10):e3000834. doi:10.1371/journal.pbio.3000834
36. Wolinski N, Cooper NR, Sauseng P, Romei V. The speed of parietal theta frequency drives visuospatial working memory capacity. PLOS Biol. 2018;16(3):e2005348. doi:10.1371/journal.pbio.2005348
37. Santarnecchi E, Sprugnoli G, Bricolo E, et al. Gamma tACS over the temporal lobe increases the occurrence of Eureka! Sci Rep. 2019;9(1):5778. doi:10.1038/s41598-019-42192-z
38. Tavakoli AV, Yun K. Transcranial Alternating Current Stimulation (tACS) Mechanisms and Protocols. Front Cell Neurosci. 2017;11:11. doi:10.3389/fncel.2017.00214
 © 2022 The Author(s). This work is published and licensed by Dove Medical Press Limited. The full terms of this license are available at https://www.dovepress.com/terms.php and incorporate the Creative Commons Attribution - Non Commercial (unported, v3.0) License.
By accessing the work you hereby accept the Terms. Non-commercial uses of the work are permitted without any further permission from Dove Medical Press Limited, provided the work is properly attributed. For permission for commercial use of this work, please see paragraphs 4.2 and 5 of our Terms.
© 2022 The Author(s). This work is published and licensed by Dove Medical Press Limited. The full terms of this license are available at https://www.dovepress.com/terms.php and incorporate the Creative Commons Attribution - Non Commercial (unported, v3.0) License.
By accessing the work you hereby accept the Terms. Non-commercial uses of the work are permitted without any further permission from Dove Medical Press Limited, provided the work is properly attributed. For permission for commercial use of this work, please see paragraphs 4.2 and 5 of our Terms.