Back to Journals » International Journal of Nanomedicine » Volume 13
Effects of PEG surface density and chain length on the pharmacokinetics and biodistribution of methotrexate-loaded chitosan nanoparticles
Authors Ait Bachir Z, Huang Y, He M, Huang L, Hou X, Chen R ![]() , Gao F
, Gao F ![]()
Received 6 March 2018
Accepted for publication 28 June 2018
Published 24 September 2018 Volume 2018:13 Pages 5657—5671
DOI https://doi.org/10.2147/IJN.S167443
Checked for plagiarism Yes
Review by Single anonymous peer review
Peer reviewer comments 3
Editor who approved publication: Professor Lei Yang
Zaina Ait Bachir,1,* YuKun Huang,1,* MuYe He,1 Lei Huang,1 XinYu Hou,1 RongJun Chen,2 Feng Gao1,3,4
1Shanghai Key Laboratory of Functional Materials Chemistry, East China University of Science and Technology, Shanghai, People’s Republic of China; 2Department of Chemical Engineering, Imperial College London, South Kensington Campus, London, UK; 3Department of Pharmaceutics, School of Pharmacy, East China University of Science and Technology, Shanghai, People’s Republic of China; 4China Shanghai Key Laboratory of New Drug Design, East China University of Science and Technology, Shanghai, People’s Republic of China
*These authors contributed equally to this work
Background: One of the most important aspects of drug delivery is extended nanoparticle (NP) residence time in vivo. Herein, we report a series of methotrexate (MTX)-loaded chitosan (CS) NPs coated with differently sized methoxy polyethylene glycol (mPEG) at different mPEG surface densities.
Materials and methods: MTX was incorporated into NPs (112.8–171.2 nm in diameter) prepared from the resulting mPEG-g-CS. The NPs had a zeta potential of +7.4–35.0 mV and MTX loading efficiency of 17.1%–18.4%. MTX/mPEG-g-CS NPs showed an initial burst release of MTX followed by a sustained-release profile in PBS at pH 7.4.
Results: The in vitro cellular uptake study showed that MTX accumulation in J774A.1 macrophage cells decreased with increasing the mPEG surface density or the mPEG molecular weight. The pharmacokinetic study on Sprague Dawley rats revealed an increase in AUC0–72 h (area under the plasma drug concentration–time curve over a period of 72 hours) with increasing the mPEG surface density or the mPEG molecular weight and a linear correlation between the mPEG surface density and AUC0–72 h.
Conclusion: The biodistribution study on Institute of Cancer Research (ICR) mice revealed that MTX/mPEG-g-CS NPs significantly enhanced blood circulation time in the body and decreased accumulation in liver, spleen, and lung. These results suggest the potential of the mPEG-g-CS NPs as a promising candidate for drug delivery.
Keywords: chitosan, PEGylation, nanoparticles, methotrexate, drug delivery systems
Introduction
Chitosan (CS) has been widely used in pharmaceutical and medical areas due to its favorable biological properties, including biodegradability, biocompatibility, and low toxicity, as well as low production costs.1 CS nanoparticles (NPs) have been shown to be promising carriers for delivery of not only poorly water-soluble drugs2–4 but also water-soluble proteins5,6 and genes.7,8
One of the most important aspects of NP drug delivery is prolonged blood circulation time and favorable biodistribution, ensuring enough time to reach the target tissue. Plasma proteins can bind circulating NPs and cause them to be rapidly eliminated by the reticuloendothelial system (RES). Extensive research has been carried out on PEGylation of biomolecules to improve their water solubility and prolong blood circulation time to escape the phagocytosis of macrophages and avoid RES clearance.9–11
Several strategies have reported the chemical conjugation of mPEG with CS through C2-amino group or C6-hydroxyl group.12–14 The PEG-g-CS copolymers (with different molecular weight [MW] or substitution degree of the mPEG graft) were used in a different application for a drug delivery system. For example, Zhang et al15 succeeded to conserve the structure of the protein and control its release from the PEG-g-CS NPs, and Fu et al16 proved that self-assembled micelle mPEG-g-CS prepared with 3.23%±0.25% mPEG substitution degree can be a promising carrier with controlled particle size and controlled-release effect of 5-fluorouracil for effective antitumor activity. Prego et al17 studied the intestinal absorption ability of the model peptide salmon calcitonin loaded in NPs prepared with two different mPEG substitution degrees (0.5% and 1%). It was found that these nanocapsules could be used as carriers for oral peptide delivery. The study of Chan et al18 illustrates that folate-poly(ethylene glycol)-grafted CS NP prepared with a different degree of substitutions did not affect the ability of the DNA binding, and the water solubility of the CS increased with mPEG grafting degree. Another study carried out with different PEG surface density 43% and 75% of PEG Mn =2,000 and PEG Mn =5,000, respectively, shows that the longer PEG chain and the greater degree of substitution lead to faster drug release from PEG graft CS NPs.19 Recently, another research illustrated the impact of PEGylation on the properties of CS/siRNA-based polyplexes. Different MWs of mPEG (2, 5, and 10 kDa) were conjugated to CS, and it was found that PEG with higher MW and less grafting density is a promising strategy to improve CS/siRNA NP performance both in vitro and in vivo.20 It was also proved by Chen et al21 that methotrexate (MTX)-loaded mPEG (2000 Da)-conjugated CS NPs could enhance their targeting ability and prolong blood circulation even better than folic acid (FA), a targeting ligand for nanocarriers.21
MTX {(2S)–2-[[4-[(2,4-diaminopteridin-6-yl)-methyl-ethylamino]benzoyl]amino] pentanedioic acid)} is a stoichiometric inhibitor of dihydrofolate reductase.22 MTX has a low permeability (C logP =0.53) and poor aqueous solubility (lower than 1 mg/mL at 19°C); it is insoluble in water, ethanol, chloroform, and ether, but soluble in dilute solutions of alkaline hydroxides and carbonates.21,23 MTX is one of the most widely used drugs in the treatment of acute lymphocytic leukemia, osteosarcoma, non-Hodgkin’s lymphomas, choriocarcinoma Hodgkin’s disease, head and neck cancer, lung cancer, and breast cancer.24–28 Several studies have prepared and characterized MTX loaded in CS NP, and it was found that MTX-loaded CS NPs have a good stability with high encapsulation efficiency. They showed that CS is one of the good carriers for the anticancer drug MTX.29–32
The present study was aimed to identify the effect of mPEG surface densities and chain lengths on mPEG-g-CS NPs, able to avoid RES elimination and achieve prolonged blood circulation. The synthesized CS derivatives were fully characterized by nuclear magnetic resonance (NMR) and elemental analyses and the substitution degrees were calculated. The resulting mPEG-g-CS copolymers were used to prepare NPs by ionic gelation method using tripolyphosphate (TPP). The NPs loaded with anticancer drug MTX were fully characterized. The encapsulation efficiency and drug loading were determined and the release profile of MTX from the NPs was investigated. The in vitro study and the pharmacokinetic and the biodistribution studies were also performed and studied.
Materials and methods
Reagents
CS (CS, Mw =11 kDa, deacetylation degree >90%) was purchased from Zhejiang Aoxing Ltd. (Zhejiang, People’s Republic of China). Polyethylene glycol monomethyl ether (mPEG, Mw =750, 2,000 and 5,000 Da) was obtained from Sigma Aldrich (St Louis, MO, USA). Succinic anhydride (SA), 4-dimethylaminopyridine, N-hydroxysuccinimide (NHS), and 1-ethyl-3-(3-dimethylaminopropyl) carbodiimide hydrochloride and dichloromethane were obtained from Shanghai Titan Chemical Co (Shanghai, People’s Republic of China). Cellulose ester membranes (dialysis bag) with a MW cut-off value (MWCO =8,000–14,000 Da) (Greenbird Inc., Shanghai, People’s Republic of China) were used in dialysis study. MTX was obtained from Zibo Panxin Pharm & Chemical Co. Ltd. (Zibo, People’s Republic of China). TPP was provided by Shanghai Ling-Feng Chemical Reagents Limited (Shanghai, People’s Republic of China). Roswell Park Memorial Institute 1640 medium and trypsin were purchased from Thermo Fisher Scientific (Gaithersburg, MD, USA). BCA protein assay kit was purchased from Biotechnology Co., Ltd. (Nantong, People’s Republic of China). All chemicals were analytical grade and used directly as received. J774A.1 macrophages cells were purchased from cell bank of Chinese Academy of Sciences (Shanghai, People’s Republic of China).
Animals
Sprague Dawley rats (220±20) g and Institute of Cancer Research (ICR) mice (20±2) g, supplied by Department of Experimental Animals, Fudan University (Shanghai, People’s Republic of China), were acclimated at 25°C and 55% of humidity under natural light/dark conditions for 1 week before the experiment. All animal experiments were carried out in accordance with the guidelines evaluated and approved by the ethics committee of Fudan University.
Synthesis of mPEG-g-CS
According to the previously reported protocols, the mPEG-g-CS conjugates were prepared with slight modifications.33,34 mPEG with specific MW (Mw =750, 2,000 and 5,000 Da) was dissolved in 50 mL dichloromethane, to which an excess of succinic SA and the appropriate amount of organic catalyst 4-dimethylaminopyridine were added (Table S1). The mixture was conducted for 5 hours at reflux of 55°C. After a complete reaction, the solution was cooled and dispersed in a 50 mL saturated NaHCO3 solution. The aqueous phase was extracted twice using 15 mL diethyl ether. The pH of the resulting solution was adjusted to 2 using 2M HCl solution and the oil phase was extracted with CH2Cl2. The combined CH2Cl2 layer was dewatered overnight using anhydrous Na2SO4. The drying agent was removed by filtration, and the liquid was concentrated using a vacuum rotatory evaporator. The viscous liquid was dispersed in 100 mL diethyl ether, filtered, and dried in a vacuum oven for 3 days at 40°C to obtain the PEG-SA powder.
About 0.5 g of CS was dissolved in 75 mL of 20% acetic acid solution (v/v) and its pH was adjusted to 6 using a sodium hydroxide solution. Then, the mPEG-SA, NHS, and EDC (Table S2), were added to the solution. The mixture was stirred at room temperature for 24 hours, using a dialysis bag (MWCO =8,000–14,000 Da); the resulting solution was dialyzed against deionized water for 48 hours. Then, the dialyzed solution was filtrated and lyophilized. The freeze-dried product was washed with anhydrous ethanol to eliminate the unreacted mPEG, filtrated, and dried in a vacuum oven to get mPEG-g-CS copolymer.
Characterization of mPEG-g-CS
The samples (mPEG, mPEG-SA, CS, and mPEG-g-CS) were dissolved in D2O and their 1H-NMR spectra were recorded on a 400 MHz NMR spectrometer (Bruker Avance, Rheinstetten, Germany) with a single pulse program. The degree of substitution (DS) of mPEG on CS can be determined according to spectra.
The elemental analysis was also carried out using a Vario EL III elemental analyzer (Elemental Analyzer System GmbH, Langenselbold, Germany) to determine the DS of mPEG on CS.
Preparation of MTX-loaded mPEG-g-CS NPs
mPEG-g-CS NPs were prepared via simple ionic gelation method using TPP as a cross-linking agent, and MTX was used as a model of an anticancer drug.35 Briefly, aqueous solutions of PEG-g-CS containing different sized mPEG (mPEG750, mPEG2000 or mPEG5000) were prepared at pH 4.5 at a final concentration of 1 mg/mL. MTX was dissolved in TPP aqueous solution at a final concentration of 1 mg/mL and dropped into 5 mL mPEG-g-CS aqueous solution under magnetic stirring. The solution was continually stirred for 30 minutes to form the MTX-loaded mPEG-g-CS NPs.
Characterization of the NPs
The mean particle diameter, polydispersity index, and the zeta potential of the CS and mPEG-g-CS NPs were measured using a dynamic light scattering platform (NanoZS4700 Nano-series, Malvern Instruments, Malvern, UK).
Transmission electron microscopy (TEM) (TECNAI G2 F20, FEI, Hillsboro, OR, USA) was used to observe the morphology of MTX-loaded NPs; the samples were stained with 2% (w/v) sodium phosphotungstic solution, which was dropped on a copper grid for observation.
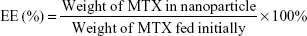
The MTX loaded in CS and mPEG-g-CS NPs were determined using the high-performance liquid chromatography (HPLC) system containing a Phenomenex Gemini® C18 column (250×4.6 mm, 5 μm) (Phenomenex Inc., Torrance, CA, USA). The mobile phase consisted of methanol and 25 mM sodium phosphate monobasic buffer at pH 5.5 (20:80, v/v) and was pumped at a flow rate of 1.0 mL/min. The injection volume was 20 μL and the detection wavelength was set at 313 nm. The encapsulation efficiency (EE) and the loading efficiency (LE) of MTX in the CS NPs were calculated according to the equations (1) and (2).
|
|
|
|
In vitro release studies
In vitro release profiles of MTX from the CS NPs or mPEG-g-CS NPs were determined by a dialysis method. Briefly, the lyophilized NPs were dispersed in 1 mL PBS in a dialysis tube (MWCO =14,000 Da). The dialysis tube was immersed in 19 mL PBS (pH =7.4) and the system was shaken at a speed of 100 rpm at 37°C. At specific time intervals, 500 μL of the release medium was withdrawn and then topped up with the equal volume of fresh medium. The amount of released MTX was determined by HPLC at 313 nm.
In vitro cellular uptake
Ability of MTX/CS and MTX/mPEG-CS NPs to escape from the macrophages was investigated in vitro. J774A.1 macrophages cells at a density of 1×10⁵ cells/well were seeded in a 24-well plate and allowed to grow for 24 hours. Then, the spent medium was replaced with fetal bovine serum-free Roswell Park Memorial Institute 1640 medium containing free MTX, MTX/CS, or MTX/mPEG-CS NPs. Untreated cells were just incubated in the medium used as a control. After 4 hours of incubation at 37°C, cells were washed twice with PBS (pH 7.4) and trypsinized by 0.1% trypsin solution. For MTX extraction, 100 μL lysed cells were taken and suspended in 200 μL mobile phase buffer (mobile phase containing methanol and 25 mM sodium phosphate monobasic buffer at pH 5.5 [20:80, v/v]). Then, they were sonicated in an ice bath at 400 W using the JY92-II ultrasonic instrument (Scientz Biotechnology Co., Ltd., Ningbo, People’s Republic of China) and centrifuged at 5,000 rpm for 5 minutes. The supernatant was then analyzed by HPLC using the method described earlier. Using the BCA protein assay kit, the protein content in the sample was determined following a protocol provided by the manufacturer, and the cellular uptake of MTX was normalized with respect to the total protein content.
Pharmacokinetic study
Free MTX and various MTX-loaded NPs respectively, including MTX/CS NP, MTX/mPEG750-g-CS NP (DS =9.1%), MTX/mPEG2000-g-CS NP (DS =4.1%), MTX/mPEG2000-g-CS NP (DS =8.5%), MTX/mPEG2000-g-CS NP (DS =18.2%), MTX/mPEG2000-g-CS NP (DS =40.3%), and MTX/mPEG5000-g-CS NP (DS =8.7%) were administered to Sprague Dawley rats via an intravenous injection through the tail vein at an equivalent dose of 4 mg MTX/kg. At specific time intervals ranging from 0.083 to 72 hours following intravenous injection, the blood was collected and centrifuged at 1,000 rpm for 10 minutes to obtain the plasma. About 160 μL of the supernatant plasma was mixed with 50 μL of internal standard ferulic acid (20 μg/mL in methanol), then 80 μL of 10% trichloroacetic acid was added. The mixture was vortexed for 3 minutes to precipitate the plasma proteins and then centrifuged at 12,000 rpm for 10 minutes at 4°C. The supernatant was withdrawn and 20 μL 1M hydroxide solution was added for further HPLC analysis.
Biodistribution study
To determine the biodistribution of the NPs in various organs, ICR mice were randomly divided into 8 groups. Six animals from each group received an intravenous administration of free MTX, MTX/CS, and various MTX/mPEG-CS NPs through the tail vein at an equivalent MTX dose (4 mg/kg). Twenty-four 48 hours postadministration, animals were euthanized and principal organs such as heart, liver, spleen, lung, and kidney were removed carefully, weighed, and stored at −80°C until their further use. The amounts of MTX in different organs were determined by HPLC using the method described earlier.
Statistical analysis
Multiple group comparisons were conducted using one-way analysis of variance. All data analysis was executed using the SPSS Statistics 17.0 (SPSS Inc., Chicago, IL, USA). All data are presented as a mean value with its SD indicated (mean ± SD). P-values <0.05 were considered to be statistically significant.
Results and discussion
Synthesis and characterization of mPEG-g-CS
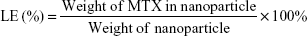
The PEGylated CS was prepared according to the procedure shown in Figure 1. By strictly controlling the feeding amount of mPEG and the other materials (Tables S1 and S2), different mPEG-g-CS conjugates, such as mPEG750-g-CS (DS =9.1%), mPEG2000-g-CS (DS =4.1%, 8.5%, 18.2%, 40.3%), and mPEG5000-g-CS (DS =8.7%), were obtained. As shown in Figure S1, new resonance peaks appearing at 2.56 ppm were assigned to H-8 and H-9, confirming the successful synthesis of the PEG derivative. The 1-hour NMR spectrum of the mPEG-g-CS conjugate exhibited the characteristic peaks of both CS and mPEG (Figure S2), confirming the successful PEGylation of CS; these results were also confirmed by the FITR spectra presented in Figure S3. 1H-NMR and elemental analyses were employed to calculate the DS of mPEG to CS, which is summarized in Table 1.
 | Figure 1 The illustration of mPEG-g-CS synthesis. |
 | Table 1 The DS of mPEG to CS at different feeding ratios |
Preparation and characterization of the NPs
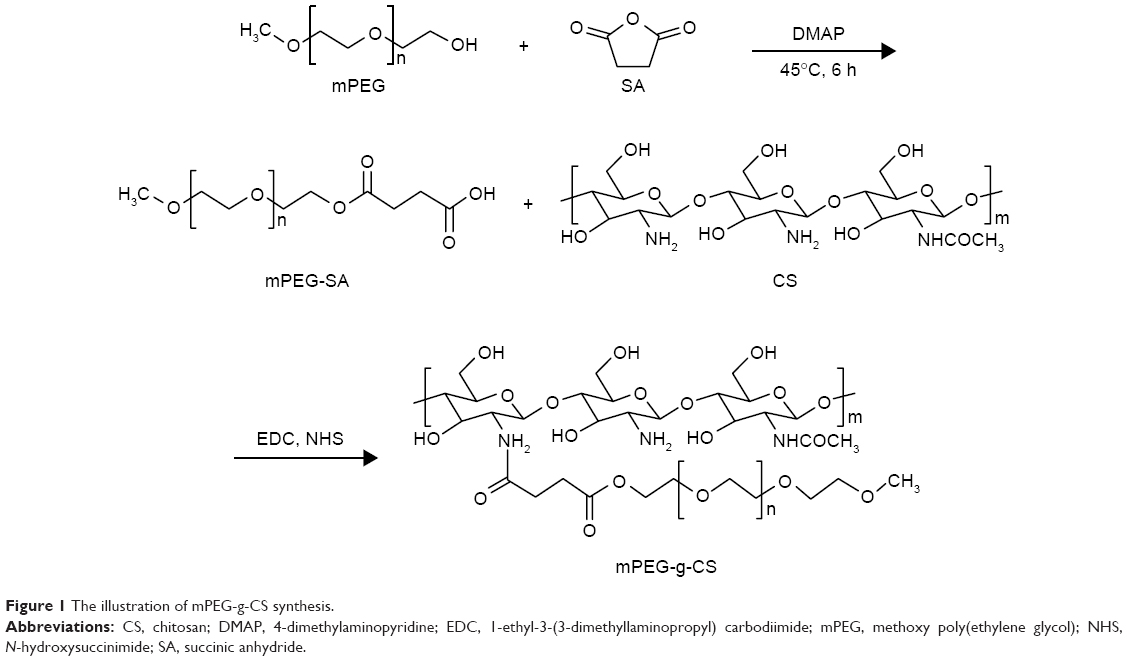
The MTX/mPEG-g-CS NPs were formed using TPP as a cross-linking agent. MTX was used as a model drug; its chemical structure is presented in the Figure S4. Figure 2 reveals that the NPs are monodispersed and spherical in shape with a size of 112.8–171.2 nm diameter and a zeta potential of 7.4–35 mV. As summarized in Table 2, the size of the NPs increased by increasing the MW or the DS of mPEG, and smaller MW of PEG and lower grafting degree resulted in smaller NPs. The increased thickness of the NP surface hydration layer resulted in an increase in the hydrodynamic diameters and a reduction in the zeta potential, confirming the grafting of mPEG to the positive groups of CS. The mPEG graft did not affect the EE% and LE%, which were found to be between 17.1%–18.4% and 84.3%–88.1%, respectively, which was found to be similar to the results of previous studies.21,36,37
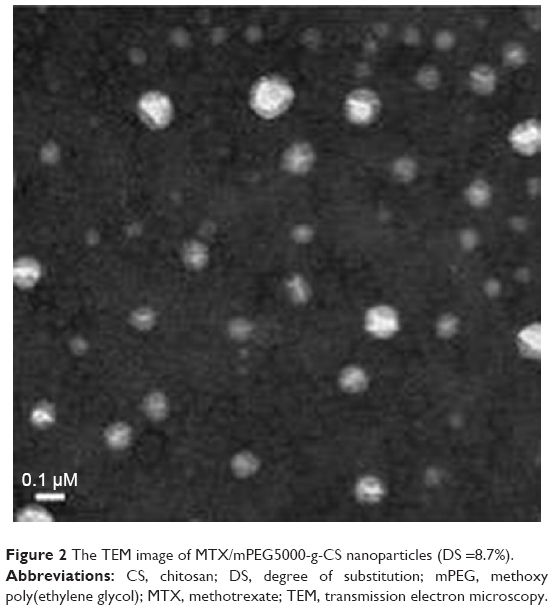 | Figure 2 The TEM image of MTX/mPEG5000-g-CS nanoparticles (DS =8.7%). |
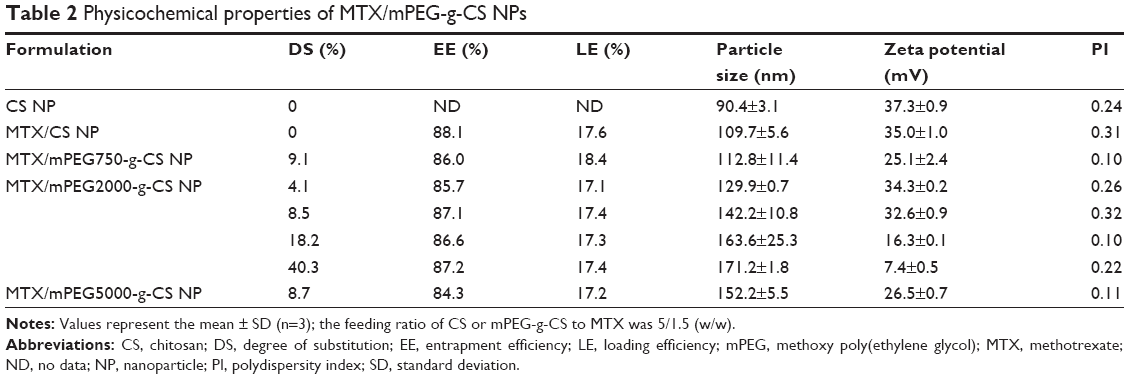 | Table 2 Physicochemical properties of MTX/mPEG-g-CS NPs |
Figure 3 demonstrates that MTX/mPEG2000-g-CS (DS =4.1%) and MTX/mPEG2000-g-CS (DS =8.5%) NPs displayed the best stability compared with MTX/CS NP, and that because the mPEG graft on the CS surface decreases the amount of attraction between the NPs by increasing the steric distance between them, this may hinder mutual aggregation between NPs and improve their stability and their highest surface charge, which can also contribute in improving the formulation stability. MTX/mPEG750-g-CS NP (DS =9.1%), MTX/mPEG2000-g-CS NP (DS =18.2%), and MTX/mPEG2000-g-CS NP (DS =40.3%) NPs show a bad stability after the 10th day, which was observed by the size change of the NPs which may be related to the high DS of mPEG graft and the high binding of the mPEG to the amino group of CS, thus reducing its ability to bind to the negative charge of TPP, thereby reducing the compactness of the NPs and their stability. By comparing the stability between NPs prepared with different MWs of mPEG (Mw =750, 2,000, 5,000) but similar levels of substitution degree, the MTX/mPEG5000-g-CS (DS =8.7%) NP was found to be the most unstable, probably because it had highest MW.38–40 Thus, we can conclude that the smallest DS and the smallest MW of mPEG can improve the stability of the CS. Moreover, this drug delivery carrier has low cytotoxicity due to PEGylation on the surface of the NP, as is seen in Figure S5.
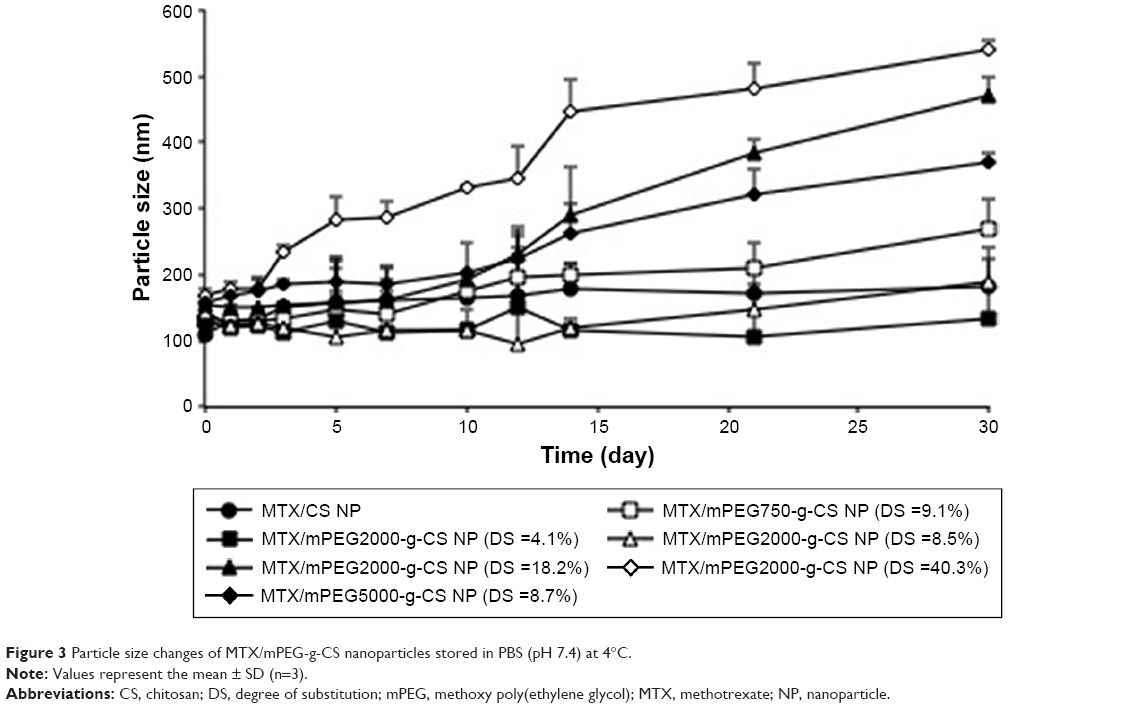 | Figure 3 Particle size changes of MTX/mPEG-g-CS nanoparticles stored in PBS (pH 7.4) at 4°C. |
In vitro drug release of MTX
The in vitro cumulative release of MTX from different MTX/mPEG-g-CS NPs was measured in PBS pH 7.4. Figure 4 shows that the MTX-loaded NPs showed a sustained drug release after the initial fast release. The burst release phase was observed in the first 0.5 hours, and it might be due to the presence of free drug absorbed on the surface of the NPs, which diffused rapidly when the NPs came into contact with the release medium (PBS), as previously reported by Zhang et al.15 But the sustained drug release might be due to drug diffusion through the NP matrix and polymer degradation.41,42 The increase in MW of mPEG or its DS on CS surface causes the increase in cumulative release rate of MTX from NPs; this result seems to be similar to previous report,19 and the reason was attributed to the presence of mPEG substitutes on amino groups which destroy the rigidity of CS and the intra-/intermolecular hydrogen bonding, thus enhancing the hydrophilicity and the solubility of CS in neutral medium (pH 7.4) as well as enhancing the release of the drug.18,43
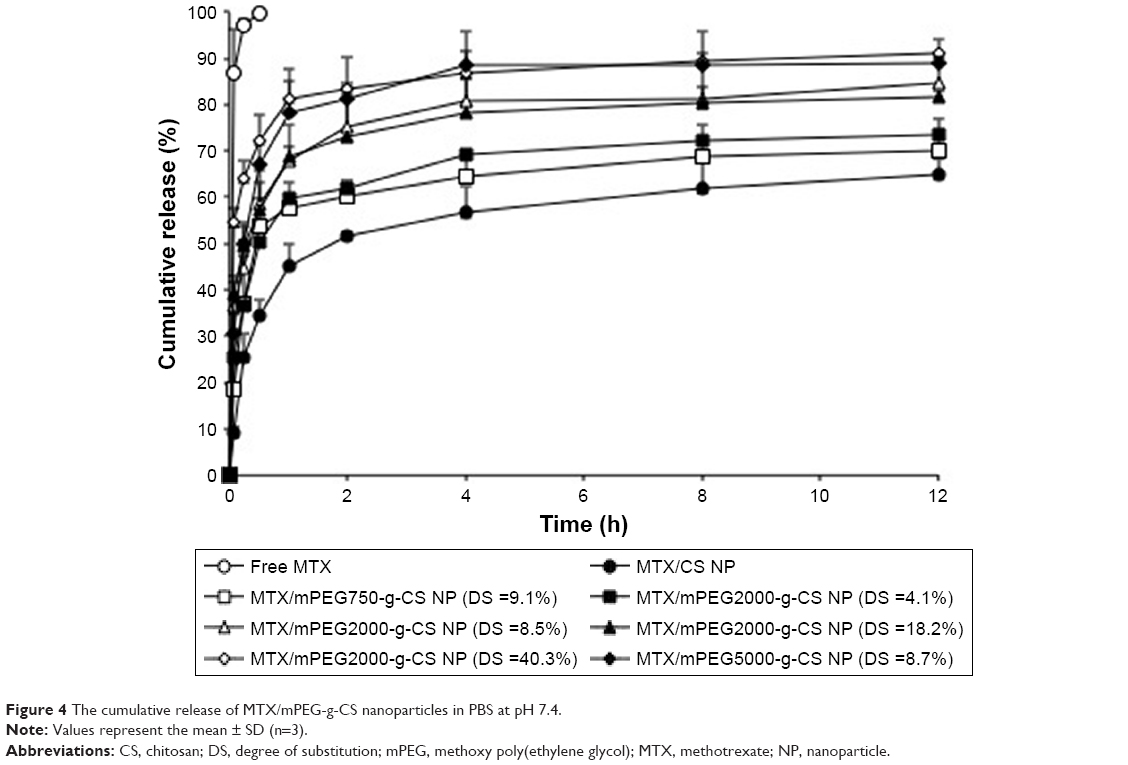 | Figure 4 The cumulative release of MTX/mPEG-g-CS nanoparticles in PBS at pH 7.4. |
Cellular uptake
Figure 5 shows the effect of mPEG on the internalization of the MTX-loaded CS NPs in J774A.1 macrophages cells. The cellular uptake of MTX was enhanced with increasing the incubation time. The internalization efficiency of free MTX and MTX/CS NP by the macrophage cells was higher than the MTX/mPEG-g-CS NPs. The increase in PEG MW or in PEG surface density led to the reduced uptake of the CS NPs by the macrophage cells, indicating that mPEG could facilitate the escape of the NP from the macrophages. Our results are compatible with Zhang et al’s44 study which demonstrated that PEG with long chain length (5,000 Da) could significantly decrease the macrophages uptake of bolaamphiphiles. The in vitro study of Parveen and Sahoo10 also revealed that PEGylated NP had better ability to escape from macrophages than highly positively or negatively charged NPs.
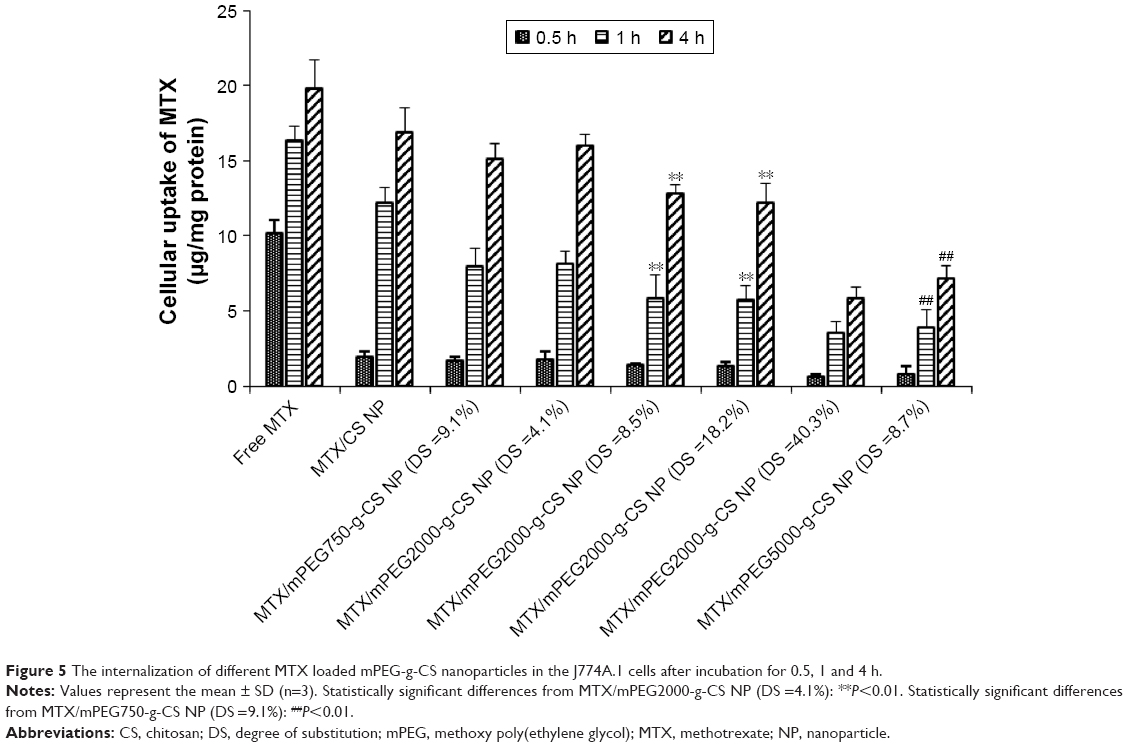 | Figure 5 The internalization of different MTX loaded mPEG-g-CS nanoparticles in the J774A.1 cells after incubation for 0.5, 1 and 4 h. |
Pharmacokinetics
All animal experiments were carried out in accordance with the guidelines evaluated and approved by the ethics committee of Fudan University. The time-dependent MTX concentrations in plasma of free MTX, MTX/CS, and various MTX/mPEG-g-CS NPs in Sprague Dawley rats are shown in Figure 6, and the pharmacokinetic parameters are summarized in Table 3. The results reveal that the enhancement in the PEG surface density (DS=4.1%, 8.5%, 18.2% and 40.3%) or Mw (Mw=750, 2000 and 5000 Da) of MTX/mPEG-g-CS NPs led to an increase in the elimination half-life t1/2β (P<0.01) and the area under the concentration–time curve (AUC) (P<0.01) and a decrease in the clearance rate (CL) (P<0.01) compared to free MTX and the MTX/CS NP, which was due to the benefit of the hydrophilic PEG that could reduce the uptake by the opsonin protein and avoid monocyte and macrophage recognition, thus allowing the NPs to remain in the bloodstream.45,46 As summarized in Table 3, the MTX/mPEG2000-g-CS (DS =40.3%) NP exhibited the largest AUC0→∞ value, 16.0 and 7.7 times higher than free MTX and the MTX/CS NP, respectively, and the lowest CL, 19 and 9 times lower than free MTX and the MTX/CS NP, respectively; these results are consistent with the observations of several other studies.46,47
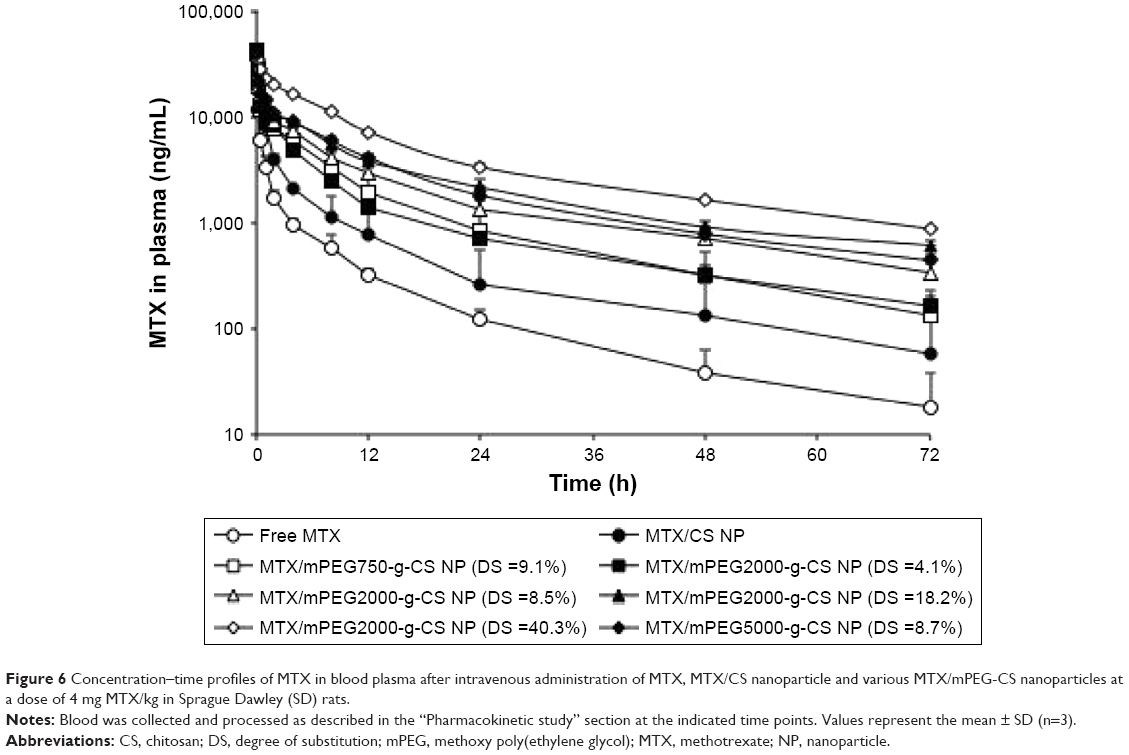 | Figure 6 Concentration–time profiles of MTX in blood plasma after intravenous administration of MTX, MTX/CS nanoparticle and various MTX/mPEG-CS nanoparticles at a dose of 4 mg MTX/kg in Sprague Dawley (SD) rats. |
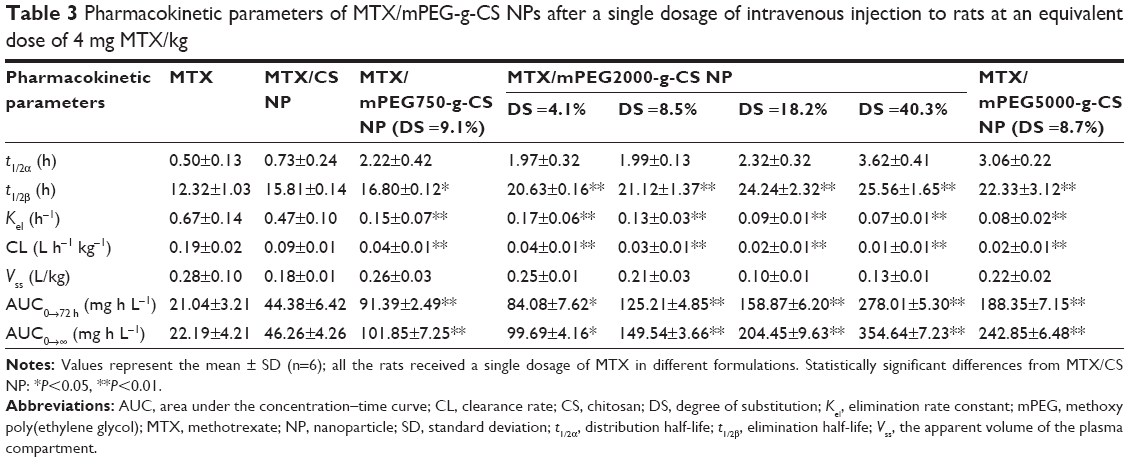 | Table 3 Pharmacokinetic parameters of MTX/mPEG-g-CS NPs after a single dosage of intravenous injection to rats at an equivalent dose of 4 mg MTX/kg |
The linear relationship between AUC0–72 h and the MW of mPEG (R2=0.955), as shown in Figure 7, indicates that a longer PEG chain may provide a better protection of the NPs from the RES, leading to prolonged drug circulation in the bloodstream. Moreover, there was a strong linear correlation between AUC0–72 h and DS (R2=0.984), suggesting that a higher PEG surface density on the NPs may improve drug accumulation in the blood.
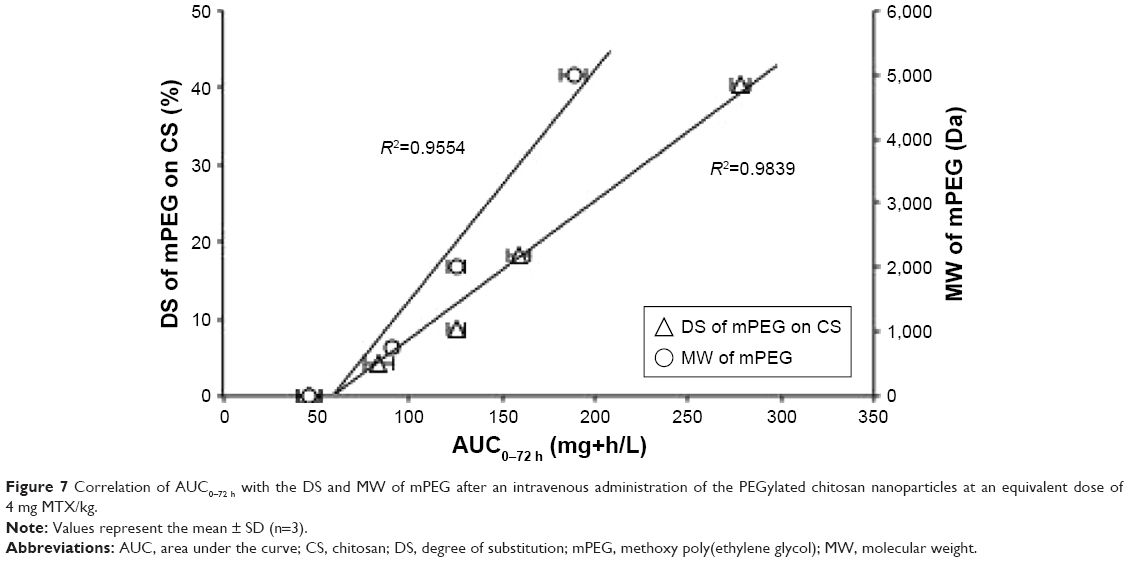 | Figure 7 Correlation of AUC0–72 h with the DS and MW of mPEG after an intravenous administration of the PEGylated chitosan nanoparticles at an equivalent dose of 4 mg MTX/kg. |
Biodistribution
The biodistribution of free MTX and various MTX-loaded NPs in the organs of ICR mice after 24 and 48 hours of intravenous administration is shown in Figure 8A and B, respectively, and the results are summarized in Table 4. It was demonstrated that the MTX/mPEG-g-CS NPs displayed different MTX distribution profiles in mouse tissues when compared with free MTX and MTX/CS NP. Accumulation of the MTX/CS NP without mPEG modification was high in the liver and spleen; this result is compatible with other studies.9,45 This could be due to its uptake by phagocytic cells, which can engulf the NP and transport it to liver or spleen for degradation and elimination.
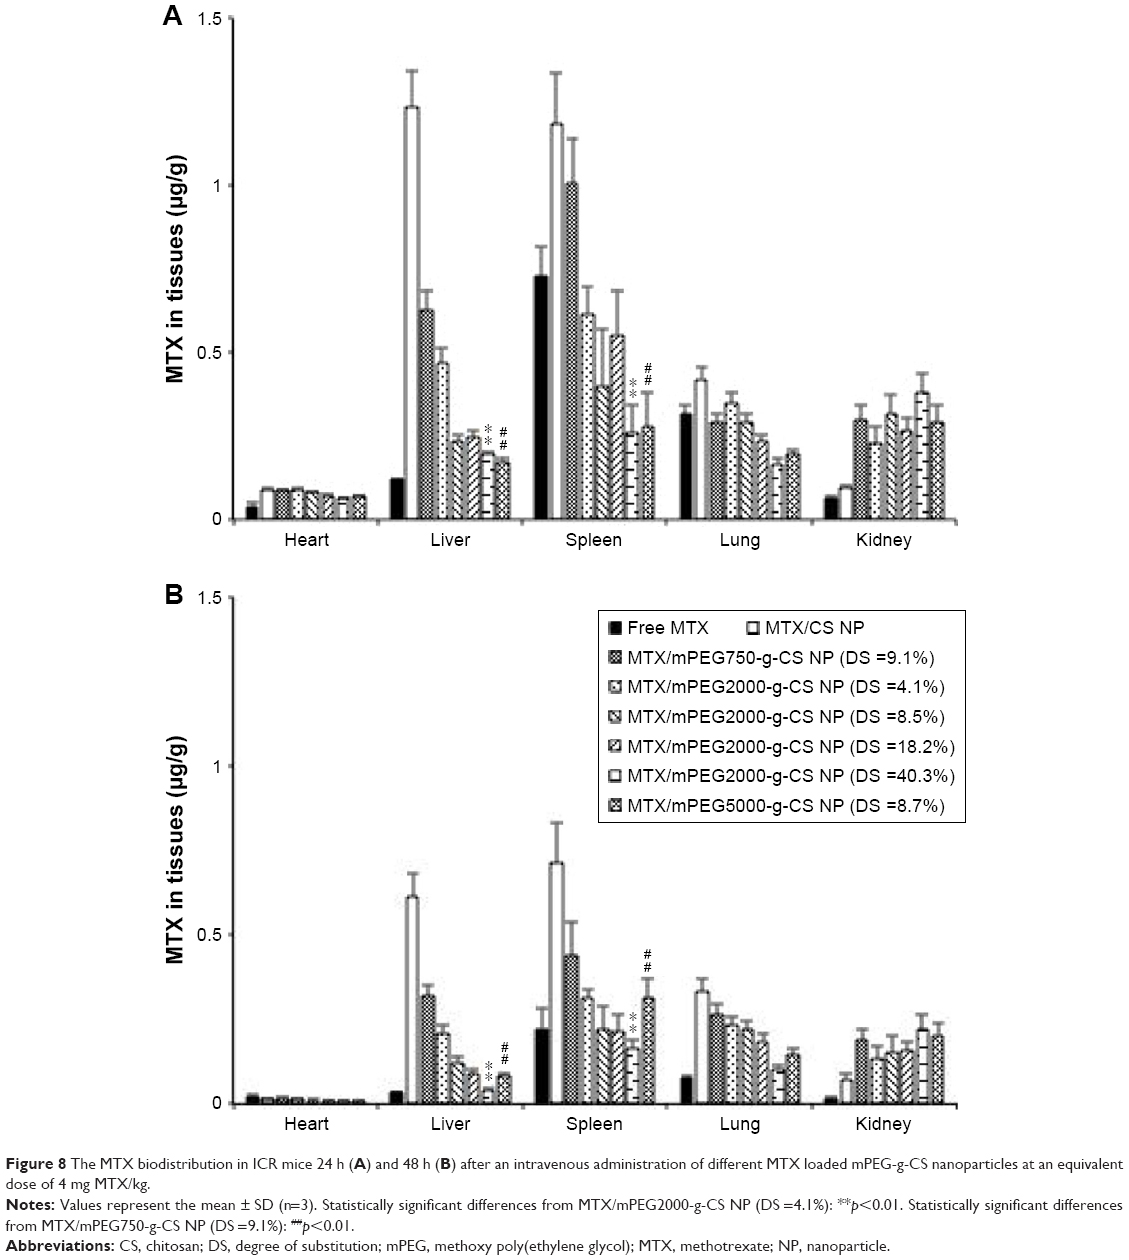 | Figure 8 The MTX biodistribution in ICR mice 24 h (A) and 48 h (B) after an intravenous administration of different MTX loaded mPEG-g-CS nanoparticles at an equivalent dose of 4 mg MTX/kg. |
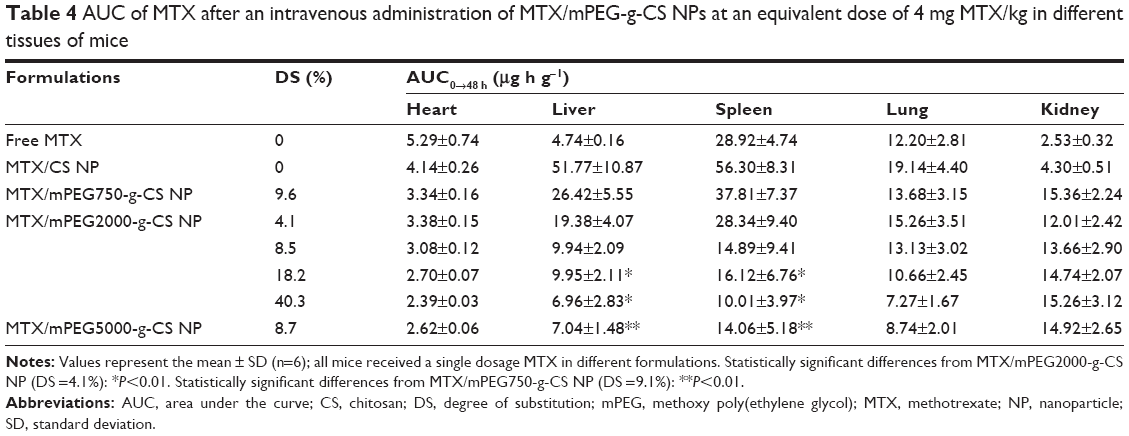 | Table 4 AUC of MTX after an intravenous administration of MTX/mPEG-g-CS NPs at an equivalent dose of 4 mg MTX/kg in different tissues of mice |
As a comparison, the administration of MTX/mPEG-g-CS NPs led to reduction of biodistribution in heart, liver, spleen, and lungs, but an increase in the kidney, compared with MTX/CS NP. The improved biodistribution in the non-reticuloendothelial kidney was attributed to the prolonged blood circulation of PEGylated CS NPs in the body. As shown in the Figure 8, the increase in MW (Mw =750, 2,000 and 5,000 Da) or in PEG surface density (DS =4.1%, 8.5%, 18.2% and 40.3%) decreased the AUC0–48 h in liver (P<0.01), spleen (P<0.01), and lung tissue, but not in kidney. This indicates that the increase in mPEG surface density and chain length on the CS NP surface could prolong the blood circulation time of the NPs by improving its ability to escape from macrophages and RES system, which is one of the important aspects of drug delivery.
Conclusion
MTX-loaded mPEG-g-CS NPs were successfully developed and their surface coated with different MWs (Mw =750, 2,000 and 5,000 Da) and different mPEG surface densities. The increase in MW and mPEG surface density decreased internalization of the NPs in J774A.1 macrophages cells. MTX/mPEG-g-CS NP with mPEG modification could significantly alter the pharmacokinetics parameters and biodistribution of MTX in vivo. With increasing the mPEG MW and mPEG surface density, the AUC of MTX increased while the accumulation of MTX in liver, spleen, and lung decreased. These results suggest that MTX/mPEG-g-CS NP can be used as a potential anticancer drug carrier for targeted tumor delivery and also indicate that the PEG MW and mPEG surface density are the key parameters for prolonging the blood circulation time for a better biodistribution.
Acknowledgment
This work was supported by Shanghai Municipal Natural Science Foundation (contract no 17ZR1406600), Science and Technology Commission of Shanghai Municipality (contract no 10DZ2220500), and The Shanghai Committee of Science and Technology (grant no 11DZ2260600).
Disclosure
The authors report no conflicts of interest in this work.
References
Hejazi R, Amiji M. Chitosan-based gastrointestinal delivery systems. J Control Release. 2003;89(2):151–165. | ||
Yuan Z, Ye Y, Gao F, et al. Chitosan-graft-β-cyclodextrin nanoparticles as a carrier for controlled drug release. Int J Pharm. 2013;446(1–2):191–198. | ||
Jameela SR, Latha PG, Subramoniam A, Jayakrishnan A. Antitumour activity of mitoxantrone-loaded chitosan microspheres against Ehrlich ascites carcinoma. J Pharm Pharmacol. 1996;48(7):685–688. | ||
Mitra S, Gaur U, Ghosh PC, Maitra AN. Tumour targeted delivery of encapsulated dextran-doxorubicin conjugate using chitosan nanoparticles as carrier. J Control Release. 2001;74(1–3):317–323. | ||
Gan Q, Wang T. Chitosan nanoparticle as protein delivery carrier – systematic examination of fabrication conditions for efficient loading and release. Colloids Surf B Biointerfaces. 2007;59(1):24–34. | ||
van der Lubben IM, Konings FA, Borchard G, Verhoef JC, Junginger HE. In vivo uptake of chitosan microparticles by murine Peyer’s patches: visualization studies using confocal laser scanning microscopy and immunohistochemistry. J Drug Target. 2001;9(1):39–47. | ||
Mao HQ, Roy K, Troung-Le VL, et al. Chitosan-DNA nanoparticles as gene carriers: synthesis, characterization and transfection efficiency. J Control Release. 2001;70(3):399–421. | ||
Alex SM, Rekha MR, Sharma CP. Spermine grafted galactosylated chitosan for improved nanoparticle mediated gene delivery. Int J Pharm. 2011;410(1–2):125–137. | ||
Hou Z, Zhan C, Jiang Q, et al. Both FA- and mPEG-conjugated chitosan nanoparticles for targeted cellular uptake and enhanced tumor tissue distribution. Nanoscale Res Lett. 2011;6(1):563. | ||
Parveen S, Sahoo SK. Long circulating chitosan/PEG blended PLGA nanoparticle for tumor drug delivery. Eur J Pharmacol. 2011;670(2–3):372–383. | ||
Liu G, Luo Q, Wang H, Zhuang W, Wang Y. In situ synthesis of multidentate PEGylated chitosan modified gold nanoparticles with good stability and biocompatibility. RSC Adv. 2015;5(86):70109–70116. | ||
Harris JM, Struck EC, Case MG, et al. Synthesis and characterization of poly(ethylene glycol) derivatives. J Polym Sci Polym Chem Ed. 1984;22(2):341–352. | ||
Saito H, Wu X, Harris JM, Hoffman AS. Graft copolymers of poly(ethylene glycol) (PEG) and chitosan. Macromol Rapid Commun. 1997;18(7):547–550. | ||
Makuska R, Gorochovceva N. Regioselective grafting of poly (ethylene glycol) onto chitosan through C-6 position of glucosamine units. Carbohydr Polym. 2006;64(2):319–327. | ||
Zhang XG, Teng DY, Wu ZM, et al. PEG-grafted chitosan nanoparticles as an injectable carrier for sustained protein release. J Mater Sci Mater Med. 2008;19(12):3525–3533. | ||
Fu D-J, Jin Y, Xie M-Q, et al. Preparation and characterization of mPEG grafted chitosan micelles as 5-fluorouracil carriers for effective anti-tumor activity. Chin Chem Lett. 2014;25(11):1435–1440. | ||
Prego C, Torres D, Fernandez-Megia E, Novoa-Carballal R, Quiñoá E, Alonso MJ. Chitosan-PEG nanocapsules as new carriers for oral peptide delivery. Effect of chitosan pegylation degree. J Control Release. 2006;111(3):299–308. | ||
Chan P, Kurisawa M, Chung JE, Yang YY. Synthesis and characterization of chitosan-g-poly(ethylene glycol)-folate as a non-viral carrier for tumor-targeted gene delivery. Biomaterials. 2007;28(3):540–549. | ||
Papadimitriou SA, Achilias DS, Bikiaris DN. Chitosan-g-PEG nanoparticles ionically crosslinked with poly(glutamic acid) and tripolyphosphate as protein delivery systems. Int J Pharm. 2012;430(1–2):318–327. | ||
Yang C, Gao S, Dagnæs-Hansen F, Jakobsen M, Kjems J. Impact of PEG chain length on the physical properties and bioactivity of PEGylated chitosan/siRNA nanoparticles in vitro and in vivo. ACS Appl Mater Interfaces. 2017;9(14):12203–12216. | ||
Chen J, Huang L, Lai H, et al. Methotrexate-loaded PEGylated chitosan nanoparticles: synthesis, characterization, and in vitro and in vivo antitumoral activity. Mol Pharm. 2014;11(7):2213–2223. | ||
Vadia N, Rajput S. Study on formulation variables of methotrexate loaded mesoporous MCM-41 nanoparticles for dissolution enhancement. Eur J Pharm Sci. 2012;45(1–2):8–18. | ||
Trapani A, Denora N, Iacobellis G, Sitterberg J, Bakowsky U, Kissel T. Methotrexate-loaded chitosan- and glycolchitosan-based nanoparticles: a promising strategy for the administration of the anticancer drug to brain tumors. AAPS PharmSciTech. 2011;12(4):1302–1311. | ||
Battaglia L, Serpe L, Muntoni E, Zara G, Trotta M, Gallarate M. Methotrexate-loaded SLNs prepared by coacervation technique: in vitro cytotoxicity and in vivo pharmacokinetics and biodistribution. Nanomedicine. 2011;6(9):1561–1573. | ||
Jain A, Jain A, Garg NK, et al. Surface engineered polymeric nanocarriers mediate the delivery of transferrin-methotrexate conjugates for an improved understanding of brain cancer. Acta Biomater. 2015;24:140–151. | ||
Chen Y, Zhang W, Gu J, et al. Enhanced antitumor efficacy by methotrexate conjugated Pluronic mixed micelles against KBv multidrug resistant cancer. Int J Pharm. 2013;452(1–2):421–433. | ||
Banerjee D, Mayer-Kuckuk P, Capiaux G, Budak-Alpdogan T, Gorlick R, Bertino JR. Novel aspects of resistance to drugs targeted to dihydrofolate reductase and thymidylate synthase. Biochim Biophys Acta. 2002;1587(2–3):164–173. | ||
Zhang Y, Jin T, Zhuo RX. Methotrexate-loaded biodegradable polymeric micelles: preparation, physicochemical properties and in vitro drug release. Colloids Surf B Biointerfaces. 2005;44(2–3):104–109. | ||
Hashad RA, Ishak RA, Geneidi AS, Mansour S. Methotrexate loading in chitosan nanoparticles at a novel pH: response surface modeling, optimization and characterization. Int J Biol Macromol. 2016;91:630–639. | ||
Wu P, He X, Wang K, Tan W, He C, Zheng M. A novel methotrexate delivery system based on chitosan-methotrexate covalently conjugated nanoparticles. J Biomed Nanotechnol. 2009;5(5):557–564. | ||
Patel PN, Patel LJ, Patel JK. Chitosan loaded methotrexate nanoparticle active against breast cancer chemotherapy. Int J Pharm Form Anal. 2011;2:2–5. | ||
Mangaiyarkarasi R, Chinnathambi S, Aruna P, Ganesan S. Synthesis and formulation of methotrexate (MTX) conjugated LaF3:Tb(3+)/chitosan nanoparticles for targeted drug delivery applications. Biomed Pharmacother. 2015;69:170–178. | ||
Jeong YI, Kim DG, Jang MK, Nah JW. Preparation and spectroscopic characterization of methoxy poly(ethylene glycol)-grafted water-soluble chitosan. Carbohydr Res. 2008;343(2):282–289. | ||
Casettari L, Vllasaliu D, Mantovani G, Howdle SM, Stolnik S, Illum L. Effect of PEGylation on the toxicity and permeability enhancement of chitosan. Biomacromolecules. 2010;11(11):2854–2865. | ||
Trapani A, Denora N, Iacobellis G, Sitterberg J, Bakowsky U, Kissel T. Methotrexate-loaded chitosan- and glycol chitosan-based nanoparticles: a promising strategy for the administration of the anticancer drug to brain tumors. AAPS PharmSciTech. 2011;12(4):1302–1311. | ||
Seo DH, Jeong YI, Kim DG, Jang MJ, Jang MK, Nah JW. Methotrexate-incorporated polymeric nanoparticles of methoxy poly(ethylene glycol)-grafted chitosan. Colloids Surf B Biointerfaces. 2009;69(2):157–163. | ||
Jeong Y-I, Seo D-H, Kim D-G, et al. Methotrexate-incorporated polymeric micelles composed of methoxy poly(ethylene glycol)-grafted chitosan. Macromol Res. 2009;17(7):538–543. | ||
Jun YW, Casula MF, Sim JH, Kim SY, Cheon J, Alivisatos AP. Surfactant-assisted elimination of a high energy facet as a means of controlling the shapes of TiO2 nanocrystals. J Am Chem Soc. 2003;125(51):15981–15985. | ||
Förster S, Antonietti M. Amphiphilic block copolymers in structure-controlled nanomaterial hybrids. Adv Mater. 1998;10(3):195–217. | ||
Zhao W, Brook MA, Li Y. Design of gold nanoparticle-based colorimetric biosensing assays. Chembiochem. 2008;9(15):2363–2371. | ||
Papadimitriou S, Bikiaris D, Avgoustakis K, Karavas E, Georgarakis M, et al. Chitosan nanoparticles loaded with dorzolamide and pramipexole. Carbohydr Polym. 2008;73(1):44–54. | ||
Jingou J, Shilei H, Weiqi L, Danjun W, Tengfei W, Yi X. Preparation, characterization of hydrophilic and hydrophobic drug in combine loaded chitosan/cyclodextrin nanoparticles and in vitro release study. Colloids Surf B Biointerfaces. 2011;83(1):103–107. | ||
Ji J, Wu D, Liu L, Chen J, Xu Y. Preparation, evaluation, and in vitro release of folic acid conjugated O-carboxymethyl chitosan nanoparticles loaded with methotrexate. J Appl Polym Sci. 2012;125(S2):E208–E215. | ||
Zhang Y, Mintzer E, Uhrich KE. Synthesis and characterization of PEGylated bolaamphiphiles with enhanced retention in liposomes. J Colloid Interface Sci. 2016;482:19–26. | ||
van Vlerken LE, Vyas TK, Amiji M. Poly(ethylene glycol)-modified nanocarriers for tumor-targeted and intracellular delivery. Pharm Res. 2007;24(8):1405–1414. | ||
Owens DE 3rd, Peppas NA. Opsonization, biodistribution, and pharmacokinetics of polymeric nanoparticles. Int J Pharm. 2006;307(1):93–102. | ||
Hong M, Zhu S, Jiang Y, Tang G, Pei Y. Efficient tumor targeting of hydroxycamptothecin loaded PEGylated niosomes modified with transferrin. J Control Release. 2009;133(2):96–102. |
Supplementary materials
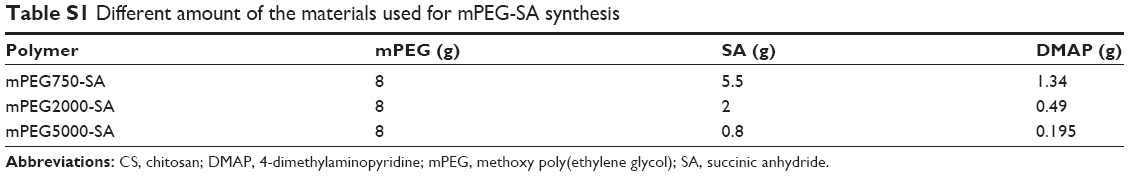 | Table S1 Different amount of the materials used for mPEG-SA synthesis |
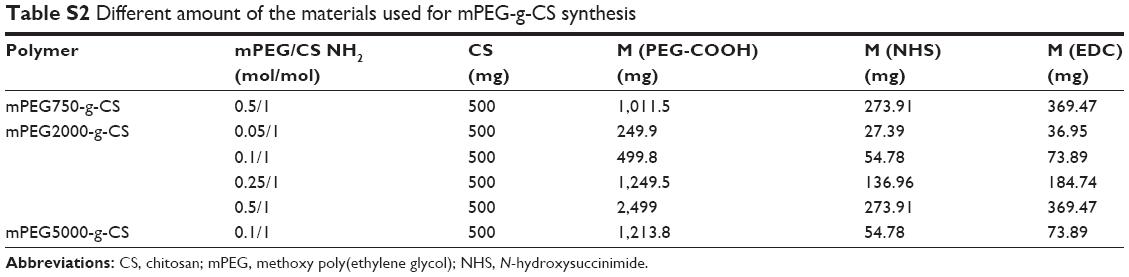 | Table S2 Different amount of the materials used for mPEG-g-CS synthesis |
 | Figure S1 The 1H-NMR spectra of (A) mPEG, (B) mPEG750-SA, (C) mPEG2000-SA and (D) mPEG5000-SA. |
 | Figure S2 The 1H-NMR spectra of (A) CS, (B) mPEG-SA and (C) mPEG-g-CS. |
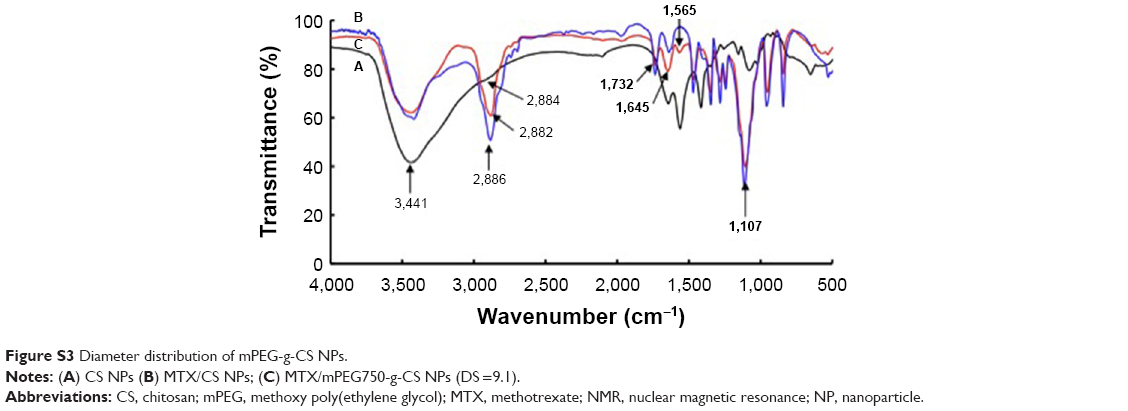 | Figure S3 Diameter distribution of mPEG-g-CS NPs. |
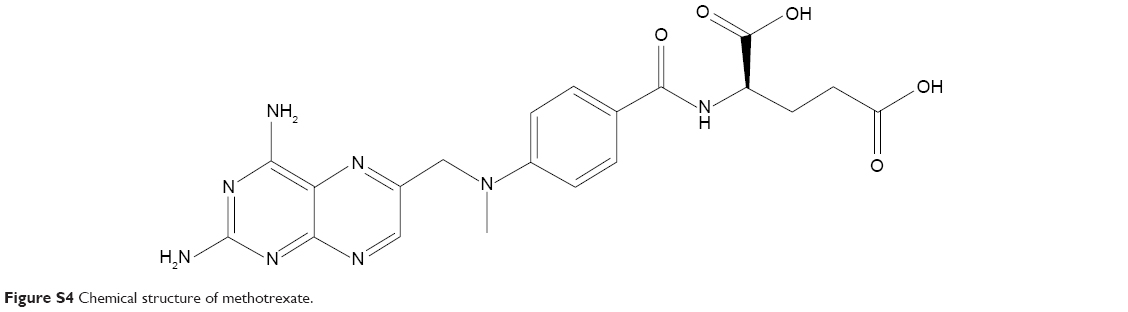 | Figure S4 Chemical structure of methotrexate. |
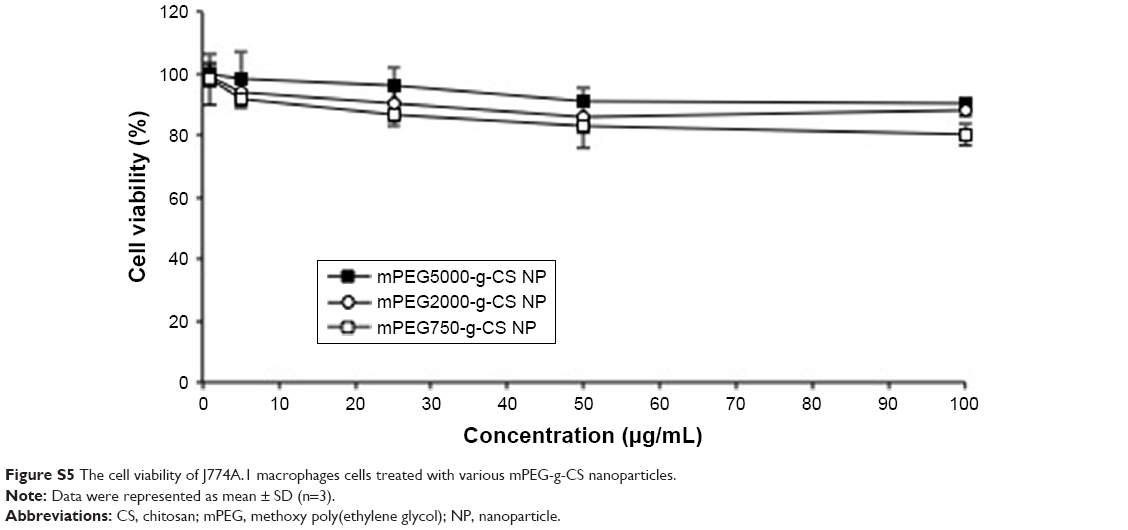 | Figure S5 The cell viability of J774A.1 macrophages cells treated with various mPEG-g-CS nanoparticles. |
 © 2018 The Author(s). This work is published and licensed by Dove Medical Press Limited. The
full terms of this license are available at https://www.dovepress.com/terms
and incorporate the Creative Commons Attribution
- Non Commercial (unported, 3.0) License.
By accessing the work you hereby accept the Terms. Non-commercial uses of the work are permitted
without any further permission from Dove Medical Press Limited, provided the work is properly
attributed. For permission for commercial use of this work, please see paragraphs 4.2 and 5 of our Terms.
© 2018 The Author(s). This work is published and licensed by Dove Medical Press Limited. The
full terms of this license are available at https://www.dovepress.com/terms
and incorporate the Creative Commons Attribution
- Non Commercial (unported, 3.0) License.
By accessing the work you hereby accept the Terms. Non-commercial uses of the work are permitted
without any further permission from Dove Medical Press Limited, provided the work is properly
attributed. For permission for commercial use of this work, please see paragraphs 4.2 and 5 of our Terms.