Back to Journals » Drug Design, Development and Therapy » Volume 8
Effects of immunosuppressive treatment on protein expression in rat kidney
Authors Kędzierska K, Sporniak-Tutak K, Sindrewicz K, Bober J, Domański L, Parafiniuk M, Urasińska E, Ciechanowicz A, Domański M, Smektała T, Masiuk M ![]() , Skrzypczak W, Ożgo M, Kabat-Koperska J, Ciechanowski K
, Skrzypczak W, Ożgo M, Kabat-Koperska J, Ciechanowski K
Received 25 March 2014
Accepted for publication 7 May 2014
Published 30 September 2014 Volume 2014:8 Pages 1695—1708
DOI https://doi.org/10.2147/DDDT.S64814
Checked for plagiarism Yes
Review by Single anonymous peer review
Peer reviewer comments 3
Karolina Kędzierska,1 Katarzyna Sporniak-Tutak,2 Krzysztof Sindrewicz,2 Joanna Bober,3 Leszek Domański,1 Mirosław Parafiniuk,4 Elżbieta Urasińska,5 Andrzej Ciechanowicz,6 Maciej Domański,1 Tomasz Smektała,2 Marek Masiuk,5 Wiesław Skrzypczak,6 Małgorzata Ożgo,6 Joanna Kabat-Koperska,1 Kazimierz Ciechanowski1
1Department of Nephrology, Transplantology, and Internal Medicine, 2Department of Dental Surgery, 3Department of Medical Chemistry, 4Department of Forensic Medicine, 5Department of Pathomorphology, Pomeranian Medical University, 6Department of Physiology, Cytobiology, and Proteomics, West Pomeranian University of Technology, Szczecin, Poland
Abstract: The structural proteins of renal tubular epithelial cells may become a target for the toxic metabolites of immunosuppressants. These metabolites can modify the properties of the proteins, thereby affecting cell function, which is a possible explanation for the mechanism of immunosuppressive agents' toxicity. In our study, we evaluated the effect of two immunosuppressive strategies on protein expression in the kidneys of Wistar rats. Fragments of the rat kidneys were homogenized after cooling in liquid nitrogen and then dissolved in lysis buffer. The protein concentration in the samples was determined using a protein assay kit, and the proteins were separated by two-dimensional electrophoresis. The obtained gels were then stained with Coomassie Brilliant Blue, and their images were analyzed to evaluate differences in protein expression. Identification of selected proteins was then performed using mass spectrometry. We found that the immunosuppressive drugs used in popular regimens induce a series of changes in protein expression in target organs. The expression of proteins involved in drug, glucose, amino acid, and lipid metabolism was pronounced. However, to a lesser extent, we also observed changes in nuclear, structural, and transport proteins' synthesis. Very slight differences were observed between the group receiving cyclosporine, mycophenolate mofetil, and glucocorticoids (CMG) and the control group. In contrast, compared to the control group, animals receiving tacrolimus, mycophenolate mofetil, and glucocorticoids (TMG) exhibited higher expression of proteins responsible for renal drug metabolism and lower expression levels of cytoplasmic actin and the major urinary protein. In the TMG group, we observed higher expression of proteins responsible for drug metabolism and a decrease in the expression of respiratory chain enzymes (thioredoxin-2) and markers of distal renal tubular damage (heart fatty acid-binding protein) compared to expression in the CMG group. The consequences of the reported changes in protein expression require further study.
Keywords: Proteomics, drug effects, immunosuppression, rats
Introduction
Modern immunosuppressive regimens have contributed to a reduction in the incidence of acute rejection episodes, which has resulted in very good 1-year renal graft survival, reaching 90%–95%. Interestingly, the present average half-life of a transplanted kidney in the United States is only approximately 1 year longer than the half-life in 1988. Currently, based on data published by the Collaborative Transplant Study, the half-life reaches approximately 16 years in Europe, whereas in the United States, it is only 8.8 years.1,2 The data are a stimulus for seeking the causes of this phenomenon. Traditionally, the side effects of immunosuppressive drugs have been considered to be one of the main reasons for this situation.
The process of urine concentration in the renal tubules directly exposes cells to the harmful influence of toxins contained in the tubular fluid. Toxins permanently damage the cells of the renal tubules, especially in the proximal part, which shows the highest metabolic activity and the most advanced transport mechanisms. The S3 segment of the proximal tubules contains peroxisomes and amino acid-degrading enzymes. Moreover, several enzymes involved in the metabolism of drugs, such as oxidases and cytochrome p450, have high activity in the region.3 Extremely intense biochemical changes occur in the proximal tubules. Proximal convoluted tubule cells contain many mitochondria and an extensive Golgi system. Mitochondrial oxygen metabolism is the primary source of energy (concentrated in ATP) in this part of a nephron. Renal tubular epithelial cells’ structural proteins may become a target for immunosuppressive drugs’ toxic metabolites. The toxins can modify the properties of the proteins, thereby changing the cells’ functions. This phenomenon likely explains the mechanism of immunosuppressive agents’ toxicity in a graft.
Asif et al studied the effect of mycophenolate mofetil on protein expression in the kidneys of Wistar rats. They found that the treatment mainly affected proteins involved in drug metabolism, but there were also certain changes in proteins that are important in glucose, amino acid, and lipid metabolism and in redox reactions.4 In turn, Lamoureux et al compared the effects of cyclosporin A and tacrolimus on human embryonic kidney (HEK) cells and proved that cyclosporin A affected protein expression more significantly than tacrolimus did.5 In the same study, respiratory chain and cytoskeletal protein expression was also affected. Klawitter et al observed similar changes in protein expression in Wistar rats treated with cyclosporin A and tacrolimus.6 In the cyclosporine group, compared to the control group, higher expression of cytoskeletal proteins and renal aminoacylase (which is important in renal drug metabolism) was observed. The expression of proteins participating in redox reactions was decreased. No similar changes were found in rats treated with tacrolimus.
The aim of our study was to investigate the effect of drugs used in standard immunosuppressive regimens on protein expression in the rat kidney. We created a model of immunosuppressant action that may be compared to chronic immunosuppressive therapy in humans. We chose a physiological enteric route of drug administration, and the duration of the study was extended to 6 months. The immunosuppressive regimens most commonly used in clinical practice were examined. The medication doses used during the study reached levels in the therapeutic range.
Materials and methods
Study design
The study was conducted on 18 male Wistar rats obtained from a licensed breeder (the Institute of Occupational Medicine, Lodz, Poland). At the start of the experiments, the rats were 14 weeks old. The animals had genetic and health certificates issued by a veterinarian. The experiments were approved by the Local Ethical Committee for Experiments on Animals in Szczecin (No 06/08, dated February 4, 2008, and No 24/08, dated November 24, 2008).
The animals were housed in cages, with six rats per cage, in the Animal Facility of Pomeranian Medical University. The room humidity was approximately 55%, and the air temperature was 22°C±2°C. The lighting, on a 12/12-hour cycle, was controlled by automatic timers. Before the study, all animals were weighed, and their mean weight was 305 g. During 2 weeks of adaptation, the animals were fed specialized laboratory diet LSM (1,474 kJ/100 g, 17.6% protein, Agro Pol, Motycz, Lublin, Poland) and given water to drink ad libitum. All animals survived the adaptation period.
The experiments were performed using the pharmaceutical form of each drug. The animals received a drug in a ball of bread orally. The drug doses were based on data available in the literature.7–11 The doses used in the study were as follows: tacrolimus (Prograf, Astellas Pharma, Warsaw, Poland): 4 mg/kg/day; mycophenolate mofetil (CellCept, Roche Registration Limited, Welwyn Garden City, Great Britain): 20 mg/kg/day; cyclosporin A (Sandimmun Neoral, Novartis Pharma Gmbh, Nüremberg, Germany): 5 mg/kg/day, and prednisone (Encorton, Polfa, Pabianice, Poland): 4 mg/kg/day. The animals received medication every 24 hours for 6 months. After 3 months of study, the animals were weighed again, and each medication dose was adequately adjusted based on the changed weight. Six rats did not received treatment, as they formed a control group. A diagram of the study is presented in Table 1.
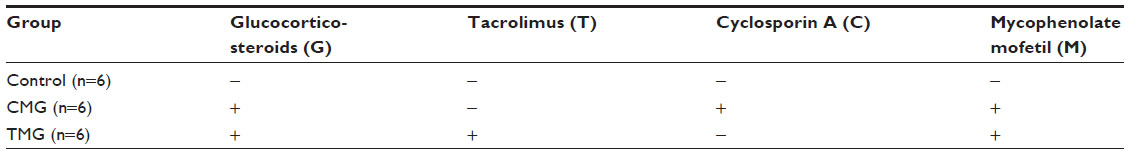 | Table 1 Study design |
All 18 rats completed the study. After 6 months of study, the animals were anesthetized by intraperitoneal ketamine hydrochloride injection (50 mg/kg) and blood samples were obtained to determine drug levels and urea and creatinine concentration. Their body weight was also measured. Subsequently, necropsies were performed, and the kidneys were harvested for histopathological examination. The right kidney was placed in a vat of liquid nitrogen, and the left one was placed in a formalin solution.
Determination of urea and creatinine concentrations
The concentration of urea and creatinine were determined in blood serum, and glomerular filtration rate (GFR) was calculated from obtained results. The concentration of urea and creatinine were determined by the colorimetric method two-point type “fix time” using the reagent kits (Aqua Med, Lodz, Poland); results were reported in mg/dL.
Determination of drug concentrations
Drug concentrations were determined in accordance with the literature after 4 hours of enteral administration.11,12
The concentrations of tacrolimus and cyclosporin A were determined in the rats’ whole blood. The test was performed in the Clinical Central Laboratory in Szczecin. An IMx assay, based on a microparticle enzyme immunoassay, was used to determine the tacrolimus level. The test was performed using an Abbott analyzer (Abbott Laboratories, Abbott Park, IL, USA).
The concentration of cyclosporin A was determined using an Abbott AxSYM assay, which is a fluorescence-based method (a fluorescence polarization immunoassay).
Sample preparation
Dissected tissue fragments were washed twice with 0.9% NaCl (0°C) and thereafter twice with 20 mM Krebs-HEPES buffer (Sigma-Aldrich Co., St Louis, MO, USA; 0°C, pH 7.4). Subsequently, the tissue fragments were placed in liquid nitrogen, homogenized, and dissolved in lysis buffer containing 5 M urea, 2 M thiourea, 4% CHAPS, 40 mM Tris, and 0.2% carrier ampholyte. The samples prepared in that manner were then stored (−80°C) until further analysis.
Two-dimensional electrophoresis mass spectrometry
Prior to analysis, the samples were thawed at 0°C, precipitated with four volumes of cold acetone (−20°C), and centrifuged (15,000 rpm/30 minutes). The protein pellets obtained in this way were later dissolved in lysis buffer (5 M urea, 2 M thiourea, 4% w/v CHAPS, 40 mM Tris, 0.2% w/v 3–10 ampholytes, and 2 mM TBP; Sigma-Aldrich Co.). Isoelectric focusing was performed (Protean, IEF Cell, Bio-Rad, Hercules, CA, USA) using 3–10, 17 cm NL ReadyStrip IPG Strips (Bio-Rad) (400 μg protein/400 μL rehydration buffer) over a total of 92400 Vh. The focused IPG strips were reduced with dithiothreitol (DTT) in equilibration buffer (6 M urea, 0.5 M Tris/HCl, pH 6.8, 2% w/v SDS, 30% w/v glycerol, and 1% w/v DTT; Sigma-Aldrich Co.) for 15 minutes and then alkylated with iodoacetamide (2.5% w/v) for 20 minutes at ambient temperature. After the equilibration process, sodium dodecyl sulfate polyacrylamide gel electrophoresis (SDS-PAGE) was performed on large-format 12% SDS polyacrylamide gels at 40 V for 1 hour and subsequently at 120 V for 18 hours at 10°C. After two-dimensional electrophoresis (2-DE) separation, the gels were stained for 72 hours with colloidal Coomassie Brilliant Blue G-250. Gel images were acquired (GS-800 Calibrated Densitometer, Bio-Rad). The 2-D image computer analysis was performed using PDQuest Analysis software version 8.01 Advanced (Bio-Rad). Analytical procedures performed on each gel included spot background substraction, spot detection, and matching. Normalization of each individual spot was performed using local regression model. Coefficient of variation was calculated for replicate groups. Significance of protein expression changes was measured by the aid of integrated with the software statistic tool based on Student’s t-test.
Protein identification was performed with the aid of matrix-assisted laser desorption/ionization time-of-flight mass spectrometry (MS), as previously described by Skrzypczak et al.13
Histopathological evaluation
The study was blinded. A semiquantitative method was used for sample evaluation. In each sample, ten consecutive vision fields were assessed at 10 × 20 magnification while maintaining a margin of approximately 200 μm from the edge of the sample. A microscope (Carl Zeiss, Oberkochen, Germany) equipped with a camera was used. Images were recorded using Aperio ImageScope v9 software (Aperio Technologies, Inc, Vista, CA, USA). Two experienced pathologists independently assessed the histological preparations stained with hematoxylin/eosin (HE) and periodic acid–Schiff (PAS). The material was evaluated in terms of potential acute or chronic inflammatory changes within the renal tubules, glomeruli, and vessels in accordance with a modified version of the Banff 2009 criteria (we omitted the criteria for graft rejection [Table S1]).14
Results
Rat body weight and laboratory blood test results of rats
Analyzing obtained results, we found lower body weight in rats receiving immunosuppressive therapy. Rats from the control group reached the highest weight (median 562.5 g); lower weight was observed in the cyclosporine, mycophenolate mofetil, and glucocorticoids (CMG) group (554 g), and the lowest in the group receiving tacrolimus, mycophenolate mofetil, and glucocorticoids (TMG) (median, 482.5 g). This difference was not statistically significant. Blood biochemical parameters of rats were also analyzed. We found significantly lower serum urea in the CMG group compared to control (P<0.01). There was no significant difference in the concentration of creatinine and GFR between examined groups and control (Table 2). The results of drug concentration are shown in Table 3.
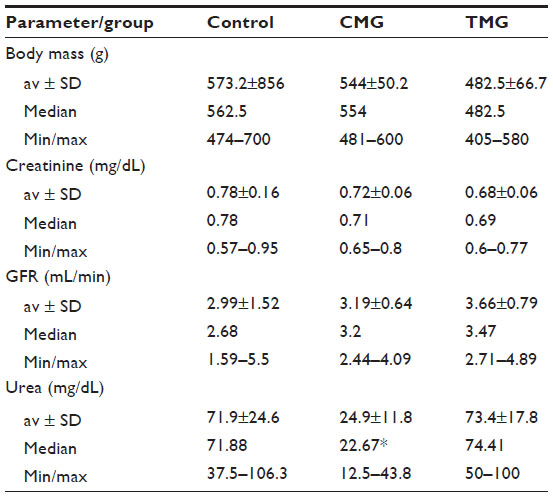 | Table 2 Body weight and laboratory blood test results of rats in the treatment groups |
 | Table 3 Medication trough level in examined rats |
Proteomic analysis
After performing 2-DE, we separated 75 spots, which corresponded to protein expression differences between the two groups (Figure 1).
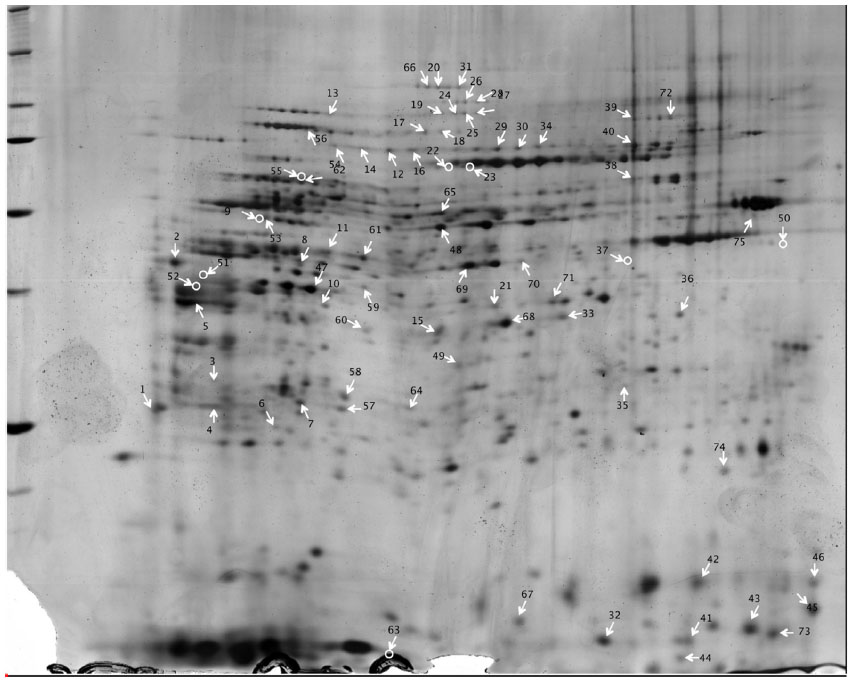 | Figure 1 Two-dimensional electrophoresis of rat kidney proteins. |
Using MS, we identified and described 56 of the 75 proteins. Their names, masses in Da, isoelectric points, and functions are presented in Table S2.
Most of the identified proteins (27%) belonged to a group of enzymes involved in glucose, amino acid, and lipid metabolism. Approximately 25% of the identified proteins were involved in redox reactions and the intracellular respiration process. Approximately 14% of the identified proteins played a role in drug metabolism. In total, 13% of the identified proteins were albumins, and 5% were cytoskeletal structural proteins. The remaining 16% of the identified proteins were nuclear and ribosomal proteins, among others.
We then performed a detailed analysis of all of the proteins whose expression was significantly different between the study groups. Proteins that could not be identified were characterized based on sample-specific point (SSP).
The lowest number of proteins distinguished the CMG group from the control group (Table S3). We observed the most significant differences between the control group and the TMG group (Table S4) and between the CMG and the TMG groups (Table S5).
In the CMG group, which received cyclosporin A, mycophenolate mofetil (MMF), and corticosteroids, there was a significant increase in the expression of albumin and the 5A subunit of mitochondrial cytochrome c oxidase (belonging to a group of respiratory chain proteins) in comparison with expression in the control group. In the CMG group, we observed a significant decrease in the expression of alpha enolase and 3-hydroxyisobutyrate dehydrogenase, which are both very important in glucose, amino acid, and lipid metabolism. A significant decrease in the expression of alcohol dehydrogenase was also observed in the CMG group. Proteins with spot numbers of 47, 48, and 49 were specifically expressed in the CMG group.
There were many significant differences in protein expression between the TMG group and the control group (Table S3). In the former group, we observed increased expression of the following proteins:
- A group of redox enzymes and components of respiratory chain proteins (mitochondrial transferase one succinyl-CoA, the pyruvate dehydrogenase complex, malate dehydrogenase)
- Enzymes involved in glucose, lipid, and amino acid metabolism (mitochondrial aspartate aminotransferase, 17-β-hydroxysteroid dehydrogenase, triose-phosphate isomerase, glutamine synthetase).
In addition, we noticed increased expression of 60S acidic ribosomal protein and the unidentified proteins SSP 3404, SSP 7304, and SSP 7511. In the TMG group, we also found increased expression of the glutathione S-transferase alpha-3 subunit, whereas the expression of the P subunit stopped.
In the TMG group, compared to the control group, we observed significantly decreased expression of albumin; redox enzymes and components of the respiratory chain (NADH ubiquinone oxidoreductase, the F subunit of the V-type proton ATPase, the 5A subunit of mitochondrial cytochrome c oxidase); proteins involved in the metabolism of glucose, lipids, and amino acids (heart fatty acid-binding protein [H-FABP]), cytoskeletal proteins (myosin light polypeptide, cytoplasmic actin 1), nuclear and ribosomal proteins, and others (the major urinary protein [MUP] complex, the target of rapamycin complex 2 subunit MAPKAP1, protein regulators of microtubule dynamics). Additionally, the expression of several unidentified proteins (SSP numbers 3815, 4807, 5801, 5804, 5805, 5807, 5808, 5811, 5901, 6405, 9107) was lower in this group.
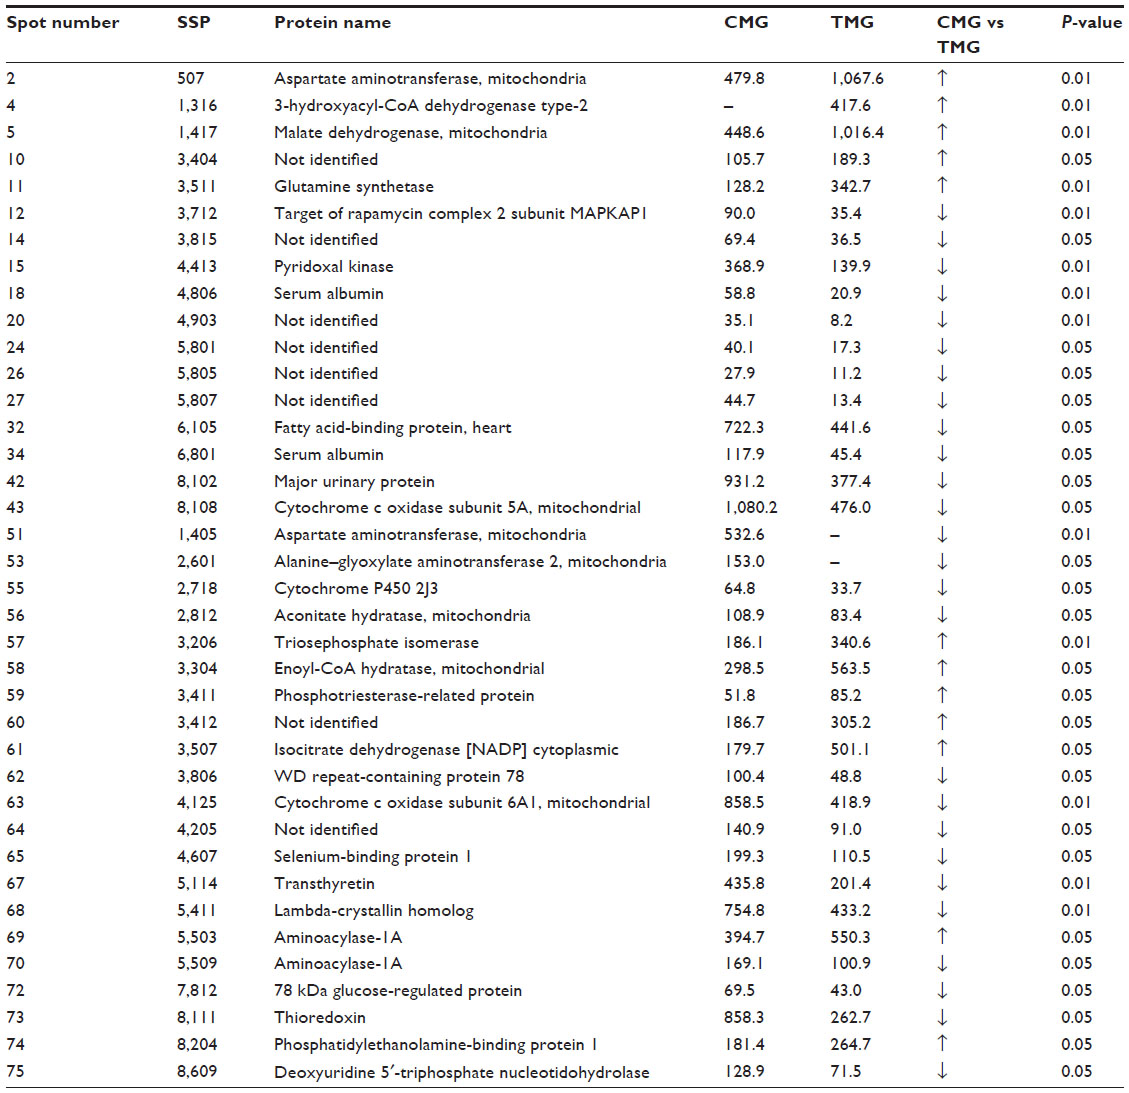
We also compared the expression of proteins in the CMG and TMG groups. We found several significant differences, and the groups differed in the expression of 38 proteins overall (Table S4). Differences in the expression of the proteins from spots 51 to 75 were found only between the CMG and the TMG groups.
In the TMG group, compared to the CMG group, the expression of the following proteins increased significantly: proteins in the redox enzyme group; components of the respiratory chain (mitochondrial malate dehydrogenase, mitochondrial enoyl-CoA hydratase, a protein associated with phosphotriesterase, cytoplasmic isocitrate dehydrogenase); proteins involved in the metabolism of glucose, lipids, and amino acids (triose-phosphate isomerase, 17-β-hydroxysteroid dehydrogenase X, glutamine synthetase); a protein involved in the metabolism of drugs (aminoacylase 1A); and others (phosphatidylethanolamine-binding protein and the unidentified proteins SSP 3404 and SSP 3412).
Many more proteins in the TMG group had lower expression compared to levels in the CMG group. The most significant differences that we observed were in the expression of not only redox enzymes and components of the respiratory chain (thioredoxin, glucose-regulated protein 78 kDa, mitochondrial aconitase, the 5A subunit of mitochondrial cytochrome c oxidase, the 6A1 subunit of mitochondrial cytochrome c oxidase) but also proteins involved in the metabolism of glucose, lipids, and amino acids (pyridoxine kinase homologue, lambda crystallin, mitochondrial aspartate aminotransferase, H-FABP); proteins involved in the metabolism of drugs (selenium-binding protein); and other proteins (transthyretin, the MUP), including unidentified ones (SSP 3815, 4903, 5801, 5805, 5807, 3412, and 4205).
In the compared groups, the expression of two proteins was ambivalent: the mitochondrial aspartate aminotransferase spot 2 (SSP 507) was higher in the TMG than in the CMG group, but the animals in the TMG group did not demonstrate expression of mitochondrial aspartate aminotransferase spot 51 (SSP 1405). Similarly, the expression of aminoacylase 1A spot 69 (SSP 5503) was higher in the TMG group, whereas in the case of aminoacylase 1A spot 70 (SSP 5509), higher expression was observed in the CMG group.
In summary, in a proteomic analysis of protein expression in the rat kidney, the least significant differences were observed between the CMG and the control groups. Moreover, in comparison with the control group, we observed higher expression of proteins responsible for drug metabolism (the glutathione S-transferase alpha-3 subunit, triose-phosphate isomerase) and lower cytoplasmic actin and MUP expression in the TMG group. Higher expression of proteins responsible for renal drug metabolism (aminoacylase) was also observed in the TMG group in comparison with the CMG group. Lower expression of respiratory chain enzymes, thioredoxin-2 and markers of distal renal tubular damage (H-FABP) in the TMG group was another important difference between the two treatment groups.
Kidney preparation analysis by light microscopy
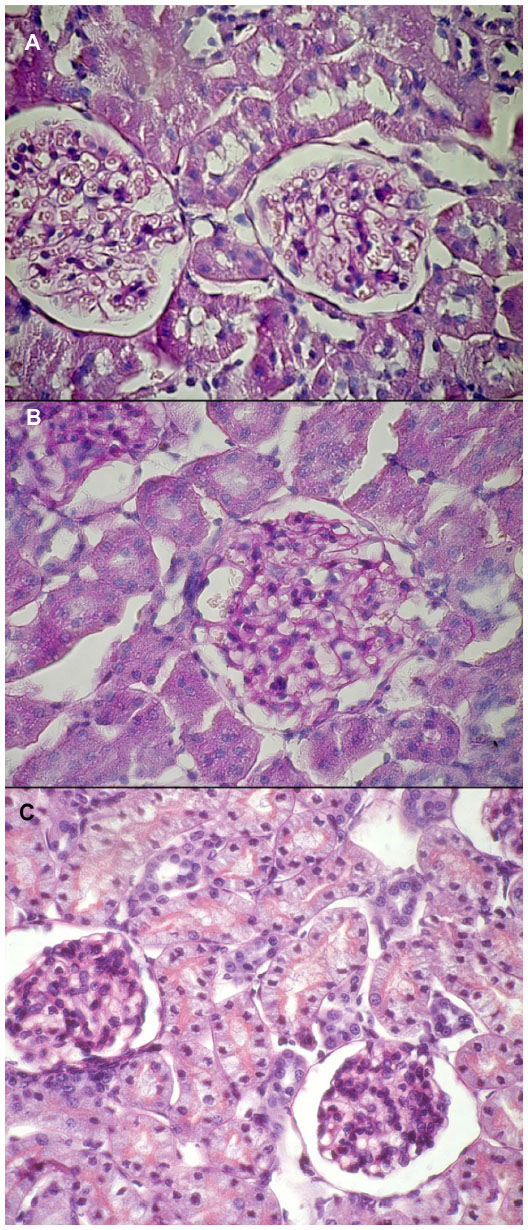
The analysis of the HE- and PAS- stained slides obtained from each group showed the following (Figure 2 and 3):
- Control group: Normal glomeruli, tubules, and vessel structures were observed. According to the Banff 2009 criteria, the features were assessed as ct0, Ci0, cg0, ah0, t0, i0.
- CMG group: No differences from the control group were found; Banff 2009 criteria: ct0, Ci0, cg0, ah0, t0, i0.
- TMG group: Well-preserved proximal tubules with homogeneous cytoplasm and single cells in the interstitium (<10%) were observed, which was similar to the control group; Banff 2009 criteria: ct0, Ci0, cg0, ah0, t0, i0.
 | Figure 2 HE staining of rat kidney. |
 | Figure 3 PAS staining of rat kidney. |
Discussion
This study involved three groups of animals. Two treatment groups corresponded to the immunosuppressant schemes most commonly used in clinical practice. The drugs were dosed to achieve the therapeutic range of trough levels. Other investigators have used toxic doses of medicines.15–17 Drug concentrations were determined 4 hours after their enteral supply, which was based on published data.11,12 Due to differences from humans’ metabolism of immunosuppressants, this timing was considered to be optimal for determining the concentrations of drugs in rats’ blood.
In our experiments in rat kidneys, we observed certain changes in the expression of the same proteins as those that Lamoureux et al and Klawitter et al noticed in their studies.5,6 Importantly and interestingly, the direction of the fluctuations was often opposite to that found in the cited researchers’ experiments.
We proved that the group receiving CMG did not differ a lot from the control group in protein expression. In the course of further analysis, it was observed that the most significant differences in protein expression were observed not only between the control group and the group receiving TMG but also between the two treatment groups (CMG and TMG).
There were many significant differences in protein expression between the TMG and the control groups. The TMG group had higher expression of proteins from the redox enzyme complex, components of the respiratory chain (malate dehydrogenase), and proteins involved in the metabolism of glucose, lipids, and amino acids (triose-phosphate isomerase, mitochondrial aspartate aminotransferase). In addition, the expression of 60S acidic ribosomal protein was higher than in the control group. Compared to the control group, the TMG group also had higher expression of the alpha-3 subunit of glutathione S-transferase, but the expression of the glutathione S-transferase P subunit was lower. Asif found similar changes in rats treated with MMF, including higher expression of malate dehydrogenase, triose-phosphate isomerase, mitochondrial aspartate aminotransferase, and the alpha-1 and alpha-4 subunits of glutathione S-transferase.4 Other researchers did not observe such changes.5,6
In the TMG group, the expression of NADH oxidoreductase was significantly lower compared to expression in the control group. Klawitter et al found no change in the expression of this protein in a group receiving tacrolimus.6
We also observed a reduction in the expression of H-FABP compared to expression in the control group. H-FABP, in addition to its fatty-acid transport function, is a marker of distal renal tubular injury.18 Lamoureux et al found no effect of tacrolimus on the expression of H-FABP.5
In the TMG group, we observed lower expression of cytoplasmic actin and the MUP. Lamoureux et al found no effect of tacrolimus on the expression of actin.5 According to Klawitter’s study, tacrolimus does not contribute to altered expression of the MUP.6
The TMG group had higher expression of cytoplasmic isocitrate dehydrogenase, triose-phosphate isomerase, and aminoacylase compared to expression in the CMG group. Higher expression of aminoacylase may have a protective role against the toxic metabolites of MMF. Similar results have been presented by Asif et al, who observed higher expression of aminoacylase and triose-phosphate isomerase in the kidneys of rats treated with MMF.4 Klawitter did not find any effect of tacrolimus on the expression of NADH.6
Many more proteins in the TMG group had lower expression than in the CMG group. This phenomenon was most pronounced among redox enzymes and the components of the respiratory chain (thioredoxin, glucose-regulated protein 78 kDa, the 5A subunit of mitochondrial cytochrome c oxidase, the 6A1 subunit of mitochondrial cytochrome c oxidase). Pyridoxine kinase expression proved to be lower in the TMG group compared to expression in the other group. Lower expression of H-FABP, the MUP, and selenium-binding protein was also observed in this group. Asif et al showed higher expression of selenium-binding protein and pyridoxine kinase in the kidneys of rats treated only with MMF.4 Other researchers presented opposite results. Lamoureux et al found no influence of tacrolimus on the expression of thioredoxin and glucose-regulated protein 78 kDa or the 5A subunit of mitochondrial cytochrome c oxidase in HEK cells.5
In the present study, we also observed lower expression of the two subunits of the mitochondrial cytochrome c oxidase, which was not observed by other researchers.5
In the treatment groups, the expression of two proteins was ambivalent: the expression of mitochondrial aspartate aminotransferase was higher in the TMG group than in the CMG group, but the rats in the TMG group did not demonstrate the expression of mitochondrial aspartate aminotransferase spot 51 (SSP 1405). We observed a similar situation for the expression of aminoacylase 1A spot number 69 (SSP 5503): its activity was higher in the TMG group compared to the CMG group, whereas the pattern of aminoacylase 1A spot number 70 (SSP 5509) expression was the opposite.
Certainly, the results of the proteomic analysis were influenced by the application of three-drug regimens, including calcineurin inhibitors, MMF, and corticosteroids. Several of the changes observed in protein expression have been described previously.4–6 Most of the cited studies were based on single-drug treatment (cyclosporine, tacrolimus, or MMF). Additionally, the treatment groups were mainly compared to a control group, and the evaluation of protein expression differences between treatment groups was not standard in those studies.6 In our study on rats treated with different regimens, the changes in protein expression might have been caused by interactions between immunosuppressants. Despite significant differences in the expression of many proteins, we found no impact of those changes on the histopathological picture. Similar results have been presented by Klawitter.6
Summary and conclusion
In the proteomic analysis of rat kidneys, less pronounced differences in protein expression were observed between the control group and the CMG group. In the TMG group, higher expression of proteins responsible for renal drug metabolism, such as the glutathione S-transferase alpha-3 subunit and triose-phosphate isomerase, and lower cytoplasmic actin and MUP expression were observed compared to expression in the control group. In the TMG group, higher expression of proteins responsible for renal drug metabolism (aminoacylase) and a decrease in the expression of respiratory chain enzymes (thioredoxin-2) and markers of distal renal tubular damage (H-FABP) were observed in comparison with expression in the CMG group. Medications directly or indirectly (eg, by the intensification of oxidative stress) cause an entire series of changes in the expression of proteins in the kidney. Treatment schemes based on cyclosporin A have a much lower impact on the expression of proteins within the kidney compared to tacrolimus-based regimens. MMF in combination with tacrolimus has its own additional effect on the expression of kidney proteins in rats. This regimen causes a very significant increase in the expression of proteins responsible for drug metabolism and a decrease in the expression of proteins that are part of the respiratory chain and of markers of renal tubular damage. Despite the substantial differences in the expression of many proteins, there were no histopathological or functional changes within the examined kidneys.
Acknowledgments
Work was funded by the statutory budget of the Pomeranian Medical University.
Disclosure
The authors declare no conflicts of interest in this work.
References
Meier-Kriesche HU, Schold JD, Kaplan B. Long-term renal allograft survival: have we made significant progress or is it time to rethink our analytic and therapeutic strategies? Am J Transplant. 2004;4(8):1289–1295. | |
Brennan DC. Long-term trends in allograft survival. Adv Chronic Kidney Dis. 2006;13(1):11–17. | |
Myśliwiec M. Nefrologia. Wielka Interna. Warszawa: Medical Tribune Poland; 2009:458–459. Polish. | |
Asif AR, Armstrong VW, Voland A, Wieland E, Oellerich M, Shipkova M. Proteins identified as targets of the acyl glucuronide metabolite of mycophenolic acid in kidney tissue from mycophenolate mofetil treated rats. Biochimie. 2007;89(3):393–402. | |
Lamoureux F, Mestre E, Essig M, Sauvage FL, Marquet P, Gastinel LN. Quantitative proteomic analysis of cyclosporine-induced toxicity in a human kidney cell line and comparison with tacrolimus. J Proteomics. 2011;75(2):677–694. | |
Klawitter J, Klawitter J, Kushner E, et al. Association of immunosuppressant-induced protein changes in the rat kidney with changes in urine metabolite patterns: a proteo-metabonomic study. J Proteome Res. 2010;9(2):865–875. | |
van Westrhenen R, Aten J, Hajji N, et al. Cyclosporin A induces peritoneal fibrosis and angiogenesis during chronic peritoneal exposure to a glucose-based, lactate-buffered dialysis solution in the rat. Blood Purif. 2007;25(5–6):466–472. | |
Joffe I, Katz I, Sehgal S, et al. Lack of change of cancellous bone volume with short-term use of the new immunosuppressant rapamycin in rats. Calcif Tissue Int. 1993;53(1):45–52. | |
Jolicoeur EM, Qi S, Xu D, Dumont L, Daloze P, Chen H. Combination therapy of mycophenolate mofetil and rapamycin in prevention of chronic renal allograft rejection in the rat. Transplantation. 2003;75(1):54–59. | |
Katz IA, Takizawa M, Jaffe II, Stein B, Fallon MD, Epstein S. Comparison of the effects of FK 506 and cyclosporine on bone mineral metabolism in the rat. Transplantation. 1991;52(3):571–574. | |
Ma Y, Kobayashi T, Kuzuya T, et al. Is absorption profile of cyclosporine really important for effective immunosuppression? Biol Pharm Bull. 2006;29(2):336–342. | |
Schmitz V, Klawitter J, Bendrick-Peart J, et al. Metabolic profiles in urine reflect nephrotoxicity of sirolimus and cyclosporine following rat kidney transplantation. Nephron Exp Nephrol. 2009;111(4):e80–e91. | |
Skrzypczak WF, Ozgo M, Lepczynski A, Herosimczyk A. Defining the blood plasma protein repertoire of seven day old dairy calves – a preliminary study. J Physiol Pharmacol. 2011;62(3):313–319. | |
Perkowska-Ptasińska A. [Diagnosis of changes in the transplanted kidney]. Pol J Pathol. 2011;62(2 Suppl 1):s111–s149. Polish. | |
Shing CM, Fassett RG, Brown L, Coombes JS. The effects of immunosuppressants on vascular function, systemic oxidative stress and inflammation in rats. Transpl Int. 2012;25(3):337–346. | |
Rovira J, Marcelo Arellano E, Burke JT, et al. Effect of mTOR inhibitor on body weight: from an experimental rat model to human transplant patients. Transpl Int. 2008;21(10):992–998. | |
Sánchez-Pozos K, Lee-Montiel F, Pérez-Villalva R, et al. Polymerized type I collagen reduces chronic cyclosporine nephrotoxicity. Nephrol Dial Transplant. 2010;25(7):2150–2158. | |
Alter ML, Kretschmer A, Von Websky K, et al. Early urinary and plasma biomarkers for experimental diabetic nephropathy. Clin Lab. 2012;58(7–8):659–671. |
Supplementary materials
 | Table S1 Evaluation criteria |
 | Table S2 Proteins identified in the study groups of rats (control group, CMG, and TMG) |
 | Table S3 Characteristics of proteins where expression was different in the control group and CMG group |
 | Table S4 Characteristics of proteins where expression was different in the control group and TMG group |
 | Table S5 Characteristics of proteins where expression was different between the groups CMG and TMG |
 © 2014 The Author(s). This work is published and licensed by Dove Medical Press Limited. The
full terms of this license are available at https://www.dovepress.com/terms
and incorporate the Creative Commons Attribution
- Non Commercial (unported, 3.0) License.
By accessing the work you hereby accept the Terms. Non-commercial uses of the work are permitted
without any further permission from Dove Medical Press Limited, provided the work is properly
attributed. For permission for commercial use of this work, please see paragraphs 4.2 and 5 of our Terms.
© 2014 The Author(s). This work is published and licensed by Dove Medical Press Limited. The
full terms of this license are available at https://www.dovepress.com/terms
and incorporate the Creative Commons Attribution
- Non Commercial (unported, 3.0) License.
By accessing the work you hereby accept the Terms. Non-commercial uses of the work are permitted
without any further permission from Dove Medical Press Limited, provided the work is properly
attributed. For permission for commercial use of this work, please see paragraphs 4.2 and 5 of our Terms.