Back to Journals » Clinical Pharmacology: Advances and Applications » Volume 11
Effects of formulation types on pharmacodynamics of warfarin in patients with cerebral infarction and dysphagia
Authors Kim YJ, Jeong JW ![]() , Song Y
, Song Y ![]() , Koo TS
, Koo TS ![]()
Received 16 August 2018
Accepted for publication 8 February 2019
Published 13 March 2019 Volume 2019:11 Pages 51—56
DOI https://doi.org/10.2147/CPAA.S184232
Checked for plagiarism Yes
Review by Single anonymous peer review
Peer reviewer comments 2
Editor who approved publication: Professor Arthur E. Frankel
Young-Ji Kim,1,2 Jong-Woo Jeong,1 Youngshin Song,3 Tae-Sung Koo1
1Graduate School of New Drug Discovey and Development, Chungnam National University, Daejeon 305-764, Republic of Korea; 2Chungnam National University Hospital, Daejeon 305-764, Republic of Korea; 3Department of Nursing, College of Nursing, Chungnam National University, Daejeon 305-764, Republic of Korea
Purpose: The purpose of this study was to investigate the effects of the type of formulation on the efficacy of warfarin.
Materials and methods: The electronic medical records of patients with cerebral infarction, who were administered tablet or powder formulations of warfarin from 2013–2015, were retrospectively analyzed. Clinical data, changes in the international normalized ratio (INR), the warfarin dose, and the time to reach the plasma warfarin concentration that could induce an adverse effect, such as bleeding, were evaluated. Coefficients of variation of INR and of the warfarin dose, as well as the warfarin sensitivity index (WSI), were used to evaluate the INR stability. Statistical analysis of the data was performed using a independent t-test. Additionally, survival analysis was performed.
Results: The data showed that 57 and 137 patients were administered warfarin as powder and tablet formulations, respectively. We noted that INR, WSI, and INR/dose × body weight differed significantly between the two groups of patients. The median survival times to reach the plasma warfarin concentration that could induce adverse effects were 3.6 and 4.2 days of treatment with the powder and tablet formulations, respectively. The efficacy of warfarin was higher when the drug was administered as a powder than when it was administered as a tablet.
Conclusion: The findings of this study indicate that INR should be carefully monitored in the first 4 days of warfarin administration as a powder formulation.
Keywords: warfarin, pharmacodynamic, dysphagia, survival analysis
Introduction
Warfarin is an anticoagulant that delays blood clotting by blocking vitamin K epoxide reductase (VKOR). The drug is widely used to prevent and treat cerebral infarction caused by cardiac embolism, pulmonary embolism, or coronary artery occlusion.
Cerebral infarction can cause multiple physical disabilities, including swallowing difficulty (dysphagia), which frequently occurs because of a stroke.1 If dysphagia is not detected and managed in patients with cerebral infarction, it can lead to poor nutrition, pneumonia, and increased disability during acute stages.2
Patients with swallowing difficulties caused by a stroke require parenteral feeding via a nasogastric (NG) tube.3 These patients are often administered warfarin as an aqueous suspension via an NG tube. When oral drug formulations such as tablets are administered via an NG tube, changes in the pharmacokinetic/pharmacodynamic properties of the drug are observed; however, the changes usually depend on how the formulation was prepared. Administering warfarin via an NG tube may alter the amount of the drug that reaches the gastrointestinal tract because some amount of the drug remains on the luminal surface of the tube.4 Thus, it is important to determine the absorption and bioavailability of drugs that are administered via NG tubes. For example, Moore et al4 have studied the bioavailability and stability of rivaroxaban following administration of crushed tablets via an NG tube. The authors found that the plasma concentrations of rivaroxaban were similar, irrespective of whether the drug was administered as crushed tablets via an NG tube or swallowed as whole tablets.4 Warfarin is a highly soluble and permeable drug that belongs to class 1 in the biopharmaceutics classification system (BCS).5 According to the BCS framework, comparative dissolution testing can be performed for BCS class 1 drugs instead of a bioequivalence test; however, warfarin and other drugs that have narrow therapeutic ranges are exceptions to this rule.6
Currently, there are no reports on the effects of different warfarin formulations on the international normalized ratio (INR) or dose titration. The loading dose of warfarin is 5–10 mg, whereas the maximum daily dose is 0.75 mg/kg.7 Careless administration of warfarin can lead to severe bleeding complications. It has been reported that each year bleeding occurs in 2%–8% of patients who are administered warfarin, and 1%–3% of these patients cannot be administered.8 To prevent prolonged bleeding, warfarin-treated patients should be monitored by measuring their INR values by therapeutic drug monitoring (TDM).9
The purpose of the present study was to compare the efficacies of different warfarin formulations (powder and tablet) and to determine the survival time to reach a toxic warfarin concentration in patients with dysphagia.
Materials and methods
This retrospective analysis was conducted using the medical records of 228 patients who developed dysphagia following cerebral infarction that were admitted to the Chungnam National University Hospital (South Korea) between January 2013 and December 2015. Demographic and clinical data were collected from the patient medical records. Patients’ medical records were de-identified and maintained with confidentiality throughout the entire research process. The criteria for selection into the study included adult patients (>20 years old) who had dysphagia after cerebral infarction and were subsequently admitted to the Neurology Department and treated with warfarin. The records of the patients who were administered warfarin tablets (orally) or powder (through NG tubes) for 7 days were included in the analysis. The availability of data such as body weight (BWT), height, and laboratory blood test results (prothrombin time and INR) was also required for the inclusion in the study.
The exclusion criteria excluded patients who had been administered medications that interact (eg, menatetrenone, bone metabolism agents, antituberculosis agents, anticonvulsants, phenytoin, and carbamazepine) or interfere (eg, antibiotics) with warfarin, patients who were undergoing hemodialysis or peritoneal dialysis, and those who had liver dysfunction.
Although the records of 228 patients were initially selected, 34 patients were excluded from the study because their height or weight measurements were missing (n=24) or they had undergone dialysis (n=8) or were <20 years old (n=2). The patients were divided into two groups, based on the warfarin formulation they were administered, powder or tablet.
The clinical data were used to investigate changes in INR, the warfarin dose, and the time to reach a toxic warfarin concentration in the blood.
We performed the study in accordance with the Declaration of Helsinki, and the protocols used were approved by the Institutional Review Board of the Chungnam National University Hospital (IRB no. CNUH 2016-05-019). Patient consent was not required because this was a retrospective study.
The patient age, sex, height (cm), and BWT (kg); as well as the administered warfarin dose (mg), INR, and serum albumin level (g/dL), were recorded. Coefficients of variation (CVs) were calculated for the warfarin dose and INR by dividing each standard deviation by the average warfarin dose and INR values, respectively. The body surface area (BSA) and warfarin sensitivity index (WSI) were calculated as follows:
- BSA (m2) = √([Height) (cm)×BWT (kg)]/360010
- WSI = INR/warfarin dose (mg)/BSA (m2)
The time to reach the plasma warfarin concentration that could induce an adverse effect, such as bleeding, was recorded as the number of days of treatment until a dose of warfarin was skipped because INR was ≥3.
Descriptive statistics, Fisher’s exact test, and an independent t-test were used to compare demographic data between the two groups. An independent two-sample t-test was conducted to compare the warfarin dose and INR between the groups. Life table survival analysis (Gehan’s generalized Wilcoxon method) was used to confirm the time at which a toxic warfarin concentration was reached (INR ≥3). Statistical analyses were performed using SPSS version 22.0 (IBM Corporation, Armonk, NY, USA). P-values<0.05 were considered statistically significant.
Results
In total, the study sample comprised of 122 males and 72 females. There were 57 patients in the powder group (age: 76.00±11.79 years; height: 160.66±8.74 cm; BWT: 55.12±12.69 kg; and BSA: 1.56±0.21 m2) and 137 patients in the tablet group (age: 68.47±11.38 years; height: 163.02±9.19 cm; BWT: 64.23±12.53 kg; and BSA: 1.70±0.20 m2). The mean serum albumin level in the powder group was 3.42±0.43 g/dL, whereas that in the tablet group was 3.77±0.35 g/dL (Table 1).
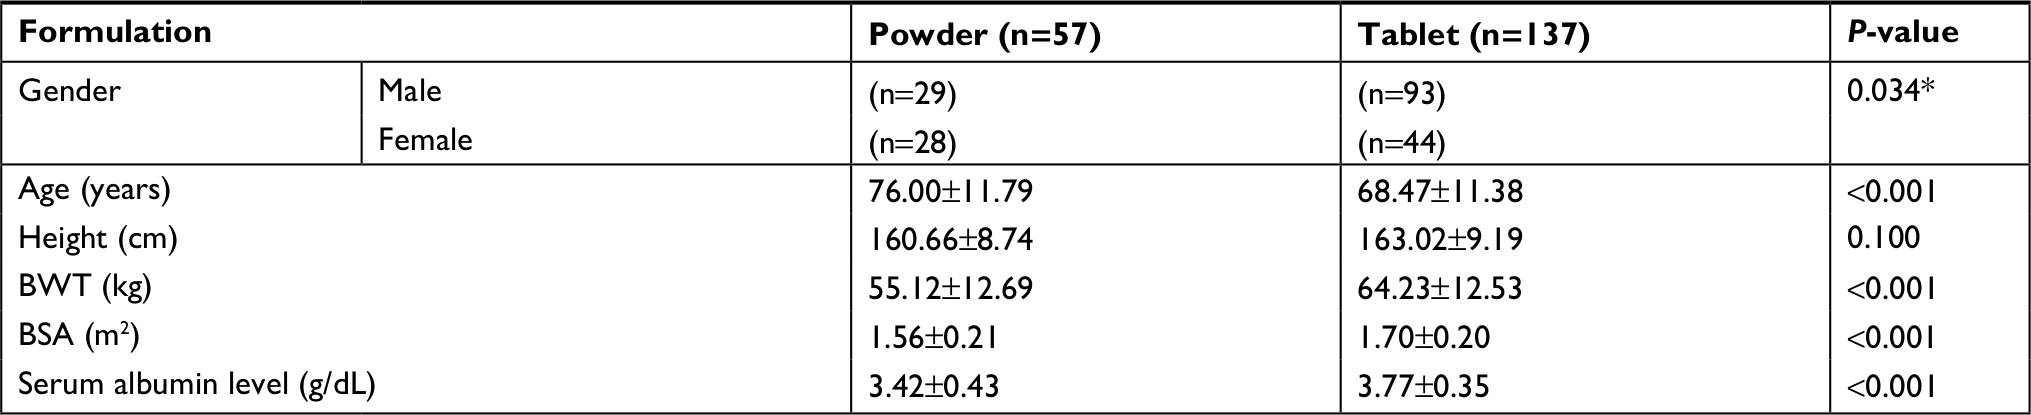 | Table 1 Baseline characteristics of the study patients (n=194) Notes: Data are presented as the number of participants or the mean ± SD. *Fisher’s exact test. Abbreviations: BWT, body weight; BSA, body surface area. |
To compare the warfarin doses between the groups, the mean doses and the total sums of doses for 7 days were calculated. The daily warfarin dose in the powder group was significantly lower than that in the tablet group (3.12±1.12 mg and 3.83±0.93 mg, respectively; P<0.001). The sum of the warfarin doses taken over 7 days (21.83±7.84 mg vs 26.81±6.56 mg; P<0.001) and the loading warfarin dose (7.33±2.87 mg vs 8.69±2.24 mg; P=0.002) were also significantly lower in the powder group than in the tablet group, respectively. The dose/BSA ratio was significantly lower in the powder group than in the tablet group (2.01±0.71 mg vs 2.26±0.50 mg, respectively, P=0.020; Table 2, and Figure 1). However, there was no significant difference in the dose/BWT ratios between the two groups (0.06±0.02 mg/kg vs 0.06±0.01 mg/kg, P=0.469; Table 2).
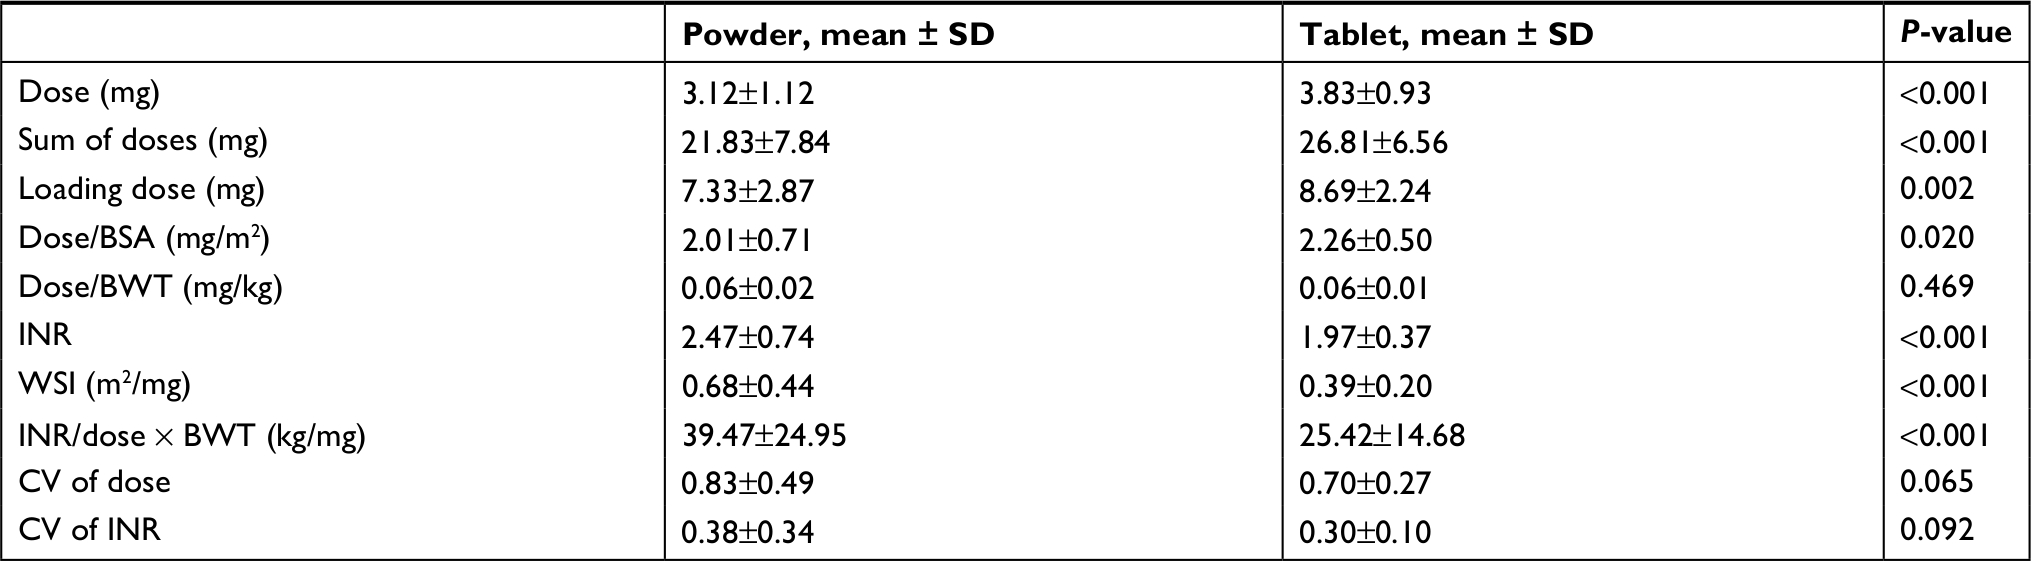 | Table 2 Comparison of average doses, pharmacodynamic parameters, and coefficients of variation between the two groups Note: Data are presented as the mean ± SD. Abbreviations: BWT, body weight; CV, coefficient of variation; INR, international normalized ratio; WSI, warfarin sensitivity index; BSA, body surface area. |
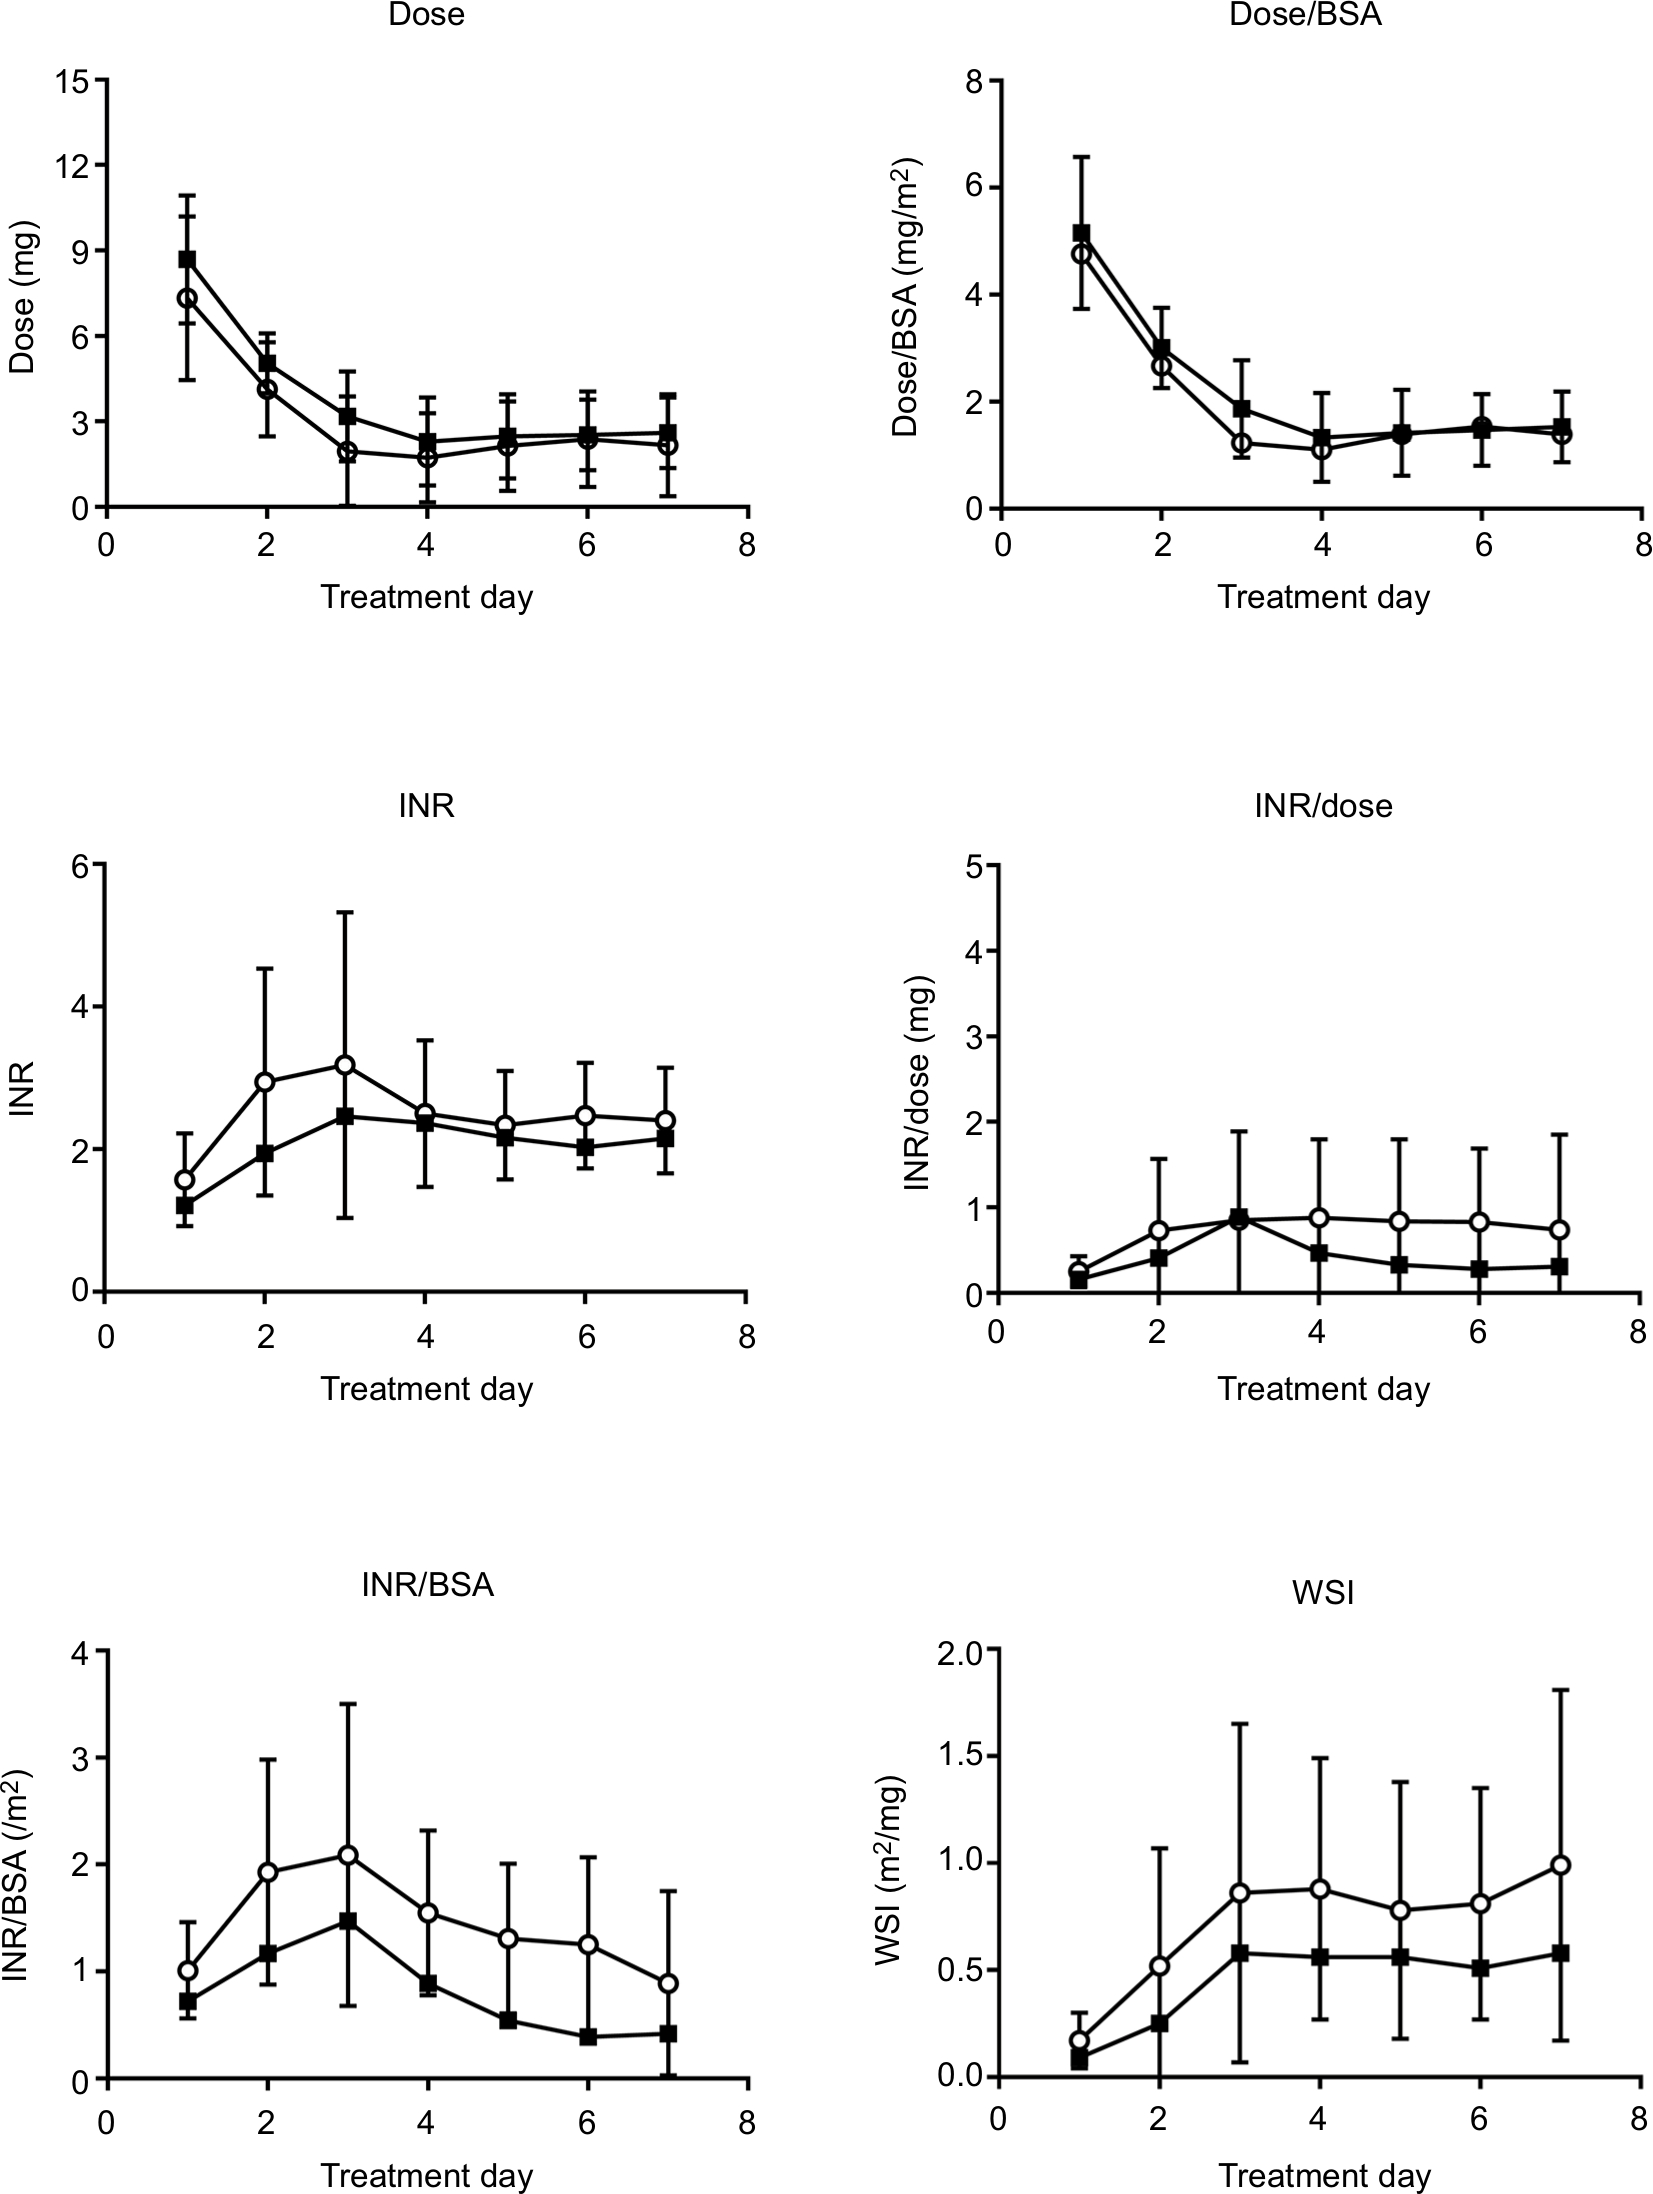 | Figure 1 Comparison of doses and pharmacodynamics of warfarin between the powder (○) and tablet (▪) groups. Abbreviations: BSA, body surface area; INR, international normalized ratio; WSI, warfarin sensitivity index. |
Furthermore, there were significant differences in INR, WSI, and INR/dose × BWT between the two groups. The patients in the powder group had significantly higher INR values than those in the tablet group did (2.47±0.74 vs 1.97±0.37, respectively). Additionally, WSI (0.68±0.44 vs 0.39±0.20) and the INR/dose × BWT values (39.47±24.95 vs 25.42±14.68) were significantly higher in the powder group than in the tablet group, respectively. All the pharmacodynamic parameters in the powder group were higher than the respective values in the tablet group (Table 2, Figure 1). The CV values of the warfarin doses were 0.83±0.49 in the powder group and 0.70±0.27 in the tablet group. The CV values of INRs were 0.38±0.34 in the powder group and 0.30±0.10 in the tablet group. However, the differences in CVs of the warfarin doses and INRs between the two groups were not statistically significant (P=0.065 and P=0.092, respectively; Table 2).
The life table survival analysis showed that the number of patients who had a toxic plasma concentration of warfarin (INR ≥3) was 28/57 (49.1%) in the powder group and 23/137 (16.8%) in the tablet group. In the powder group, the cumulative rates at which the toxic concentration was reached on days 2, 3, 4, and 5 were 14.3%, 75%, 89.3%, and 96.4%, respectively, and the median time was 3.6 days. Meanwhile, in the tablet group, the cumulative rates at which the toxic concentration was reached on days 3, 4, and 5 were 30.4%, 91.3%, and 95.7%, respectively, and the median time was 4.2 days. The median survival times were statistically different between the two groups (P=0.001; Figure 2).
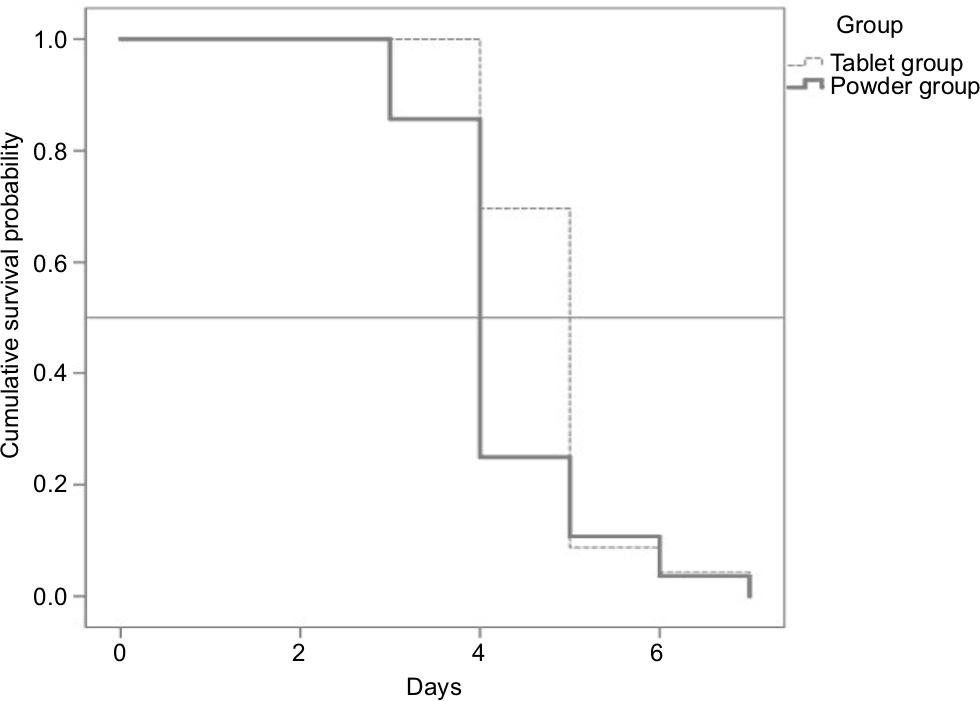 | Figure 2 Survival curves of the time to reach the plasma warfarin concentration that could induce adverse effects, such as bleeding. Notes: Median survival time: tablet group = 4.2 days, powder group = 3.6 days; Wilcoxon (Gehan) statistics = 10.132, P=0.001. |
Discussion
Patients respond differently to warfarin; therefore, it is necessary to determine the appropriate dose by TDM.11 Additionally, clinical experience and relevant formulae and computer programs can be used. However, using a formula has not shown any particular benefit. Furthermore, computer programs do not consider the patient specificity, and studies have shown that there may be errors of up to 8%–26%.12–14
In the present study, the warfarin dose was determined using clinical and experimental methods. Personal errors made by physicians and the dose determination using clinical experience can result in inadequate prescriptions; therefore, it is necessary to establish appropriate protocols that would be applicable to individual patients. Differences in the pharmacodynamics and the dose of warfarin were noted for different formulations.
Lynn et al15 have suggested a 10% rule of thumb as the practical method for changing the warfarin dose, that is, calculating the dose in milligrams per week and adding or subtracting ~10% of the total sum of doses for a week. However, at a drug dosage of 1 mg/day, administered to elderly patients, it is reasonable to change the dose by only 5% since a 10% change may result in dose variations. The 10% dose is then increased; however, if the therapeutic range is not reached, a 20% increase is applied.16
In the present study, INR was higher in the powder group than in the tablet group (2.47±0.74 and 1.97±0.37, respectively; P<0.001). Nevertheless, the total dose over a 7-day period for the powder group was ~20% lower than that for the tablet group (21.83±7.84 mg vs 26.81±6.56 mg, respectively, P<0.001; Table 2). The above results did not reflect any effect on the weight; however, the administered doses were also compared after normalization to BSA and BWT. The dose/BSA ratio was ~10% lower in the powder group than in the tablet group (2.01±0.71 mg vs 2.26±0.50 mg, respectively; P=0.020); however, there was no significant difference in the doses normalized to BWT between the two groups (0.06±0.02 mg vs 0.06±0.01 mg; P=0.469).
Furthermore, WSI was ~74% higher in the powder group than in the tablet group (0.68±0.44 vs 0.39±0.20, respectively; P<0.001). Likewise, the INR/dose/BWT ratio was higher in the powder group than in the tablet group (39.47±24.95 vs 25.42±14.68, respectively, P<0.001; Table 2; Figure 1). These findings indicate that the efficacy of warfarin was higher in the powder group.
To compare the efficacies and stabilities of the two formulations, we calculated CV values of INRs and the doses. A lower CV value indicates a higher stability. There was no significant difference in the CV values of the doses or INRs between the two groups over a 7-day period (P=0.065 and P=0.092, respectively). However, the CV values of the doses were relatively high (0.83±0.49 vs 0.70±0.27), whereas those of INRs were relatively low (0.38±0.34 vs 0.30±0.10). These findings indicate that the warfarin doses were adjusted in the two groups to achieve target INR values of 2–3 (Table 2).
To determine the time when dose titration may be needed, the time to reach the toxic plasma concentration was assessed by survival analysis. In the powder formulation group, the toxic plasma concentration was found to be reached on day 3, which was 1 day earlier than when it was reached in the tablet group (Figure 2). This finding indicates that it is necessary to monitor INR on days 3 and 4 of administering warfarin powder to patients.
BCS class one drugs have higher solubility and/or permeability than class 2 and 4 drugs have. Consequently, no significant pharmacokinetic changes are expected when the formulation of a BCS class one drug is changed from tablet to powder.6 Although warfarin is a BCS class one drug,5 in the present study, the WSI value and INR normalized to the dose/BWT were ~74% and 55% higher, respectively, in the powder group than in the tablet group.
These findings indicate that the powder form of warfarin is more potent than the tablet form is. Therefore, when warfarin is administered as a powder, it is necessary to reduce the dose and pay more attention to the patient’s INR, especially on days 3 and 4 of administration. As recommended by Lynn et al,15 the warfarin dose should be reduced by 10%, followed by further adjustments, if required.
Warfarin decreases blood clotting by blocking VKORC1, which reactivates vitamin K1,7 and is mainly metabolized by CYP/CYP450 2C9 (CYP2C9).17,18 This study was conducted as a retrospective analysis of medical records; therefore, we could not confirm the dietary status of the patients to assess their intake of vitamins.
Furthermore, the CYP2C9*1/*1 (87%) and VKOR −1,639AA (89%) genotypes are predominant in Korea.19 Since all patients analyzed in this study were Koreans, future studies need to be conducted on patients from other ethnic groups.
To investigate the effects of serum albumin on the parameters measured, the patients were divided into cohorts based on their serum albumin levels (<3.5 or >3.5 g/dL). Similar WSI patterns were observed in both cohorts (0.66±0.15 and 0.42±0.08 in the patients with serum albumin levels <3.5 g/dL in the powder and tablet groups, respectively; 0.62±0.21 and 0.46±0.14 in the patients with serum albumin levels >3.5 g/dL in the powder and tablet groups, respectively), which indicated that serum albumin did not affect WSI.
Clinically, patients with dysphagia are often administered warfarin in the powder form without TDM. However, our findings showed that when warfarin was administered as a powder, its anticoagulation activity was ~1.5 times higher than that of warfarin administered in the tablet form. Additionally, the attainment of the plasma warfarin concentration that could induce adverse effects was noticed starting from day 3 of the treatment in the powder group, which was 1 day earlier than when it was observed in the tablet group. Therefore, it is recommended to reduce the warfarin dose by 50% when the drug is administered as a powder. In addition, it is important to monitor INR daily, especially within the first four days after treatment initiation.
Acknowledgment
This work was supported by the National Research Fund of Korea (NRF-2015M3A9B5053643) and the National Research Council of Science & Technology (DRC-15-01-KRICT).
Disclosure
The authors report no conflicts of interest in this work.
References
Hirsh J, Dalen J, Anderson DR, et al. Oral anticoagulants: mechanism of action, clinical effectiveness, and optimal therapeutic range. Chest. 2001;119(1 Suppl):8S–21S. | ||
Martino R, Foley N, Bhogal S, et al. Dysphagia after stroke: incidence, diagnosis, and pulmonary complications. Stroke. 2005;36(12):2756–2763. | ||
Wirth R, Smoliner C, Jäger M, et al. Guideline clinical nutrition in patients with stroke. Exp Transl Stroke Med. 2013;5(1):14. | ||
Moore KT, Krook MA, Vaidyanathan S, et al. Rivaroxaban crushed tablet suspension characteristics and relative bioavailability in healthy adults when administered orally or via nasogastric tube. Clin Pharmacol Drug Dev. 2014;3(4):321–327. | ||
Kasim NA, Whitehouse M, Ramachandran C, et al. Molecular properties of WHO essential drugs and provisional biopharmaceutical classification. Mol Pharm. 2004;1(1):85–96. | ||
Center for drug evaluation and research (CDER). Waiver of In Vivo Bioavailability and Bioequivalence Studies for Immediate-Release Solid Oral Dosage Forms Based On a Biopharmaceutics Classification System. Silver Spring, MD: U.S. Department of Health and Human Services; 2015. | ||
Hirsh J, Guyatt G, Albers GW, Harrington R, Schünemann HJ. Antithrombotic and thrombolytic therapy: American College of chest physicians’ evidence-based clinical practice guidelines (8th edition). Chest. 2008;133(6 Suppl):110S–112S. | ||
Esmerio FG, Souza EN, Leiria TL, Lunelli R, Moraes MA. Constant use of oral anticoagulants: implications in the control of their adequate levels. Arq Bras Cardiol. 2009;93(5):549–554. | ||
Keeling D, Baglin T, Tait C, et al. Guidelines on oral anticoagulation with warfarin - fourth edition. Br J Haematol. 2011;154(3):311–324. | ||
Mosteller RD. Simplified calculation of body-surface area. N Engl J Med. 1987;317(17):1098. | ||
O’Reilly RA, Aggeler PM. Determinants of the response to oral anticoagulant drugs in man. Pharmacol Rev. 1970;22(1):35–96. | ||
Ryan PJ, Gilbert M, Rose PE. Computer control of anticoagulant dose for therapeutic management. BMJ. 1989;299(6709):1207–1209. | ||
White RH, Zhou H, Romano P, Mungall D. Changes in plasma warfarin levels and variations in steady-state prothrombin times. Clin Pharmacol Ther. 1995;58(5):588–593. | ||
Britt RP, James AH, Raskino CL, Thompson SG. Factors affecting the precision of warfarin treatment. J Clin Pathol. 1992;45(11):1003–1006. | ||
Ansell JE, Oertel LB, Wittkowsky AK. Managing Oral Anticoagulation Therapy: Clinical and Operational Guidelines. Gaithersburg, MD: Aspen Publishers, Inc.; 1997. | ||
Oertel L. Managing maintenance therapy. In: Ansell J, Oertel L, Wittkowsky A, editors. Managing Oral Anticoagulation Therapy. 2nd ed. St Louis, MO: Wolters Kluwer Health, Inc.; 2005:1–5. | ||
Kaminsky LS, Zhang ZY. Human P450 metabolism of warfarin. Pharmacol Ther. 1997;73(1):67–74. | ||
Wadelius M, Chen LY, Downes K, et al. Common VKORC1 and GGCX polymorphisms associated with warfarin dose. Pharmacogenomics J. 2005;5(4):262–270. | ||
Kwon A, Jo SH, Im HJ, et al. Pharmacogenetic distribution of warfarin and its clinical significance in Korean patients during initial anticoagulation therapy. J Thromb Thrombolysis. 2011;32(4):467–473. |
 © 2019 The Author(s). This work is published and licensed by Dove Medical Press Limited. The
full terms of this license are available at https://www.dovepress.com/terms
and incorporate the Creative Commons Attribution
- Non Commercial (unported, 3.0) License.
By accessing the work you hereby accept the Terms. Non-commercial uses of the work are permitted
without any further permission from Dove Medical Press Limited, provided the work is properly
attributed. For permission for commercial use of this work, please see paragraphs 4.2 and 5 of our Terms.
© 2019 The Author(s). This work is published and licensed by Dove Medical Press Limited. The
full terms of this license are available at https://www.dovepress.com/terms
and incorporate the Creative Commons Attribution
- Non Commercial (unported, 3.0) License.
By accessing the work you hereby accept the Terms. Non-commercial uses of the work are permitted
without any further permission from Dove Medical Press Limited, provided the work is properly
attributed. For permission for commercial use of this work, please see paragraphs 4.2 and 5 of our Terms.