Back to Journals » Cancer Management and Research » Volume 11
Effects of dynein light chain Tctex-type 3 on the biological behavior of ovarian cancer
Authors Zhou L, Ye M, Xue F, Lu E ![]() , Sun LZ
, Sun LZ ![]() , Zhu X
, Zhu X ![]()
Received 13 February 2019
Accepted for publication 27 May 2019
Published 1 July 2019 Volume 2019:11 Pages 5925—5938
DOI https://doi.org/10.2147/CMAR.S205158
Checked for plagiarism Yes
Review by Single anonymous peer review
Peer reviewer comments 2
Editor who approved publication: Dr Chien-Feng Li
Lulu Zhou,1 Miaomiao Ye,1 Fang Xue,1 Ermei Lu,1 Lu-Zhe Sun,2 Xueqiong Zhu1
1Department of Obstetrics and Gynecology, The Second Affiliated Hospital of Wenzhou Medical University, Wenzhou 325027, People’s Republic of China; 2Departments of Cell Systems & Anatomy, School of Medicine, University of Texas Health Science Center, San Antonio, TX, USA
Objective: To investigate dynein light chain Tctex-type 3 (DYNLT3) protein expression in ovarian epithelial lesions and explore the effects and related mechanisms of DYNLT3 in terms of the biological behavior of ovarian cancer.
Materials and methods: Initially, expression of the DYNLT3 protein in ovarian epithelial lesions was detected by immunohistochemical staining, and the prognostic value of DYNLT3 mRNA expression in ovarian cancer patients was assessed using the Kaplan-Meier plotter database. Then, the mRNA and protein expression of DYNLT3 in IOSE80 normal ovarian epithelial cells and SKOV3 ovarian cancer cells was evaluated by quantitative real-time polymerase chain reaction and Western blotting respectively, and the proliferation, apoptosis, migration and invasion of SKOV3 cells after DYNLT3 over-expression and under-expression were investigated by CCK-8 assays and immunofluorescence staining, flow cytometry, wound healing assays and Transwell invasion assays, respectively. Furthermore, the expression of the proliferation-related proteins PCNA and Ki-67 and the invasion- and migration-related proteins Ezrin, Fascin, MMP2 and MMP9 in cells was examined by Western blotting.
Results: The protein expression of DYNLT3 gradually increased during the progression of ovarian epithelial lesions, and was related to the development of ovarian cancer. High expression of DYNLT3 mRNA was related to poor overall survival and progression free survival, especially in serous ovarian cancer patients. In addition, overexpression of DYNLT3 promoted SKOV3 cell proliferation, invasion and migration. The corresponding results were also verified by a DYNLT3 knockdown assay. Moreover, DYNLT3 increased cell proliferation, which was related to Ki-67 expression. Besides, DYNLT3 enhanced cell invasion and migration through regulating Ezrin, but not Fascin, MMP2 or MMP9.
Conclusion: DYNLT3 exerts pro-tumoral effects on ovarian cancer through promoting cell proliferation, migration and invasion, possibly via regulating the protein expression of Ki-67 and Ezrin. DYNLT3 may be a potential prognostic predictor in ovarian cancer.
Keywords: DYNLT3, ovarian cancer, proliferation, invasion, migration, prognosis
Introduction
Ovarian cancer is a common malignancy of the female reproductive organs; the incidence rate ranks third only to cervical cancer and uterine cancer, and the mortality rate is the highest among female genital malignancies.1 Sex hormones, environmental factors and family history (genetics) could play a vital role in the occurrence of ovarian lesions.2,3 In 2018, there were approximately 22,240 new cases and 14,070 deaths in the United States, and the annual death rate for ovarian cancer accounted for 5% of the female cancer deaths.1 Due to the lack of early effective diagnostic methods, chemotherapeutic drug resistance and other reasons, the mortality rate of ovarian cancer is second only to that of breast cancer, which poses a serious threat to women’s health.4,5 Currently, treatment for ovarian cancer includes comprehensive staging surgery, tumor cytoreductive surgery and subsequent adjuvant chemotherapy.6 With the development of surgery and targeted drug therapy, the prognosis of ovarian cancer patients has improved significantly, but the five-year survival rate is still only approximately 30%.7
DYNLT3 is a member of the cytoplasmic dynein light chain Tctex family. It is located on human chromosome Xp21 and is mainly distributed in the centromere, nucleus, cytoplasm and microtubules. DYNLT3 interacts with the mitotic protein BUb3 and special AT-rich sequence-binding protein-1 (SATB1) to regulate the processes of mitosis and meiosis, which play a crucial role in chromosome binding.8,9,10 Therefore, we speculated that DYNLT3 may participate in the occurrence and development of malignant tumors. To date, only two studies have investigated the expression of the DYNLT3 gene in malignant tumors, and the results were inconsistent. Karagoz et al.11 showed that DYNLT3 expression was significantly decreased in esophageal squamous cell carcinoma and that DYNLT3 may be a tumor suppressor. Another study reported that the DYNLT3 gene was a candidate oncogene in salivary gland adenoid cystic carcinoma.12 However, the role of the DYNLT3 gene in ovarian cancer has not been reported. In our previous study, we found by searching the Human Protein Atlas database (https://www.proteinatlas.org/) that the DYNLT3 protein was positively expressed in human ovarian cancer tissues but not expressed in normal ovarian tissues. This pattern suggests that the DYNLT3 gene may have be correlated with the development of ovarian cancer.
In the present study, we used immunohistochemical staining to detect DYNLT3 protein expression in ovarian serous cystadenocarcinoma, ovarian serous cystadenoma and normal ovarian epithelial tissues and searched the Kaplan-Meier plotter database to assess the prognostic value of DYNLT3 mRNA expression in ovarian cancer. In addition, quantitative real-time polymerase chain reaction (qRT-PCR) and Western blotting were used to examine DYNLT3 mRNA and protein expression, respectively, in normal ovarian epithelial IOSE80 cells and ovarian cancer SKOV3 cells. Subsequently, we transfected lentivirus to upregulate or downregulate the expression of the DYNLT3 gene in the SKOV3 ovarian cancer cell line, and we then explored the role of DYNLT3 in the biological behavior of ovarian cancer and elucidated the related molecular mechanisms.
Materials and methods
Tissue specimens
Archival paraffin-embedded tissue samples (n=60) namely, 20 normal ovarian epithelial, 20 ovarian serous cystadenoma, and 20 ovarian serous cystadenocarcinoma tissue samples were collected in the Second Affiliated Hospital of Wenzhou Medical University from October 2016 to December 2018. All tissue samples were obtained with the written informed consent of all the patients. This study was conducted in accordance with the Declaration of Helsinki and was approved by the the ethics committee of the Second Affiliated Hospital of Wenzhou Medical University. No patient had undergone any treatment and all diagnoses were confirmed surgically and pathologically.
Immunohistochemical staining
Immunohistochemical staining was carried out by a standard streptavidin-peroxidase method. A 4μm tissue was section cut from paraffin-embedded blocks and adhered and dried on poly-L-lysine precoated glass slides. Sections were deparaffinized and rehydrated after a 2h incubation at 65°C. Slides were heated in 10 mmol/L citrate buffer (pH 6.0) in a microwave oven to antigen retrieval. Endogenous peroxidase activity was inhibited by incubation for 15 min with 0.3% hydrogen peroxide. Then, normal goat serum was added to slides to prevent nonspecific binding. Slides were incubated with a polyclonal rabbit anti-human DYNLT3 (1:100) (Abcam, UK) antibody at 4°C overnight. A biotinylated goat anti-rabbit antibody was used as the secondary antibody, streptavidin peroxidase was used as the label, and diaminobenzidine was used as the chromogen. Nuclei were stained with hematoxylin. Appropriate positive and negative control slides were stained in parallel. DYNLT3 positive staining was indicated by a yellow or brown color of the cytoplasm and/or nucleus. Ten high-power images (40×objective, 10×eyepiece) were acquired for analysis. The positive staining area and cumulative light density value of the images were obtained by using Image-Pro Plus (IPP) software, and the ratio of the cumulative light density value/positive staining area of each image was calculated.
Database retrieval
The prognostic value of DYNLT3 mRNA expression in ovarian cancer was assessed in the Kaplan-Meier plotter database (http://kmplot.com). The DYNLT3 gene data were uploaded into the database according to the median expression level. Patient samples were divided into two groups (high vs low expression), and overall survival (OS) and progression-free survival (PFS) were investigated the by a Kaplan-Meier survival plot. The hazard ratios (HRs) with 95% confidence intervals (CIs) and the log rank P-values were calculated automatically on the webpage. A P-value of less than 0.05 was considered statistically significant.
Cell lines and cell culture
The human ovarian serous cystadenocarcinoma cell line SKOV3, normal ovarian epithelial cell line IOSE80 and renal epithelial cell line 293T were obtained from the Cell Bank of the Chinese Academy of Sciences, Shanghai, China. 293T and IOSE80 cells were cultured in Dulbecco’ Modified Eagle Medium (DMEM) and SKOV3 cells were maintained in RPMI −1640 medium supplemented with 10% fetal bovine serum (FBS), penicillin (100 U/ml), and streptomycin (0.1 mg/ml). All cells were incubated at 37 °C in 5% CO2.
Quantitative real-time PCR
The transcription levels of DYNLT3 mRNA in IOSE80 cells and SKOV3 cells were measured by quantitative real-time PCR (qRT-PCR). Total RNA was isolated from cells using TRIzol reagent according to the manufacturer’s instructions (Invitrogen, CA, USA). Total RNA (2 μg) was reverse transcribed to cDNA using a reverse transcription kit (Thermo Fisher Scientific, MA, USA). Quantitative real-time PCR was performed using SYBR Green PCR Mix from TransGen Biotech. The following primers were used: human DYNLT3 forward (5ʹ-TGCGACGAGGTTGGCTTCAA-3ʹ) and reverse (5ʹ-TGCAGTCCACTGGTTGATGTT-3ʹ); human GAPDH forward (5ʹ-AAGAAGGTGGTGAAGCAGG-3ʹ) and reverse (5ʹ-GTCAAAGGTGGAGGAGTGG-3ʹ). cDNA was subjected to qPCR to investigate the relative mRNA levels of DYNLT3 and GAPDH (as the internal control) in a LightCycler480 qPCR machine. All experiments were performed in triplicate. The mRNA expression of DYNLT3 was evaluated using the following arithmetic formula: Expression =2−∆∆Ct, where ∆Ct = Ct (DYNLT3) – Ct (GAPDH) and ∆∆Ct = ∆Ct (sample) – ∆Ct (control).
Western blotting
Total protein was extracted from cells with Radio-Immunoprecipitation Assay and Phenylmethanesulfonyl fluoride. 50 μg protein was separated by 12% Sodium Dodecyl Sulfate-Polyacrylamide Gel Electrophoresis (SDS-PAGE) and transferred to Polyvinylidene Fluoride membranes. After blocking with Tris-buffered saline with 0.1% Tween-20 (TBST) containing 5% nonfat dried milk, membranes were washed with TBST and incubated separately with antibodies against DYNLT3 (1:500; Abcam, Biotechnology), Tubulin (1:2,000; CST, Biotechnology), PCNA (1:2,000; CST, Biotechnology), Ezrin (1:1,000; CST, Biotechnology), Fascin (1:1,000; Abcam, Biotechnology), MMP2 (1:1,000; CST, Biotechnology), and MMP9 (1:1,000; CST, Biotechnology) at 4°C overnight. The next day, after washing in TBST, membranes were incubated with secondary antibodies (1:5,000 dilution) for 2h at room temperature. Then, membranes were washed in TBST again, and protein bands were detected with enhanced chemiluminescence (ECL) reagents. All experiments were performed in triplicate. The relative protein expression was evaluated using the following arithmetic formula: relative protein expression = gray value of protein of interest/gray value of Tubulin.
Production of lentivirus and transduction of target cells
Small hairpin RNA (shRNA) targeting DYNLT3 and having a sequence of -CCGGTCTATACAGCATCGTTTAAATCTCGAGATTTAAACGATGCTGTATAGATTTTTG- was constructed and inserted into the lentiviral expression vector TRC2-pLKO-puro-shC. DYNLT3 cDNA with a sequence of -ATGGAGGAGTACCATCGCCACTGCGACGAGGTTGGCTTCAATGCTGAGGAAGCCCACAATATTGTCAAAGAGTGTGTAGATGGGGTTTTAGGTGGTGAAGATTATAATCACAACAACATCAACCAGTGGACTGCAAGCATAGTGGAACAATCCTTAACACACCTGGTTAAGTTGGGAAAAGCCTATAAATATATTGTGACCTGTGCAGTGGTCCAGAAGAGCGCATATGGCTTTCACACAGCCAGCTCCTGTTTTTGGGATACCACATCTGATGGAACCTGTACCGTAAGATGGGAGAACCGGACCATGAACTGTATTGTCAACGTTTTTGCCATTGCTATTGTTCTTTTGA- was inserted into the lentiviral expression vector pLVX-IRES-ZsGreen1. Two packaging plasmids (psPAX2 (0.75 μg) and pMD2.G (1.9 μg)), TRC2-pLKO-puro-shDYNLT3 (2.5 μg), DYNLT3-pLVX-IRES-ZsGreen1 (2.5 μg) and two control vectors (each 2.5 μg) were transfected into 293T cells for 48h using Lipofectamine 2000 (Invitrogen, CA, USA). Lentiviral particles were harvested and filtered for infection of SKOV3 cells in combination with polybrene. To screen for cells with stable overexpression of DYNLT3, infected green fluorescent protein-positive cells were sorted by flow cytometry; cells with DYNLT3 downregulation were selected by 2 μg/ml puromycin.
CCK-8 assay
Cells were seeded in 96-well plates (3×10³ cells/well). After 24h, the medium was changed, and CCK-8 solution (10 μL/well) and RPMI-1640 medium (90 μL/well) were added and incubated at 37°C for 3h. The absorbance at wavelength of 450 nm was measured on a BioTek plate reader (Bio-Rad, USA). The experiments were repeated three times.
Flow cytometry
Cells were plated in culture dishes at a density of 1×10⁵ cells/dish. At 70–80% confluence, cells were digested and resuspended in binding buffer at a concentration of 1×10⁶ cells/ml. Then, according to the manufacturer’s protocol, cells were stained with annexin V-FITC/propidium iodide or PE/7-AAD. The percentage of apoptotic cells was assessed by flow cytometry after cells were stained for 15 min. The experiments were repeated three times.
Wound healing assay
Cells were seeded 1×10⁶ cells/well (6-well plate). After cells reached 90% confluence, a wound was simulated on the cell monolayer by scratching with a sterile pipette tip, and the cells were washed with PBS twice to remove cell debris. Fresh medium was added and incubated at 37°C in 5% CO2. The wound area was measured using ImageJ software (NIH, MD, USA). The percentages of the wound areas were calculated as the area at 24h vs the area at 0h in each group.
Transwell invasion assay
The polycarbonate filter membrane (diameter 6.5 mm, pore size 8 μm; Corning, USA) at the bottom of Transwell chambers was coated with 60 μL of Matrigel (BD Pharmingen, CA, USA) and air dried in a laminar hood overnight for the invasion assay. A total of 20,000 cells/well in serum-free medium were seeded in the upper inserts in triplicate. Then, 200 μL of medium containing 10% FBS was added to the lower chambers. After 24h, cells that did not penetrate the polycarbonate membrane at the bottom of the chamber were removed with a cotton swab. Then, invaded cells were fixed with 4% paraformaldehyde for 20 min and stained with 1% crystal violet for 10 min. Five fields of view were selected randomly under a microscope (Nikon, Japan), and the cells that penetrated the membrane were counted.
Immunofluorescence staining
Cells were seeded on glass coverslips in 6-well plates. After 24h, coverslips were washed with PBS. Then, cells were fixed and permeabilized for 20 min and blocked with 1% bovine serum albumin (BSA). Cells were incubated with an anti-mouse Ki-67 antibody (1:100 CST, Biotechnology) overnight at 4°C, followed by a FITC -conjugated goat anti-mouse secondary antibody (Invitrogen, CA, USA). Nuclei were stained with 4ʹ,6-diamidino-2-phenylindole dilactate (DAPI) and visualized by fluorescence microscopy. Ki-67-positive staining was indicated by a red color in nuclei. IPP software was used to calculate the positive staining area and cumulative light density value in each image, and the ratio of the cumulative light density value to the positive staining area in each image was calculated.
Statistical analysis
Statistical analysis was performed with SPSS 19.0 statistical software. The data for each group were continuous variables with normal distributions, and multigroup differences were analyzed with one-way analysis of variance followed by the least significant difference test or Dunnett’s T3 test. P<0.05 was considered to be statistically significant.
Results
The expression of the DYNLT3 protein was evidenced by intensely positive staining in ovarian carcinoma
The expression of the DYNLT3 protein in ovarian serous cystadenocarcinoma, ovarian serous cystadenoma and normal ovarian epithelium is shown in Figure 1. Ovarian serous cystadenocarcinoma consistently showed intense positive staining for DYNLT3. Ovarian serous cystadenoma showed moderate positive staining for DYNLT3. DYNLT3 staining was very weak in normal ovarian epithelium. The results showed that DYNLT3 expression progressively increased from normal ovarian epithelium to neoplasms (P<0.05).
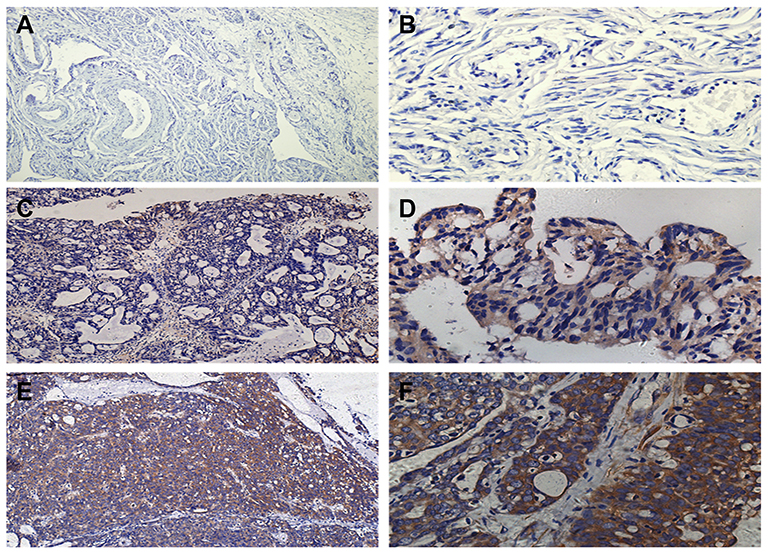 |
Figure 1 The expression of DYNLT3 protein in different ovarian epithelial lesions. (A) Image of staining with DYNLT3 in normal ovarian epithelial tissue (×100). (B) Image of staining with DYNLT3 in normal ovarian epithelial tissue (×400). (C) Image of staining with DYNLT3 in ovarian serous cystadenoma tissue (×100). (D) Image of staining with DYNLT3 in ovarian serous cystadenoma tissue (×400). (E) Image of staining with DYNLT3 in ovarian serous cystadenocarcinoma tissue (×100). (F) Image of staining with DYNLT3 in ovarian serous cystadenocarcinoma tissue (×400). |
DYNLT3 mRNA expression was correlated with poor prognosis in ovarian cancer patients
Via the Kaplan-Meier plotter database, the OS of 1656 patients and the PFS of 1435 patients with ovarian cancer were investigated. As shown in Figure 2, DYNLT3 mRNA expression was significantly correlated with shorter OS (HR (95% CI) =1.18 (1.02–1.36), P=0.027) and PFS (HR (95% CI) =1.18 (1.03–1.35), P=0.018) times in all ovarian cancer patients. Furthermore, the prognostic value of DYNLT3 in ovarian cancer with different histological subtypes, including serous and endometrioid, was assessed. For serous ovarian cancer patients, high expression of DYNLT3 mRNA was associated with poor OS (HR (95% CI) =1.22 (1.02–1.46), P=0.026) and PFS (HR (95% CI) =1.2 (1.04–1.39), P=0.012). For endometrioid ovarian cancer patients, high expression of DYNLT3 mRNA was related to improved PFS (HR (95% CI) =0.25 (0.1–0.64), P=0.0018) but not related to OS (HR (95% CI) =447,707,887.65 (0-lnf), P=0.057).
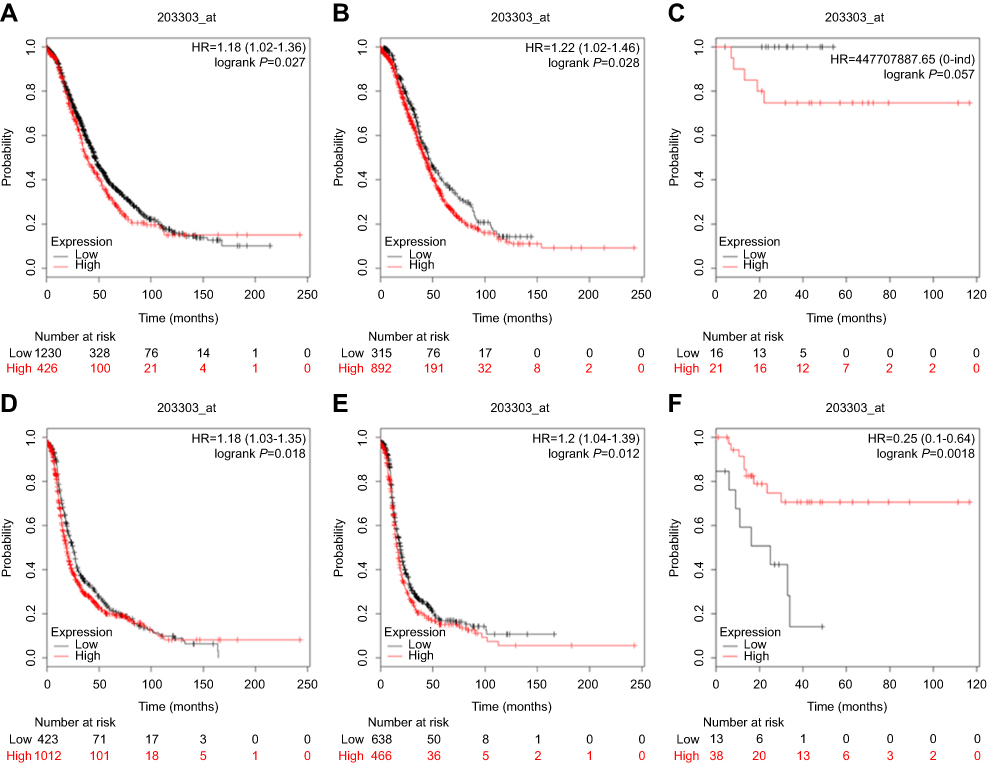 |
Figure 2 The prognostic value of DYNLT3 expression in www.kmplot.com. (A) overall survival curve is plotted for all ovarian cancer patients. (B) overall survival curve is plotted for serous ovarian cancer patients. (C) overall survival curve is plotted for endometrioid ovarian cancer patients. (D) progression free survival curve is plotted for all ovarian cancer patients. (E) progression free survival curve is plotted for serous ovarian cancer patients. (F) progression free survival curve is plotted for endometrioid ovarian cancer patients. Abbreviations: OS, overall survival; PFS, progression free survival. |
DYNLT3 mRNA and protein expression was higher in ovarian cancer SKOV3 cells than in normal ovarian epithelial IOSE80 cells
The DYNLT3 mRNA and protein expression levels in both normal ovarian epithelial IOSE80 cells and ovarian cancer SKOV3 cells were determined by qRT-PCR and Western blotting, respectively. The expression of DYNLT3 mRNA and protein was significantly higher in SKOV3 cells than in IOSE80 cells (P<0.05) (Figure 3A and B).
 |
Figure 3 The expression of DYNLT3 mRNA and protein. (A) The expression of DYNLT3 mRNA in IOSE80 and SKOV3 was detected by qRT-PCR. (B) The expression of DYNLT3 protein in IOSE80 and SKOV3 was detected by Western blot. (C) DYNLT3 protein expression in SKOV3 cells transduced with DYNLT3-pLVX-IRES-ZsGreen1 lentivirus. (D) DYNLT3 protein expression in SKOV3 cells transduced with TRC2-pLKO-puro-shDYNLT3 lentivirus. Data are expressed as mean ± standard deviation from triplicate experiments (*P<0.05). Abbreviations: BC-OE, over-expression blank control group; NC-OE, over-expression vector control group; OE-DYNLT3, DYNLT3-overexpression group; BC-KD, knock-down blank control group; NC-KD, knock-down vector control group; KD-DYNLT3, DYNLT3-knock-down group. |
Lentivirus-mediated up-regulation and down-regulation of DYNLT3 in ovarian cancer cells
As shown in Figure 3, SKOV3 cells transfected with lentivirus expressing DYNLT3-pLVX-IRES-ZsGreen1 exhibited dramatically increased DYNLT3 gene expression, and those transfected with lentivirus expressing TRC2-pLKO-puro-shDYNLT3 exhibited distinctly suppressed DYNLT3 expression (P<0.05). In addition, the control vector had no effect on DYNLT3 expression (P>0.05) (Figure 3C and D).
DYNLT3 promoted the proliferation of ovarian cancer cells
The CCK-8 assay showed that SKOV3 cell proliferation in the DYNLT3 overexpression group (OD value: 1.31±0.18) was significantly enhanced compared with that in the overexpression blank control group (OD value: 0.98±0.11) and the overexpression vector control group (OD value: 0.99±0.13) (P<0.05).
Conversely, cell proliferation in the DYNLT3 knockdown group (OD value: 0.90±0.18) was significantly inhibited compared with that in the knockdown blank control group (OD value: 1.17±0.12) and the knockdown vector control group (OD value: 1.15±0.23) (Figure 4A).
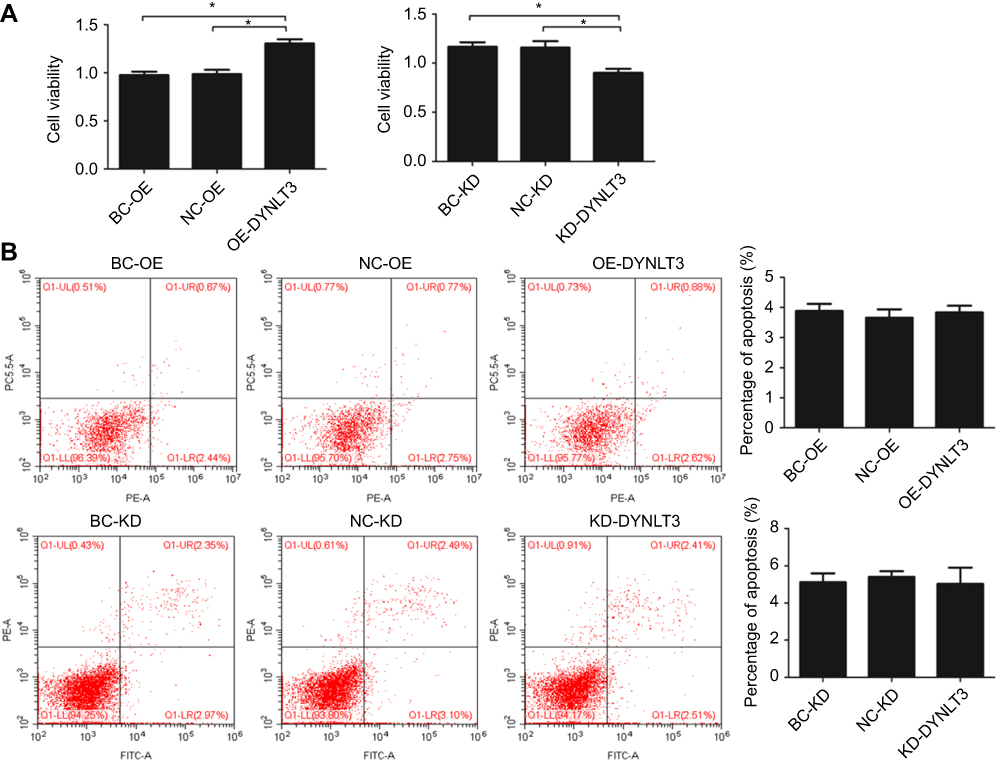 |
Figure 4 The effect of DYNLT3 on the proliferation and apoptosis of ovarian cancer cell. (A) The effect of DYNLT3 on the proliferation of SKOV3 cells. (B) The effect of DYNLT3 on the apoptosis of SKOV3 cells. Data are expressed as mean ± standard deviation from triplicate experiments (*P<0.05). Abbreviations: BC-OE, over-expression blank control group; NC-OE, over-expression vector control group; OE-DYNLT3, DYNLT3-overexpression group; BC-KD, knock-down blank control group; NC-KD, knock-down vector control group; KD-DYNLT3, DYNLT3-knock-down group. |
DYNLT3 had no effect on the apoptosis of ovarian cancer cells
The flow cytometry results showed that the percentage of apoptotic cells in the DYNLT3 overexpression group (3.83±0.35%) was not significantly different from that in the overexpression blank control group (3.88±0.32%) or the overexpression vector control group (3.66±0.41%) (P>0.05). Similarly, there was also no significant difference in the percentage of apoptotic SKOV3 cells among the knockdown blank control group (5.12±0.43%), knockdown vector control group (5.41±0.66%) and DYNLT3 knockdown group (5.03±1.02%), (P>0.05) (Figure 4B).
DYNLT3 promoted the migration and invasion of ovarian cancer cells
The migration ability of SKOV3 cells was assesses by a wound healing assay. The results showed that overexpression of DYNLT3 significantly increased the healed area relative to that in the overexpression blank control group and the overexpression vector control group. As expected, the number of migrated cells was appreciably reduced in the DYNLT3 knockdown group (healed area: 40.56±5.15%) compared with that in the knockdown blank control group (healed area: 62.96±7.46%) and the knockdown vector control group (healed area: 65.27±7.27%) (P<0.05) (Figure 5A).
 |
Figure 5 The effect of DYNLT3 on ovarian cancer cell migration and invasion. (A) Cell migration was evaluated by Wound Healing method (×100). (B) Cell invasion was evaluated by transwell invasion assay (×100). Data are expressed as mean ± standard deviation from triplicate experiments (*P<0.05). Abbreviations: BC-OE, over-expression blank control group; NC-OE, over-expression vector control group; OE-DYNLT3, DYNLT3-overexpression group; BC-KD, knock-down blank control group; NC-KD, knock-down vector control group; KD-DYNLT3, DYNLT3-knock-down group. |
The invasion ability of SKOV3 cells was assessed via a Transwell invasion assay. As shown in Figure 5B, overexpression of DYNLT3 markedly promoted the invasion of SKOV3 cells. Conversely, downregulation of DYNLT3 dramatically decreased the number of SKOV3 cells that penetrated the membrane (invaded cell number: 104.86±20.76) compared to that in the knockdown blank control group (invaded cell number: 263.29±32.78) and the knockdown vector control group (invaded cell number: 257.57±36.29) (P<0.05).
DYNLT3 affected the expression of the proliferation-related protein ki-67 in ovarian cancer cells
Immunofluorescence assays demonstrated that upregulating the expression of DYNLT3 distinctly increased the fluorescence intensity of Ki-67 in the DYNLT3 over-expression group compared to that in the two control groups (P<0.05). Conversely, the fluorescence intensity of Ki-67 in the DYNLT3 knockdown group was significantly decreased compared with that in the knockdown blank control group and the knockdown vector control group (P<0.05) (Figure 6A).
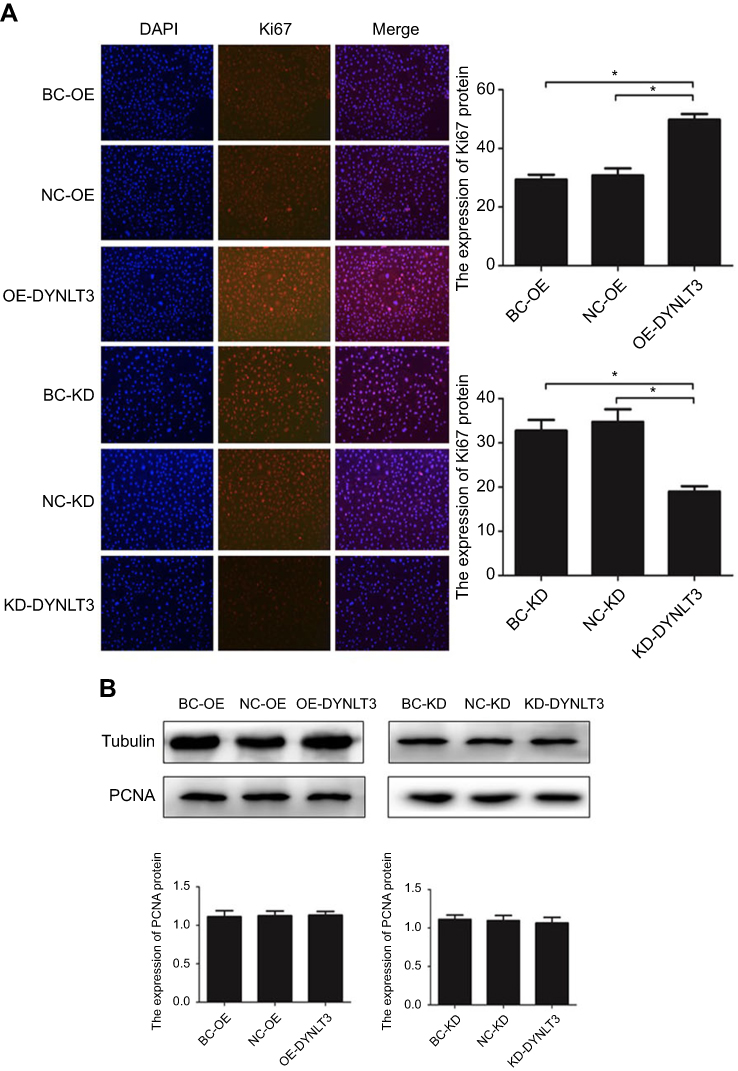 |
Figure 6 The expression of proliferation-related protein Ki-67 and PCNA in SKOV3 cells after transfected with DYNLT3-pLVX-IRES-ZsGreen1 and TRC2-pLKO-puro-shDYNLT3 lentivirus (×40). (A) The relative expression level of Ki-67 protein. (B) The relative expression level of PCNA protein. Data are expressed as mean ± standard deviation from triplicate experiments (*P<0.05). Abbreviations: BC-OE, over-expression blank control group; NC-OE, over-expression vector control group; OE-DYNLT3, DYNLT3-overexpression group; BC-KD, knock-down blank control group; NC-KD, knock-down vector control group; KD-DYNLT3, DYNLT3-knock-down group. |
As shown in Figure 6B, the expression level of the proliferation-related protein PCNA showed no changes after upregulation or downregulation of DYNLT3 expression (P>0.05).
DYNLT3 affected the expression of the migration/invasion-related protein Ezrin in ovarian cancer cells
The result in Figure 7 revealed that when DYNLT3 was up-regulated, Ezrin protein expression was enhanced in SKOV3 cells. On the contrary, the Ezrin protein level tended to decrease when DYNLT3 was knocked down (P<0.05). However, the protein expression levels of MMP2, MMP9 and Fascin were not affected after DYNLT3 expression was altered (P>0.05).
 |
Figure 7 The expression of migration/invasion-related protein Ezrin, Fascin, MMP2 and MMP9 in SKOV3 cells after transfected with DYNLT3-pLVX-IRES-ZsGreen1 and TRC2-pLKO-puro-shDYNLT3 lentivirus. (A) Image of Western blot. (B) The relative expression level of Ezrin protein. (C) The relative expression level of Fascin protein. (D) The relative expression level of MMP2 protein. (E) The relative expression level of MMP9 protein. Data are expressed as mean ± standard deviation from triplicate experiments (*P<0.05). Abbreviations: BC-OE, over-expression blank control group; NC-OE, over-expression vector control group; OE-DYNLT3, DYNLT3-overexpression group; BC-KD, knock-down blank control group; NC-KD, knock-down vector control group; KD-DYNLT3, DYNLT3-knock-down group. |
Discussion
DYNLT1 and DYNLT3 are two members of the dynein light chain Tctex family; these proteins are mainly localized in the nucleus, cytoplasm and microtubules and participate in reverse vesicular transport, spindle localization in mitotic division and axonal transport.13 In recent years, studies have found that the dynein light chain Tctex family is associated with the occurrence and development of many tumors. Additional studies have focused on the correlation between DYNLT1 and cancer. Sarma et al.14 found that DYNLT1 interacted with nucleopore proteins, which play a role in the dysregulation of gene expression and the proliferation of hematopoietic cells. Cervantes et al.15 revealed that the DYNLT1 exhibited significantly increased expression in liver cancer and participated in the progression of liver cancer. Ochiai et al.16 proposed that DYNLT1 might be associated with the apoptosis of tumor cells. Regarding DYNLT3 and cancer, there are only two related studies. In esophageal squamous cell carcinoma, the expression of the DYNLT3 gene was significantly downregulated, which may play a role in tumor inhibition.11 However, Shao et al.12 conducted a whole-genome screen of salivary adenoid cystic carcinoma samples and found that the DYNLT3 gene is one of the candidate oncogenes. In the present study, we found for the first time that DYNLT3 protein expression gradually increased from normal ovarian epithelium to serous cystadenoma and to serous cystadenocarcinoma, suggesting that DYNLT3 might be implicated in the development and progression of ovarian cancer.
To date, no data are available on the prognostic role of DYNLT3 in gynecological malignancies. In this investigation, we revealed that DYNLT3 mRNA expression was correlated with poor OS and PFS in all ovarian cancer patients, especially in serous ovarian cancer patients. However, in endometrioid ovarian cancer patients, high expression of DYNLT3 mRNA was related to improved PFS but was not related to OS. The reason of different prognostic value of DYNLT3 in patients with endometrioid ovarian cancer might be as follows: the sample size of serous ovarian cancer patients included in the study was 1027, while that of endometrioid ovarian cancer patients was only 102. The larger the sample size, the more reliable the statistical results will be. Since the number of endometrioid ovarian cancer patients was small, it needs to be conducted with a large sample size to determine the prognostic value of DYNLT3 in endometrioid ovarian cancer patients.
Cell proliferation refers to a series of complex reaction processes under the influence of regulatory factors of the cell cycle, including DNA replication, RNA transcription and protein synthesis, which are the basis of the growth, development, reproduction and heredity of normal cells. Cell proliferation is not only involved in normal physiological processes of organisms but is also closely related to pathophysiological processes such as chronic inflammation and tumor growth.17 Abnormal cell proliferation plays a crucial role in the occurrence and development of tumors.17 Studies have revealed that DYNLT3 is mainly distributed in centromeres, nuclei, the cytoplasm and microtubules; regulates mitosis and meiosis; and plays an important role in the division of chromosomes.8,9 Lo et al.8 used specific siRNA to reduce the expression of the DYNLT3 gene in cells and found that the mitotic index increased appreciably and that the number of cells increased in early stages, indicating that DYNLT3 could affect cell proliferation by interfering with the process of mitosis in cells. Based on the function of DYNLT3 in regulating cell division, the effect of the DYNLT3 gene on the proliferation of SKOV3 ovarian cancer cells was assessed by the CCK-8 method. The results in this study showed that DYNLT3 gene expression could clearly promote the proliferation of SKOV3 ovarian cancer cells.
To further study the mechanism by which DYNLT3 affects the proliferation of ovarian cancer cells, we investigated the expression of two common proliferation-related proteins, PCNA and Ki-67, which are regarded as important markers for evaluating the proliferation activity of tumor cells. The expression of PCNA and Ki-67 varied during the cell cycle and showed important clinical value for disease diagnosis, treatment and prognosis.18,19 PCNA is a cell cycle regulatory protein that regulates the synthesis of the leading and lagging chains, and its expression changes periodically with the DNA replication stage.18 PCNA expression increases significantly in G1 phase and then peaks and gradually decreases in G2-M phase; PCNA plays an important role in the transition of the cell cycle from G1 to S phase.18,20 Some studies have indicated that PCNA is highly expressed in almost all tumor tissues and may be related to the continuous growth of tumor cells.21,22 Ki-67, a nuclear antigen associated with cell proliferation, participates in the synthesis of ribosomes and proteins during the process of cell mitosis and is expressed in the G1, S, M and G2 phases of the cell cycle.20 Our results showed that DYNLT3 had no effect on the expression of the PCNA protein. Therefore, we speculated that DYNLT3 was irrelevant in the G1 and S phases. However, we found that the expression of the Ki-67 protein was increased or decreased after upregulation or downregulation of DYNLT3, respectively, indicating that the effect of the DYNLT3 gene on the proliferation of ovarian cancer cells may be related to Ki-67. These results suggest that DYNLT3 may participate in the process of cell mitosis and affect cell proliferation in the M and G2 phases of the cell cycle.
Cell migration is related to pathophysiological processes such as chronic inflammation and cancer metastasis. The process of cell migration includes changes in cell structure and cytoskeletal dynamics, expression of adhesion molecules and activation of signals promoting cell migration. To invade, cells must recognize, attach to and degrade the basement membrane and extracellular matrix.23,24 However, the impact of DYNLT3 on migration and invasion in ovarian cancer has not yet been elucidated. In this study, we revealed that DYNLT3 promoted the migration and invasion of SKOV3 cells. Thus, DYNLT3 may be a newly recognized factor regulating ovarian cancer cell invasion and metastasis.
Many studies have reported that matrix metalloproteinases (MMPs), Ezrin and Fascin are related to the invasion and migration of cancer cells. MMPs are zinc-dependent endopeptidases implicated in various physiological and pathological processes and are categorized according to localization, enzyme sequence arrangement, substrate specificity or associated motifs.25,26 It is worth noting that MMP-2 and MMP-9 influence collagen remodeling and exhibit tumorigenic activity based on their profound participation in cancer cell migration, invasion, and metastasis.25,26 Fascin is an actin-binding protein that regulates the parallel bundling of actin filaments, stabilizes filopodia and invadopodia, and mediates adhesion dynamics in migrating cells.27 Fascin is highly expressed in many malignant tumors, such as breast cancer,28 endometrial carcinoma29 and ovarian cancer,30 and is related to cancer cell invasion.31,32
The Ezrin protein is one of the members of the Ezrin/Radixin/Moesin (ERM) protein family. Ezrin is a connexin that connects the actin cytoskeleton with the plasma membrane.33 Studies have shown that the Ezrin protein is involved in cell movement, adhesion and signal transduction. Abnormal ezrin expression is closely related to the migration and invasion of multiple types of cancer cells.34 A previous study35 found that the expression of the Ezrin protein was higher in cervical carcinoma than in cervical intraepithelial neoplasia, normal cervix and inflamed cervical tissue. There was a positive correlation between Ezrin protein expression and both stromal invasion depth and cervical lymph node metastasis, suggesting that Ezrin can promote invasion and metastasis in cervical cancer. Another study reported that knockout of dynein light chain roadblock-type 1 (DYNLRB1) decreased the paracrine effect of colon cancer cell secretory factors in conditioned medium and fibroblast coculture, the invasion and migration of colon cancer cells and the expression of the metastasis-related protein Ezrin, which is regulated by extracellular regulated protein kinases.36 In the present study, we found that the DYNLT3 gene regulated Ezrin protein expression in ovarian cancer SKOV3 cells but had no effect on Fascin, MMP2 or MMP9 protein expression. This finding suggests that the promotive effect of the DYNLT3 gene on ovarian cancer cell invasion and migration may be related to regulation of the Ezrin protein.
Conclusion
In summary, DYNLT3 protein expression was gradually increased during the progression of ovarian epithelial lesions, and DYNLT3 mRNA was related to poor prognosis in ovarian cancer patients, indicating that DYNLT3 might act as an oncogene in ovarian cancer. In addition, the DYNLT3 gene promoted ovarian cancer cell proliferation, migration and invasion, which was related to the expression of Ki-67 and Ezrin. However, the signaling pathways responsible for the role of DYNLT3 in ovarian cancer progression require further investigation.
Acknowledgments
This work was supported by a grant from the National Natural Science Foundation of China (NO. 81772846) and the Science and Technology Development Funds of Wenzhou city (NO. Y20170006). The study sponsors were not involved in the collection, analysis and interpretation of data or in the writing of the manuscript.
Disclosure
The authors declare that there are no conflicts of interest regarding the publication of this paper.
References
1. Siegel RL, Miller KD, Jemal A. Cancer statistics, 2018. CA Cancer J Clin. 2018;68(1):7–30. doi:10.3322/caac.21442
2. McSorley MA, Alberg AJ, Allen DS, et al. Prediagnostic circulating follicle stimulating hormone concentrations and ovarian cancer risk. Int J Cancer. 2009;125(3):674–679. doi:10.1002/ijc.24406
3. Conic I, Dimov I, Tasic-Dimov D, et al. Ovarian epithelial cancer stem cells. Sci World J. 2011;11:1243–1269. doi:10.1100/tsw.2011.112
4. Liew PL, Hsu CS, Liu WM, et al. Prognostic and predictive values of Nrf2, Keap1, p16 and E-cadherin expression in ovarian epithelial carcinoma. Int J Clin Exp Pathol. 2015;8:85642–85649.
5. Coleman MP, Forman D, Bryant H, et al. Cancer survival in Australia, Canada, Denmark, Norway, Sweden, and the UK, 1995-2007 (the International Cancer Benchmarking Partnership): an analysis of population-based cancer registry data. Lancet. 2011;377(9760):127–138. doi:10.1016/S0140-6736(10)62231-3
6. Liu J, Matulonis UA. New strategies in ovarian cancer: translating the molecular complexity of ovarian cancer into treatment advances. Clin Cancer Res. 2014;20(20):5150–5156. doi:10.1158/1078-0432.CCR-14-1312
7. Kipps E, Tan DS, Kaye SB. Meeting the challenge of ascites in ovarian cancer: new avenues for therapy and research. Nat Rev Cancer. 2013;13(4):273–282. doi:10.1038/nrc3432
8. Lo KW, Kogoy JM, Pfister KK. The DYNLT3 light chain directly links cytoplasmic dynein to a spindle checkpoint protein, Bub3. J Biol Chem. 2007;282(15):11205–11212. doi:10.1074/jbc.M611279200
9. Huang X, Wang HL, Qi ST, et al. DYNLT3 is required for chromosome alignment during mouse oocyte meiotic maturation. Reprod Sci. 2011;18(10):983–989. doi:10.1177/1933719111401664
10. Yeh TY, Chuang JZ, Sung CH. Dynein light chain rp3 acts as a nuclear matrix-associated transcriptional modulator in a dynein-independent pathway. J Cell Sci. 2005;118(Pt 15):3431–3443. doi:10.1242/jcs.02472
11. Karagoz K, Lehman HL, Stairs DB, et al. Proteomic and metabolic signatures of esophageal squamous cell carcinoma. Curr Cancer Drug Targets. 2016;16(8):721–736. doi:10.2174/1568009616666160203113721
12. Shao C, Sun W, Tan M, et al. Integrated, genome-wide screening for hypomethylated oncogenes in salivary gland adenoid cystic carcinoma. Clin Cancer Res. 2011;17(13):4320–4330. doi:10.1158/1078-0432.CCR-10-2992
13. King SM. The dynein microtubule motor. Biochim Biophys Acta. 2000;1496(1):60–75.
14. Sarma NJ, Yaseen NR. Dynein light chain 1 (DYNLT1) interacts with normal and oncogenic nucleoporins. PLoS One. 2013;8(6):e67032. doi:10.1371/journal.pone.0067032
15. Cervantes-Anaya N, Ponciano-Gomez A, Lopez-Alvarez GS, et al. Downregulation of sorting nexin 10 is associated with overexpression of miR-30d during liver cancer progression in rats. Tumour Biol. 2017;39(4):1–10. doi:10.1177/1010428317695932
16. Ochiai K, Watanabe M, Ueki H, et al. Tumor suppressor REIC/Dkk-3 interacts with the dynein light chain, Tctex-1. Biochem Biophys Res Commun. 2011;412(2):391–395. doi:10.1016/j.bbrc.2011.07.109
17. Kresno SB, Gondhowiardjo S. Disregulation process of cancer cell proliferation. Acta Med Indones. 2004;36(3):169–176.
18. Bolton WE, Mikulka WR, Healy CG, et al. Expression of proliferation associated antigens in the cell cycle of synchronized mammalian cells. Cytometry. 1992;13(2):117–126. doi:10.1002/cyto.990130203
19. Ma X, Wu Y, Zhang T, et al. Ki67 proliferation index as a histopathological predictive and prognostic parameter of oral mucosal melanoma in patients without distant metastases. J Cancer. 2017;8(18):3828–3837. doi:10.7150/jca.20935
20. Wang X, Wang D, Yuan N, et al. The prognostic value of PCNA expression in patients with osteosarcoma: a meta-analysis of 16 studies. Medicine. 2017;96(41):e8254. doi:10.1097/MD.0000000000008254
21. Jurikova M, Danihel L, Polak S, et al. Ki67, PCNA, and MCM proteins: markers of proliferation in the diagnosis of breast cancer. Acta Histochem. 2016;118(5):544–552. doi:10.1016/j.acthis.2016.05.002
22. Lv Q, Zhang J, Yi Y, et al. Proliferating cell nuclear antigen has an association with prognosis and risks factors of cancer patients: a systematic review. Mol Neurobiol. 2016;53(9):6209–6217. doi:10.1007/s12035-015-9525-3
23. Tochhawng L, Deng S, Pervaiz S, et al. Redox regulation of cancer cell migration and invasion. Mitochondrion. 2013;13(3):246–253. doi:10.1016/j.mito.2012.08.002
24. Hood JD, Cheresh DA. Role of integrins in cell invasion and migration. Nat Rev Cancer. 2002;2(2):91–100. doi:10.1038/nrc727
25. Alaseem A, Alhazzani K, Dondapati P, et al. Matrix metalloproteinases: a challenging paradigm of cancer management. Semin Cancer Biol. 2019;56:100–115. doi: 10.1016/j.semcancer.2017.11.008.
26. Lalita Y, Naveen P, Varun R, et al. Matrix metalloproteinases and cancer-roles in threat and therapy. Asian Pac J Cancer Prev. 2014;15(3):1085–1091.
27. Asier J, Majid M, Susumu A, et al. Fascin regulates nuclear movement and deformation in migrating cells. Dev Cell. 2016;38(4):371–383. doi:10.1016/j.devcel.2016.07.021
28. Min KW, Chae SW, Kim DH, et al. Fascin expression predicts an aggressive clinical course in patients with advanced breast cancer. Oncol Lett. 2015;10(1):121–130. doi:10.3892/ol.2015.3191
29. Onder S, Taskin OC, Sen F, et al. High expression of SALL4 and fascin, and loss of E-cadherin expression in undifferentiated/dedifferentiated carcinomas of the endometrium: an immunohistochemical and clinicopathologic study. Medicine. 2017;96(10):e6248. doi:10.1097/MD.0000000000006248
30. Hu W, McCrea PD, Deavers M, et al. Increased expression of fascin, motility associated protein, in cell cultures derived from ovarian cancer and in borderline and carcinomatous ovarian tumors. Clin Exp Metastasis. 2000;18(1):83–88.
31. Adams JC. Roles of fascin in cell adhesion and motility. Curr Opin Cell Biol. 2004;16(5):590–596. doi:10.1016/j.ceb.2004.07.009
32. Jayo A, Parsons M. Fascin: a key regulator of cytoskeletal dynamics. Int J Biochem Cell Biol. 2010;42(10):1614–1617. doi:10.1016/j.biocel.2010.06.019
33. Ren L, Khanna C. Role of ezrin in osteosarcoma metastasis. Adv Exp Med Biol. 2014;804:181–201. doi:10.1007/978-3-319-04843-7_10
34. Clucas J, Valderrama F. ERM proteins in cancer progression. J Cell Sci. 2014;127(Pt 2):267–275. doi:10.1242/jcs.133108
35. Li M, Feng YM, Fang SQ. Overexpression of ezrin and galectin-3 as predictors of poor prognosis of cervical cancer. Braz J Med Biol Res. 2017;50(4):e5356. doi:10.1590/1414-431X20176071
36. Jin Q, Liu G, Domeier PP, Ding W, Mulder KM, de Wever O. Decreased tumor progression and invasion by a novel anti-cell motility target for human colorectal carcinoma cells. PLoS One. 2013;8(6):e66439. doi:10.1371/journal.pone.0066439
 © 2019 The Author(s). This work is published and licensed by Dove Medical Press Limited. The
full terms of this license are available at https://www.dovepress.com/terms
and incorporate the Creative Commons Attribution
- Non Commercial (unported, 3.0) License.
By accessing the work you hereby accept the Terms. Non-commercial uses of the work are permitted
without any further permission from Dove Medical Press Limited, provided the work is properly
attributed. For permission for commercial use of this work, please see paragraphs 4.2 and 5 of our Terms.
© 2019 The Author(s). This work is published and licensed by Dove Medical Press Limited. The
full terms of this license are available at https://www.dovepress.com/terms
and incorporate the Creative Commons Attribution
- Non Commercial (unported, 3.0) License.
By accessing the work you hereby accept the Terms. Non-commercial uses of the work are permitted
without any further permission from Dove Medical Press Limited, provided the work is properly
attributed. For permission for commercial use of this work, please see paragraphs 4.2 and 5 of our Terms.