Back to Journals » Risk Management and Healthcare Policy » Volume 16
Effects of AGT and AGTR1 Genetic Polymorphisms and Changes in Blood Pressure Over a Five-Year Follow-Up
Authors Chaimati S, Shantavasinkul PC ![]() , Sritara P, Sirivarasai J
, Sritara P, Sirivarasai J ![]()
Received 18 October 2023
Accepted for publication 15 December 2023
Published 28 December 2023 Volume 2023:16 Pages 2931—2942
DOI https://doi.org/10.2147/RMHP.S442983
Checked for plagiarism Yes
Review by Single anonymous peer review
Peer reviewer comments 3
Editor who approved publication: Dr Jongwha Chang
Siwaphorn Chaimati,1 Prapimporn Chattranukulchai Shantavasinkul,2 Piyamitr Sritara,2 Jintana Sirivarasai3
1Doctoral Program in Nutrition, Faculty of Medicine Ramathibodi Hospital and Institute of Nutrition, Mahidol University, Bangkok, 10400, Thailand; 2Department of Medicine, Faculty of Medicine Ramathibodi Hospital, Mahidol University, Bangkok, 10400, Thailand; 3Nutrition Division, Faculty of Medicine Ramathibodi Hospital, Mahidol University, Bangkok, 10400, Thailand
Correspondence: Jintana Sirivarasai, Nutrition Division, Faculty of Medicine Ramathibodi Hospital, Mahidol University, Bangkok, 10400, Thailand, Tel +662-201-1483, Fax +662-201-2625, Email [email protected]
Purpose: The renin–angiotensin system plays an important role in the central regulation of blood pressure (BP). Genetic variations of angiotensinogen (AGT) and angiotensin II type 1 receptor (AGTR1) may increase susceptibility to elevated BP and hypertension. This study investigated the effects of AGT rs699 and AGTR1 rs5186 single nucleotide polymorphisms (SNPs) on BP at baseline and at a 5-year follow-up.
Paticipants and Methods: The study population consisted of participants from the Electricity Generating Authority of Thailand cohort study (n=354); data were collected at baseline (2013) and 5 years later (2018). Genotyping of the two SNPs was performed using TaqMan® assay and statistical analyses were performed with SNPStats software.
Results: The frequencies of the two SNPs were within the Hardy–Weinberg equilibrium (p=0.22 for AGT rs699 and p=0.06 for AGTR1 rs5186). For each SNP, mutant genotypes were significantly associated with increased systolic BP and/or diastolic BP in the codominant and recessive models. Risk alleles of AGT rs699 and AGTR1 rs5186 were associated with increased odds of hypertension and hypertension with metabolic syndrome at follow-up.
Conclusion: Overall, our results suggest that polymorphisms of genes in the renin–angiotensin system increase susceptibility to the development and progression of hypertension and the development of the metabolic syndrome.
Keywords: angiotensinogen, angiotensin II receptor type 1, polymorphisms, hypertension, metabolic syndrome
Introduction
Hypertension is an important risk factor for total mortality and cardiovascular disease (CVD) worldwide.1 As a result, the World Health Organization set a target to reduce the prevalence of hypertension globally by 33% between 2010 and 2030.1 There are several modifiable risk factors for hypertension, including obesity, an unhealthy diet (characterized by excessive energy, fat, sodium, and sugar intake), physical inactivity, smoking, and heavy alcohol consumption.2 For example, a cross-sectional study in China showed that tobacco exposure (≥1 pack per week) was associated with an increase of 0.014 mmHg systolic blood pressure (SBP) compared with no exposure,3 while a systematic review and meta-analysis found that men who consumed 21 to 30 g alcohol per day had a 16% increased risk of hypertension than those with alcohol consumption with <10 g/d.4 The link between cigarette smoking and hypertension is mediated by exposure to various toxicants in both primary (the stream of smoke inhaled directly by the person using the tobacco product) and secondhand cigarette smoke (smoke that comes from the burning end of a cigarette). These compounds can generate free radicals, activate endogenous free radical production (including overactivation of endogenous enzymes-induced ROS such as nitric oxide synthase, xanthine oxidase and NADPH oxidase), and increase cytokine production, which together cause hypertension through vasomotor dysfunction, leukocyte and platelet activation, and vascular smooth muscle proliferation.5 In terms of alcohol intake, possible mechanisms leading to hypertension include stimulation of vasoconstriction through oxidative stress, inflammation, and decreased nitric oxide; enhanced sympathetic activity; and activation of the renin–angiotensin system (RAS).6 Furthermore, there was a significant potentiating effect of overweight or obesity and dyslipidemia on blood pressure (BP) in 765 subjects with aged >15 year, no cognitive impairment, no serious illness or disability and diagnosis as hypertension by SBP ≥ 140 mmHg and/or DBP) ≥ 90 mmHg, or the patient was taking hypertensive medication.7 The results from this study highlighted the need for lifestyle modification to reduce the incidence of hypertension.7
In addition, there is well-established evidence of genetic susceptibility to hypertension, with genetic association studies revealing additional molecular mechanisms and pathways affecting BP, along with identifying potential new treatments.8 Since the RAS is crucial for the regulation and maintenance of BP, genetic variations of the components in this system contribute to the susceptibility of individuals to hypertension.9 The angiotensinogen (AGT) gene is located on the long arm of chromosome 1 (1q42–43), and consists of five exons and four introns. Single nucleotide polymorphisms (SNPs) of the AGT gene include rs699, which is a missense SNP due to a C to T substitution in exon 2, and results in an amino acid change from methionine to threonine. The rs699 threonine variant is a gain-of-function mutation associated with higher plasma AGT levels and BP.9 In addition, a meta-analysis from one hundred twenty-seven studies investigated the association of angiotensinogen gene polymorphisms with systolic or diastolic blood pressure, and risk of hypertension, or other CVDs found that the AGT rs699 polymorphism is significantly linked to hypertension (OR=1.09; 95% CI, 1.01–1.19).10 Another candidate gene in the etiology of hypertension and other CVDs is angiotensin II receptor type 1 (AGTR1), which is located on chromosome 3q21–25. The AGTR1 rs5186 (A1166C variant) is found in the 3′ UTR with possible effects on mRNA stability and transcription; this mutation increases angiotensin II (Ang II) levels, which increases BP.11 Potential effects of both SNPs on blood pressure have been proposed due to high amount of AGT is converted to angiotensin I by the action of renin and then converted to angiotensin II via angiotensin-converting enzyme (ACE). When angiotensin II binds to its receptors, such as AGTR1, it activates molecular pathways such as inflammation, vasoconstriction, oxidative stress, and sodium and water reabsorption, resulting in high blood pressure and hypertension.12
A case–control study found that individuals with the CC genotype of AGTR1 rs5186 were at a 2.4 times higher risk of developing essential hypertension than individuals with AC and AA genotypes, suggesting that AGTR1 upregulation plays an important role in essential hypertension.13 A previous study on peripheral arterial diseases patients investigating the effects of both of these RAS-related gene variants (AGT rs699 and AGTR1 rs5186), as well as ACE rs1799752 and angiotensin II receptor type 2 (AGTR2) rs35474657, found that carriers of variant genotypes had significantly higher levels of HDL-C, LDL-C and triglycerides (TG) than patients without these SNPs.14 In addition, a cohort study found that the AGT1R rs5186; A1166C single nucleotide polymorphism increased AGT1R and miR-155 expression in 411 patients with carotid atherosclerosis.15
Given the strong association between genetic mutations and hypertension, both genetic and environmental factors should be considered in efforts to reduce hypertension at a population level. Most studies on the effect of RAS genetic polymorphisms on hypertension have been case–control observational studies. Therefore, data from a prospective cohort design, such as the Electricity Generating Authority of Thailand (EGAT) cohort study, may help establish the link between modifiable and non-modifiable risk factors associated with the development and progression of hypertension. This study aimed to investigate the effects of AGT rs699 and AGTR1 rs5186 and BP in a 5-year follow-up study of the EGAT cohort.
Materials and Methods
Study Design, Participants and Data Collection
In this study, we analyzed the data from male participants (n=354, age 45–60) in the health surveys of the EGAT cohort study at the baseline (2013) and 5-year follow-up (2018). A general overview of the study’s procedures was previously published.16 The baseline and 5-year follow-up characteristics of the participants were collected with the same questionnaire, which included lifestyle factors, as well as past and current medical history. All participants underwent weight, height, waist circumference (WC), and BP measurements. BP was measured after a 5-min rest period using an automatic sphygmomanometer (Omron Health Care, Kyoto, Japan), which was performed by personnel who had been trained in the standardization of these procedures. Hypertension was diagnosed when SBP >140 mmHg and DBP >90 mmHg.17 Metabolic syndrome (MS) was diagnosed based on the National Cholesterol Education Program Adult Treatment Panel III definition if three or more of the following five criteria were met: abdominal obesity (waist circumference ≥90 cm), high BP (systolic/diastolic BP ≥130 or ≥85, respectively), hyperglycemia (fasting blood glucose ≥100 mg/dL), hypertriglyceridemia (triglyceride level ≥150 mg/dL), or low high-density lipoprotein (HDL)-cholesterol levels (<40 mg/dL).18 We included all male participants aged >45 years. Only participants with complete data of BP and antihypertensive use as well as demographic and clinical characteristics at the time of baseline and 5 years follow-up were included in our study. Exclusion criteria included metabolic diseases related to inherited metabolic disorders; use of drugs to treat hypertension; type 2 diabetes; dyslipidemia; acute or chronic liver and kidney disease; thyroid disorder; cancer; and other CVDs.
The study was conducted in accordance with the Declaration of Helsinki and approved by the Institutional Review Board of Faculty of Medicine Ramathibodi Hospital, Mahidol University (COA.MURA 2021/837 and 2023/97). In addition, informed consent was obtained from the study participants prior to study commencement.
Biochemical Measurements and Genetic Analysis
Blood samples were collected after fasting for 12 h. Biochemical analyses included HbA1C, fasting blood glucose, total cholesterol, TG, HDL-cholesterol, low-density lipoprotein (LDL)-cholesterol, urea nitrogen, and creatinine levels, which were measured using automated methods (Cobas-Mira, Roche, Milan, Italy). Genomic DNA was isolated from 3 mL of peripheral blood collected into EDTA tubes using the “salting-out” method.19 The rs699, and rs5182, SNPs were genotyped using the TaqMan method (Applied Biosystems, Foster City, CA). TaqMan SNP genotyping primers and probes were designed by Applied Biosystems (rs699 assay ID: C_1985481_20 and rs5186 assay ID: C_3187716_10). Oligonucleotides were synthesized and FAM and VIC fluorogenic markers were coupled to the extremities 5’ of the probes in order to reach allelic discrimination. The assays were performed following the manufacturer’s protocol using 2 µL of DNA in 5 µL total volumes in 96-well plates. The TaqMan real-time polymerase chain reaction assays were performed using a cycling program of 95°C for 10 minutes, 40 cycles of 95°C for 15 seconds, and 60°C for 1 minute, according to the manufacturer’s instructions.
Statistical Analysis
Data were analyzed using SPSS Statistics version 25.0 (IBM, Inc., Armonk, NY, USA). Data are presented as mean and SD for continuous data, and percentages (%) for categorical data. Comparisons between groups were performed using the independent t-test, chi-square test, and one way analysis of variance (ANOVA), depending on the data type and number of comparisons. We used SNPStats software20 for statistical analysis of genetic polymorphisms, consistency of results with the Hardy–Weinberg equilibrium, and logistic regression according to the response variable (quantitative or binary disease status). In addition, SNPStats software was used for analysis of single SNP multiple inheritance models (co-dominant, dominant, recessive, and over-dominant) and analysis of interactions (gene–gene) with adjusted covariates including age, BMI, smoking, and drinking. Differences were considered significant when the p-value was lower than 0.05.
Results
Participant Characteristics and Clinical Data
The demographic and clinical data in the study population (n=354) at baseline and at the 5-year follow-up are shown in Table 1. Mean age of participants at baseline was 52.70 ± 1.41 years. The BMI, WC, and waist-to-hip ratio of participants at follow-up was significantly higher than at baseline (all p<0.05) (Table 1). In addition, both SBP and DBP were significantly higher at the 5-year follow-up than at baseline (140.66 ± 16.04 vs 133.31 ± 16.54 mmHg; 85.23 ± 6.59 vs 81.50 ± 10.23 mmHg, respectively; p<0.05). The number of smokers and drinkers did not change between baseline and follow-up. Most participants performed moderate physically activity (about twice a week) for the overall study period (66.1% at baseline and 63.0% at follow-up). At baseline, 49.7% of individuals were diagnosed with hypertension, while 70.6% were diagnosed five years later. Of those with 172 subjects with hypertension at 5 years follow-up, there were 78 (22%) new cases of hypertension. At follow-up, 29.4% of participants remained normotensive.
 |
Table 1 General Characteristics of the Study Population at Baseline and at the 5-Year Follow-Up |
Association Between AGT and AGTR1 Polymorphisms and Individual Characteristics and Biochemical Parameters at Baseline
The AGT rs699 genotype frequencies were 71.5% for CC (wild-type), 27.1% for CT (heterozygous mutant type) and 1.4% for TT (homozygous mutant type) (Table 2). For AGTR1 rs5186, the wild-type AA, heterozygous mutant type AC and homozygous mutant type CC frequencies were 85%, 13.6% and 1.4%, respectively. The calculated allele frequencies of mutant alleles as T for AGT rs699 and C for AGTR1 rs5186 were 0.15 and 0.08, respectively. The genotype frequencies of both SNPs were within the Hardy–Weinberg equilibrium (p=0.22 for AGT rs699 and p=0.06 for AGTR1 rs5186).
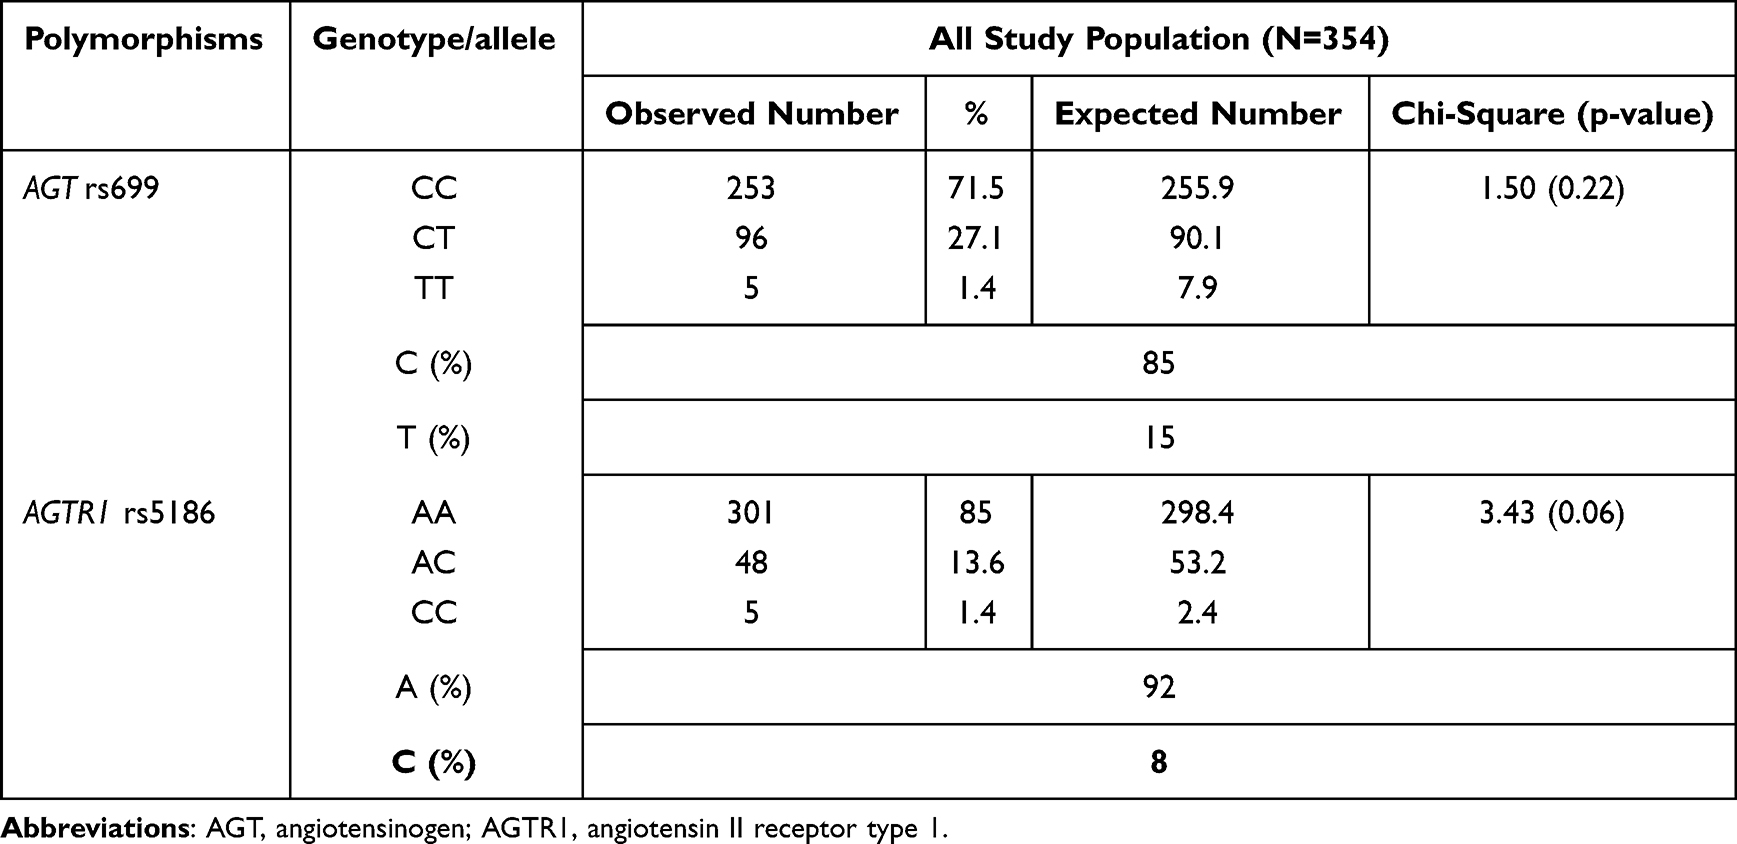 |
Table 2 The Hardy–Weinberg Equilibrium for AGT rs699 and AGTR1 rs5186 in the Study Population (P<0.05 Indicates Results are Not Consistent with the Hardy–Weinberg Equilibrium) |
Associations between both polymorphisms and baseline characteristics related to hypertension risk, such as age, obesity, hyperglycemia and dyslipidemia, were evaluated. For each SNP, wild-type group were compared with heterozygous/mutant group (Table 3). The BMI of subjects with the AGT rs699 CT/TT genotype was significant higher than those with the CC genotype (25.60 ± 3.09 vs 24.07 ± 2.14 kg/m2). For AGTR1 rs5186, we found that subjects with the AC/CC genotype showed significantly higher HbA1C and TG levels than those with AA genotype (all p<0.05) (Table 3).
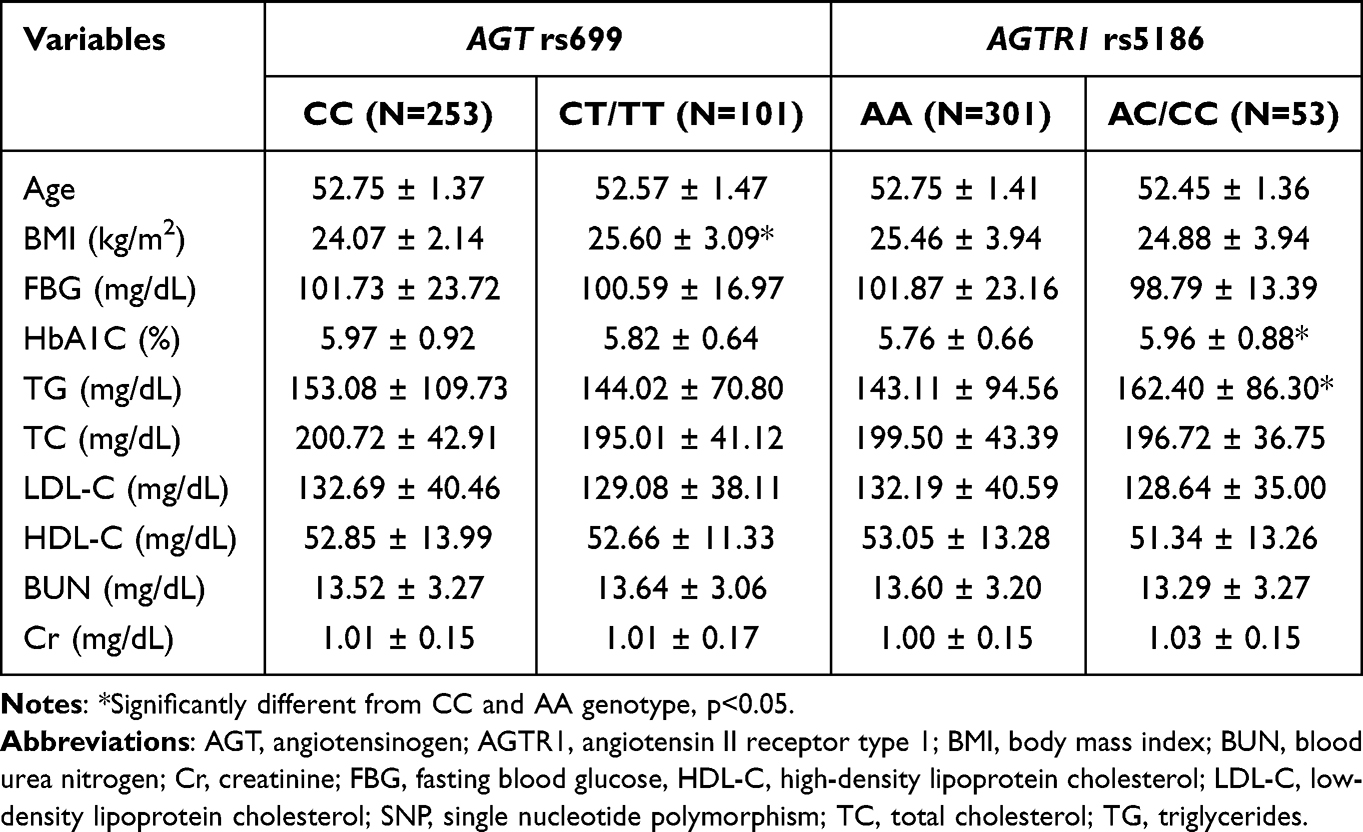 |
Table 3 Baseline Characteristics of the Study Cohort Classified by SNPs and Genotype |
Associations Between Genetic Variations of Each SNP with BP and the Haplotype of Both SNPs with BP and Risk of Hypertension/Hypertension with MS
Table 4 summarizes the results of BP at baseline and follow-up in relation to both SNPs, adjusted for BMI, HbA1C and TG levels. At baseline, the only significant associations between genotype and SBP and DBP were for AGT rs699, with higher BP in individuals with the TT genotype than those with the CC genotype in the co-dominant model (significant mean difference [SMD] 19.18 mmHg, 95% CI 4.62–33.75; p=0.032 for SBP and SMD 18.05 mmHg, 95% CI 8.94–27.15; p=0.004 for DBP), and in individuals with the TT–TC genotype than those with the CC genotype in the recessive model (SMD 19.36 mmHg, 95% CI 4.85–33.87; p=0.009 for SBP and SMD 17.91 mmHg, 95% CI 8.84–26.99; p=0.001 for DBP). At the 5-year follow-up, possession of the CT and TT genotypes of AGT rs699 was significantly associated with higher SBP in the co-dominant (p=0.001), dominant (p=0.001) and over-dominant (p=0.001) models, while possession of the TT genotype was significantly associated with higher DBP in the co-dominant (p=0.008) and recessive (p=0.002) models. For the AGTR1 rs5186 variants, there were significant associations between the CC genotype and higher SBP in both the co-dominant (p=0.04) and recessive models (p=0.011). In addition, the AC and CC genotypes in the co-dominant model (p=0.0001) and the CC genotype in the recessive model (p=0.0001), were significantly associated with higher DBP (Table 4).
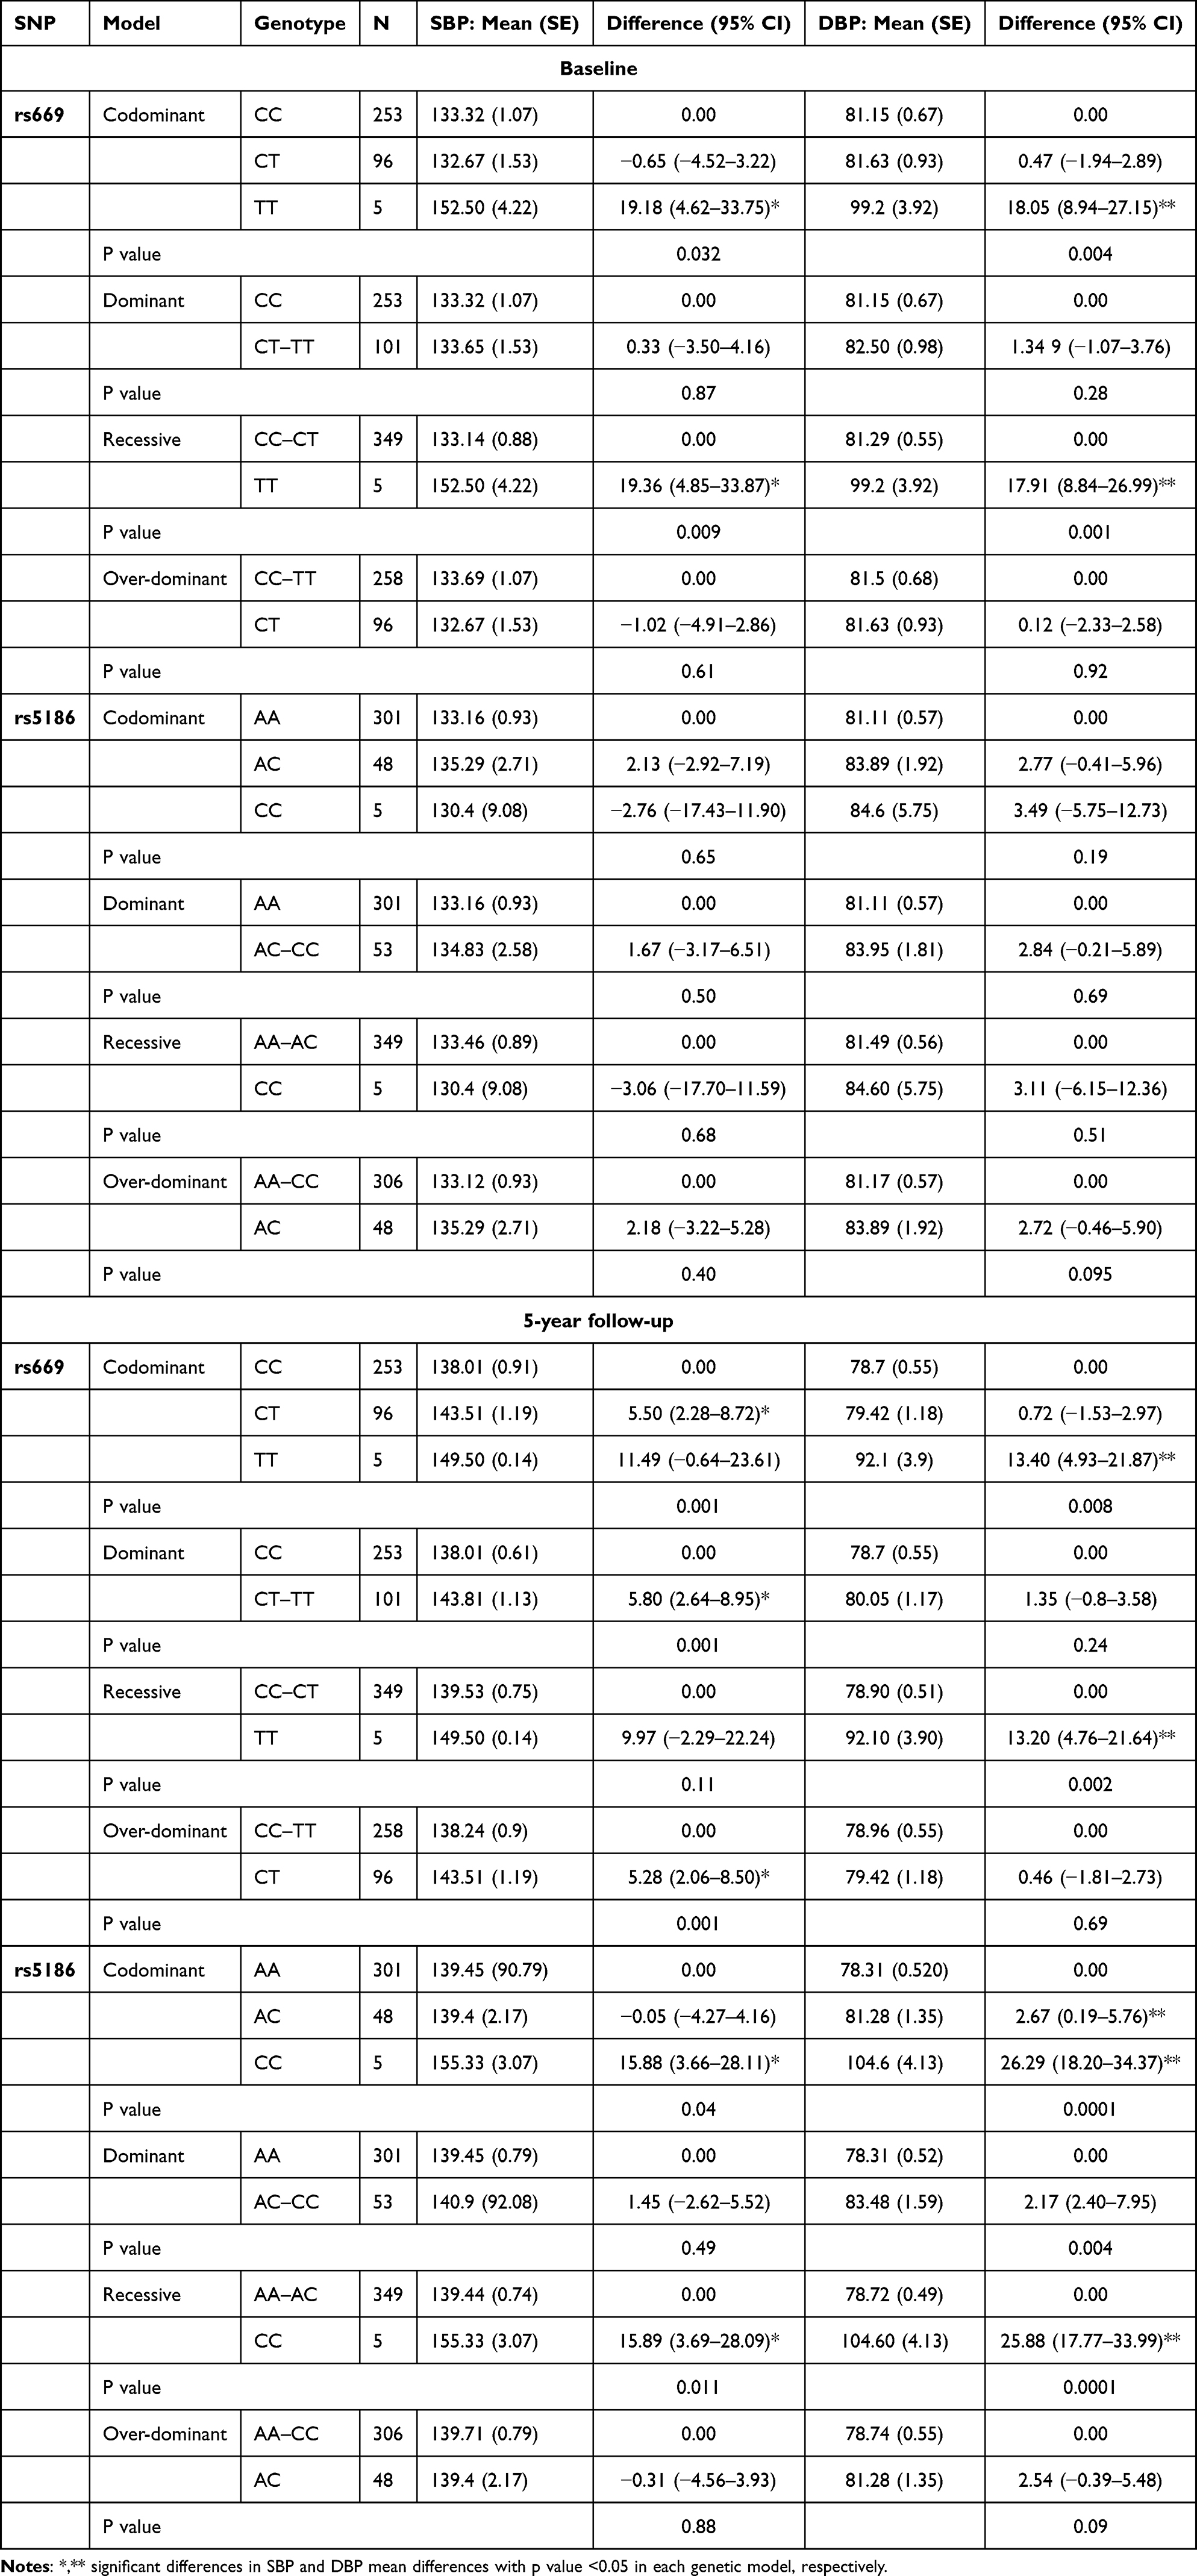 |
Table 4 Associations Between AGT and AGTR1 Polymorphisms and Changes in SBP and DBP at Baseline and at the 5-Year Follow-Up According to Mode of Inheritance |
Haplotype results are presented in Table 5, which shows significant differences in SBP and DBP at baseline and follow-up between different haplotype groups. The frequency of the combinations of AGT rs699 and AGTR1 rs5186 genotypes for CA, TA, CC and TC were 79%, 13%, 6% and 2%, respectively. At baseline, when wild-type AGT rs699 and AGTR1 rs5186 alleles were used as a reference (C and A, respectively), the heterozygous mutant type TC was significantly associated with higher SBP (SMD 5.24 mmHg, 95% CI 4.27–14.76; p=0.03) and DBP (SMD 7.94 mmHg, 95% CI 1.76–14.11; p=0.01). A similar trend of association between gene–gene interactions and BP was evident at the 5-year follow-up. The TA haplotype was significantly associated with higher SBP (SMD 4.35 mmHg, 95% CI 1.23–7.48; p=0.006), as was the TC haplotype (SMD 13.19 mmHg, 95% CI 5.73–20.56; p=0.0001); the TC haplotype was also significantly associated with higher DBP (SMD 17.26 mmHg, 95% CI 11.42–23.11; p=0.0001).
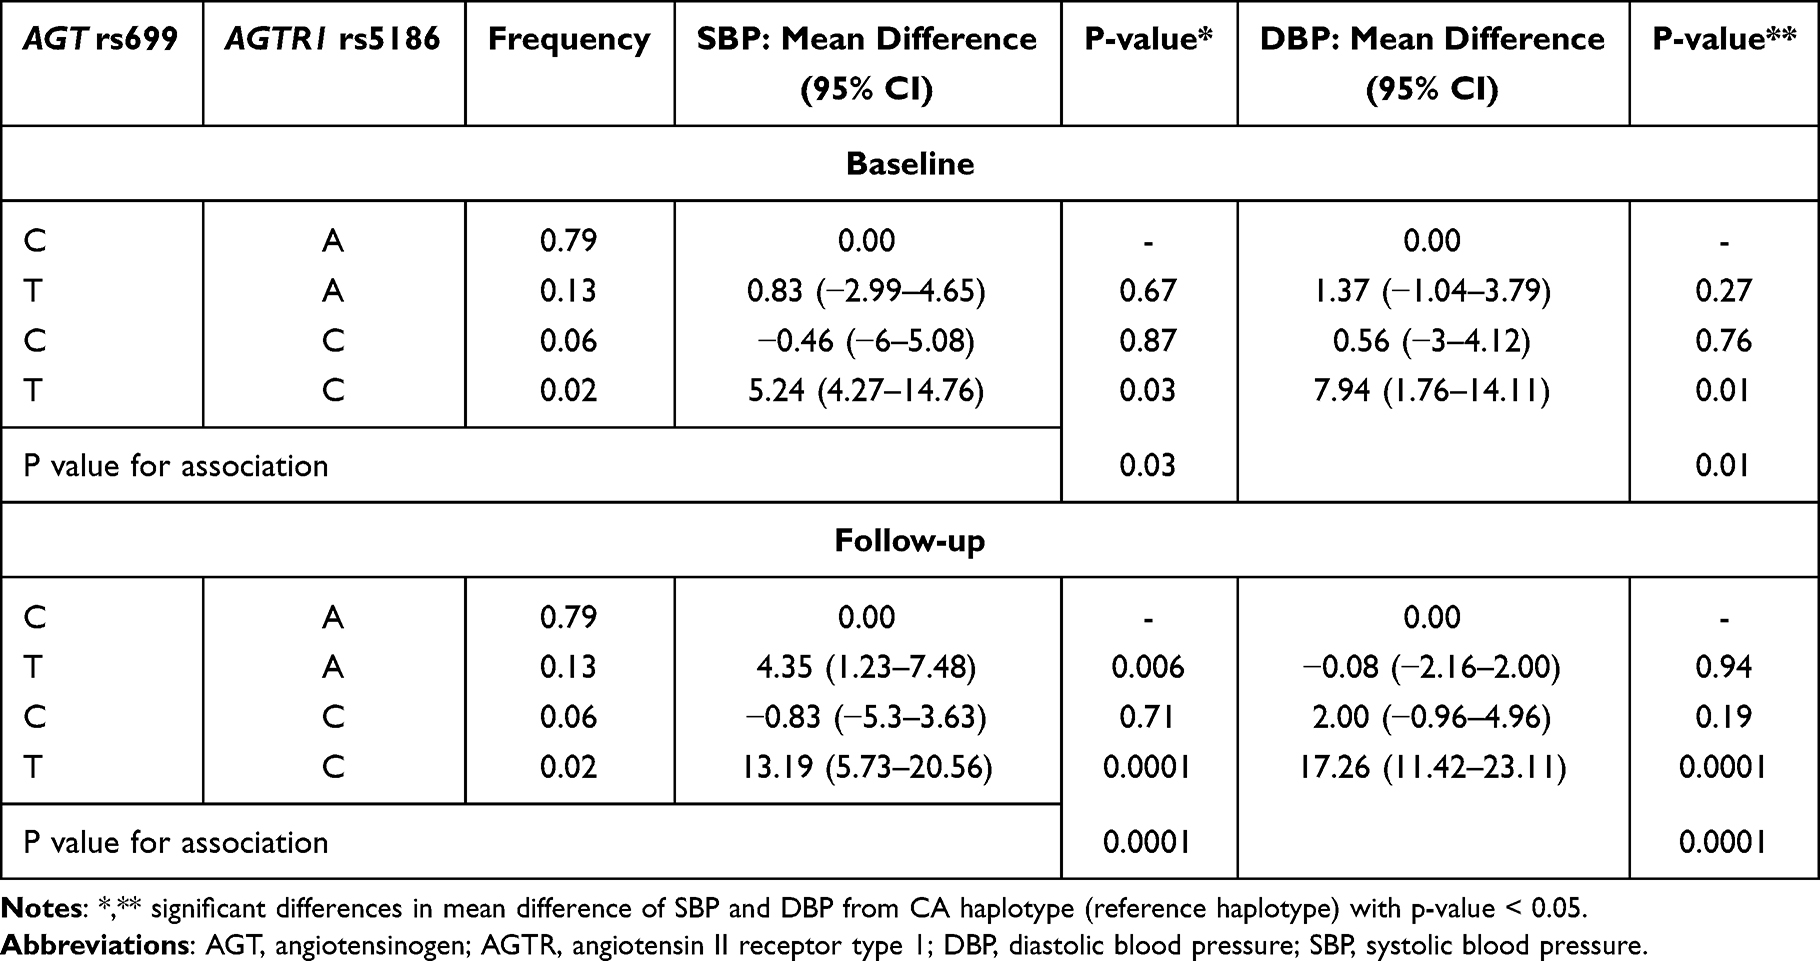 |
Table 5 Association Between Haplotype Variations in AGT rs699 and AGTR1 rs5186 and SBP and DBP at Baseline and at the 5-Year Follow-Up |
The odds ratios of hypertension and hypertension with MS at the end of the study were also evaluated (adjusted for BMI, HbA1C and TG levels) (Figure 1). When using CA as a reference, the possession of the haplotypes TA and TC was significantly associated with increased odds of hypertension (OR=4.44, 95% CI 2.07–9.63 and OR=6.38, 95% CI 3.24–10.89, respectively; both p<0.001); only possession of the TA haplotype was significantly associated with increased odds of hypertension with MS (OR=3.75, 95% CI 1.80–7.78, p<0.001).
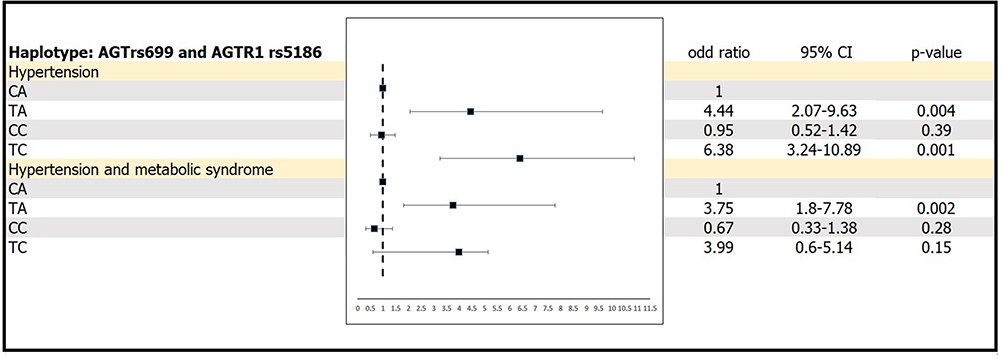 |
Figure 1 Odds ratios of hypertension and hypertension with metabolic syndrome depending on haplotype variations of AGT rs699 and AGTR1 rs5186. |
Discussion
Hypertension is a multifactorial disease partly determined by gene–environment and/or gene–gene interactions. Identification and investigation of genetic polymorphisms related to the molecular mechanisms of hypertension is required to shape both future research and therapeutic approaches;21 this study evaluated the associations between two SNPs of genes in the RAS system and BP.
Our analysis of hypertensive risk factors revealed that compared with baseline, SBP, DBP, BMI, WC, and waist-to-hip ratio were all significantly higher at follow-up. The study population’s BMI at baseline and follow-up were classified as overweight and obese, respectively, based on the Asia-Pacific classification of BMI categories.22 Excessive fat accumulation in the body can act as a potent mediator of hypertension through oxidative stress, inflammation and endothelial dysfunction, which result in vasoconstriction and vascular resistance.23 In addition, the key regulator of hypertension, the RAS, is associated with excess adiposity: overexpression of Agt in adipose tissue contributes to activation of the RAS, as well as to increased plasma concentrations of AGT and higher SBP, in mice.24 This association may explain the relatively high prevalence of hypertension (approximately 50% at baseline and 70% at follow-up) in our study.
We observed statistically significant associations between AGT rs699 and AGTR1 rs5186 and SBP and DBP at baseline and 5 years later. The association between increased levels of AGT and AGTR1 due to the AGT rs699 and AGTR1 rs5186 SNPs and the development of hypertension has been widely investigated. In our study, the minor allele frequency of these SNPs were comparable to previous reports in Thai,25 and Chinese26 populations, but lower than those found in European populations.27 We found that the variant alleles T (for AGT rs699) and C (for AGTR1 rs5186) were associated with higher BMI, HbA1C and TG levels compared with the wild-type alleles. The interaction between obesity, activation of the RAS, and hypertension has been mentioned in several experimental studies. These effects may be induced by AGT, which is expressed in and released by mature adipocytes.28 In addition, Ang II indirectly mediates AGTR1 expression to regulate adipose tissue growth and metabolism.29 There is also an association between RAS components and glucose metabolism: based on the mean of HbA1C levels among participants with the variant AGTR1 rs5186 genotype in our study, these individuals could be classified as having prediabetes and hyperglycemia. In line with this, a previous report in a Tunisian population found that the risk of type 2 diabetes in individuals with a RAS-related SNP (AGT M235T, ACE I/D, or AT1R A1166C) was 1.9 times higher than in those without.30 This association may be mediated by Ang II, which decreases insulin secretion, induces systemic insulin resistance and interferes with the translocation of glucose transporter-4.31 Therefore, AGT rs699 and AGT1 rs5186 variants appear to be directly associated with systemic metabolism.
In addition, the present study revealed that AGT rs699 and AGT1 rs5186 polymorphisms were significantly associated with BP and hypertension, supported by SNPStats analysis of the genes individually and combined. Possession of mutant alleles of AGT rs699 and AGTR1 rs5186 was significantly associated with higher SBP and/or DBP at baseline and follow-up. These results agree with previous studies. For example, a prospective cohort study demonstrated that the AGTR1 rs5186 A1166C polymorphism was associated with increased BP in individuals with the CC genotype; in addition, at follow-up, there were more new cases of MS in participants with the CC and CA genotypes than those with the wild-type genotype.32 Another study found that the T allele of AGT rs699 and C allele of AGTR1 rs5186 were associated with hypertension and MS.33 The association between these SNPs and hypertension is also supported by mechanistic studies.34–36 The AGTR1 rs5186 A1166C polymorphism is a functional mutation resulting in upregulation of AGTR1. Previous study in spontaneously hypertensive rats found that an increase in gene expression level of AT1R associated with increase in the extracellular signal-regulated kinase 1/2 (ERK2), affecting change of blood pressure.34 These associations may be explained by the role of ERK2 signaling pathway modulates vascular oxidative stress and subsequently mediates spontaneous tone in hypertension.35 Genetic variants of the AGT rs699 gene lead to increased production of AGT and Ang II: a previous study in rats found that infusion of Ang II was associated with endothelial dysfunction and progressive and sustained hypertension, mediated by activation of p38 mitogen-activated protein kinase and ROS generation.36 These results add to existing evidence of the effect of AGT rs699 and AGT1 rs5186 genetic variations on hypertension.
We also found that combined variant alleles of both SNPs increased the odds of hypertension and hypertension with MS. Since high BP is an MS component and is associated with obesity, dyslipidemia, and insulin resistance, genetic factors that govern BP are likely to have a role in the development of MS. Indeed, a previous study found that individuals with the CC genotype of the AGTR1 rs5186 polymorphism were 2.8 times more likely to develop new-onset MS that those with the AA genotype.32 Ang II is a likely connecting factor between MS components, including obesity and dyslipidemia and the RAS: along with its classic function in BP control, Ang II also has a role in the differentiation, metabolism, and gene expression of adipocytes.37 In addition, mice lacking various components of the RAS have reduced adiposity, with proposed mechanisms including decreased food intake, elevated energy expenditure, reduced fat absorption, adipocyte hypotrophy, and decreased inflammation.38 Finally, chronic Ang II infusion in mice stimulates hepatic TG production and subsequently leads to the development of insulin resistance.39 These findings suggest that, when involved in the RAS, genetic determinants of BP are also strongly associated with other MS components.
Furthermore, we built a network of AGT and AGTR1 gene interactions using GeneMania, (http://genemania.org) for potential prediction of both SNPs interactions on hypertension40 (Figure 2). Proposed hypotheses relate to in-depth mechanisms and the functional interaction of genes, including regulation of blood pressure by renin-angiotensin, regulation of angiotensin levels in blood, vasoconstriction, G-protein-coupled receptor activity, regulation of reactive oxygen species metabolic process, reactive oxygen species metabolic process, and regulation of nitric-oxide synthase activity. The strongest functional links in at least 3–4 functional areas of interaction were observed with the genes; Renin (REN), Angiotensin II Receptor Type 2 (AGTR2), Type-1 angiotensin II receptor-associated protein (AGTRAP), 5-Hydroxytryptamine Receptor 2B (HTR2B), Janus kinase 2 (JAK2) and Glutamyl Aminopeptidase (ENPEP).
 |
Figure 2 A network of AGT and AGTR1 gene interactions using GeneMania, (http://genemania.org). |
Our study has some limitations. First, we used data from the EGAT cohort study, with a relative small sample size of 354 participants, and limited numbers of homozygous variant carriers for both SNPs. Future research with larger numbers of participants is required to establish a causal relationship and potential mechanisms underlying the associations between AGT rs699 and AGTR1 rs5186 polymorphisms and BP, hypertension, and MS. Second, our study analyzed only two SNPs of the RAS; studying additional genes in this system, such as ACE and AGTR2, would enable additional links between the RAS and dyslipidemia, insulin resistance, and CVD risk to be established. Finally, we only had data on exercise, smoking, and alcohol consumption as modifiable risk factors. Collection of data via food frequency questionnaires to determine dietary fat and sodium intake would have provided insight into the effects of diet as a modifiable risk factor on hypertension in susceptible individuals.
Conclusion
AGT rs699 and AGTR1 rs5186 polymorphisms were associated with increased BP, hypertension and MS. Our findings highlight the role of unmodifiable genetic variations in hypertension development. Strategies for lifestyle modifications in such individuals is necessary to treat risk factors and prevent the development of CVDs.
Acknowledgments
This research was funded by the Thailand Research Fund, grant number 485/2563. The authors would like to express their gratitude to all of the EGAT study participants as well as the research staff at the Research and Innovation Center, Faculty of Medicine Ramathibodi Hospital, Mahidol University.
Disclosure
The authors report no conflicts of interest in this work.
References
1. World Health Organization. Global Health Risks: Mortality and Burden of Disease Attributable to Selected Major Risks. Geneva: World Health Organization; 2023.
2. Mills KT, Stefanescu A, He J. The global epidemiology of hypertension. Nat Rev Nephrol. 2020;16(4):223–237. doi:10.1038/s41581-019-0244-2
3. Zhang Y, Feng Y, Chen S, et al. Relationship between the duration of smoking and blood pressure in Han and ethnic minority populations: a cross-sectional study in China. BMC Public Health. 2021;21(1):135. doi:10.1186/s12889-020-09975-w
4. Briasoulis A, Agarwal V, Messerli FH. Alcohol consumption and the risk of hypertension in men and women: a systematic review and meta-analysis. J Clin Hypertens (Greenwich). 2012;14(11):792–798. doi:10.1111/jch.12008
5. Ambrose JA, Barua RS. The pathophysiology of cigarette smoking and cardiovascular disease: an update. J Am Coll Cardiol. 2004;43(10):1731–1737. doi:10.1016/j.jacc.2003.12.047
6. Husain K, Ansari RA, Ferder L. Alcohol-induced hypertension: mechanism and prevention. World J Cardiol. 2014;6(5):245–252. doi:10.4330/wjc.v6.i5.245
7. Tang N, Ma J, Tao R, et al. The effects of the interaction between BMI and dyslipidemia on hypertension in adults. Sci Rep. 2022;12(1):927. doi:10.1038/s41598-022-04968-8
8. Cabrera CP, Ng FL, Nicholls HL, et al. Over 1000 genetic loci influencing blood pressure with multiple systems and tissues implicated. Hum Mol Genet. 2019;28(R2):R151–R161. doi:10.1093/hmg/ddz197
9. Shahid M, Rehman K, Akash MSH, et al. Genetic polymorphism in angiotensinogen and its association with cardiometabolic diseases. Metabolites. 2022;12(12):1291. doi:10.3390/metabo12121291
10. Sethi AA, Nordestgaard BG, Tybjaerg-Hansen A. Angiotensinogen gene polymorphism, plasma angiotensinogen, and risk of hypertension and ischemic heart disease: a meta-analysis. Arterioscler Thromb Vasc Biol. 2003;23(7):1269–1275. doi:10.1161/01.ATV.0000079007.40884.5C
11. Takeuchi F, Yamamoto K, Katsuya T, et al. Reevaluation of the association of seven candidate genes with blood pressure and hypertension: a replication study and meta-analysis with a larger sample size. Hypertens Res. 2012;35(8):825–831. doi:10.1038/hr.2012.43
12. Masenga SK, Kirabo A. Hypertensive heart disease: risk factors, complications and mechanisms. Front Cardiovasc Med. 2023;10:1205475. doi:10.3389/fcvm.2023.1205475
13. Chandra S, Narang R, Sreenivas V, et al. Association of angiotensin II type 1 receptor (A1166C) gene polymorphism and its increased expression in essential hypertension: a case-control study. PLoS One. 2014;9(7):e101502. doi:10.1371/journal.pone.0101502
14. Junusbekov Y, Bayoglu B, Cengiz M, et al. AGT rs699 and AGTR1 rs5186 gene variants are associated with cardiovascular-related phenotypes in atherosclerotic peripheral arterial obstructive disease. Ir J Med Sci. 2020;189(3):885–894. doi:10.1007/s11845-019-02166-6
15. Stanković A, Kolaković A, Živković M, et al. Angiotensin receptor type 1 polymorphism A1166C is associated with altered AT1R and miR-155 expression in carotid plaque tissue and development of hypoechoic carotid plaques. Atherosclerosis. 2016;248:132–139. doi:10.1016/j.atherosclerosis.2016.02.032
16. Vathesatogkit P, Woodward M, Tanomsup S, et al. Cohort profile: the electricity generating authority of Thailand study. Int J Epidemiol. 2012;41(2):359–365. doi:10.1093/ije/dyq218
17. Unger T, Borghi C, Charchar F, et al. 2020 International Society of Hypertension Global Hypertension Practice Guidelines. Hypertension. 2020;75(6):1334–1357. doi:10.1161/HYPERTENSIONAHA.120.15026
18. Huang PL. A comprehensive definition for metabolic syndrome. Dis Model Mech. 2009;2(5–6):231–237. doi:10.1242/dmm.001180
19. Miller S, Dykes D, Polesky H. A simple salting out procedure for extracting DNA from human nucleated cells. Nucleic Acids Res. 1988;16(3):1215. doi:10.1093/nar/16.3.1215
20. Solé X, Guinó E, Valls J, et al. SNPStats: a web tool for the analysis of association studies. Bioinformatics. 2006;22(15):1928–1929. doi:10.1093/bioinformatics/btl268
21. Kokubo Y, Padmanabhan S, Iwashima Y, et al. Gene and environmental interactions according to the components of lifestyle modifications in hypertension guidelines. Environ Health Prev Med. 2019;24(1):19. doi:10.1186/s12199-019-0771-2
22. Pan WH, Yeh WT. How to define obesity? Evidence-based multiple action points for public awareness, screening, and treatment: an extension of Asian-Pacific recommendations. Asia Pac J Clin Nutr. 2008;17(3):370–374.
23. Jiang SZ, Lu W, Zong XF, et al. Obesity and hypertension. Exp Ther Med. 2016;12(4):2395–2399. doi:10.3892/etm.2016.3667
24. Yiannikouris F, Karounos M, Charnigo R, et al. Adipocyte-specific deficiency of angiotensinogen decreases plasma angiotensinogen concentration and systolic blood pressure in mice. Am J Physiol Regul Integr Comp Physiol. 2012;302(2):R244–251. doi:10.1152/ajpregu.00323.2011
25. Charoen P, Eu-Ahsunthornwattana J, Thongmung N, et al. Contribution of Four Polymorphisms in Renin-Angiotensin-Aldosterone-Related Genes to Hypertension in a Thai Population. Int J Hypertens. 2019;2019:4861081. doi:10.1155/2019/4861081
26. Yang YL, Mo YP, He YS, et al. Correlation between renin-angiotensin system gene polymorphisms and essential hypertension in the Chinese Yi ethnic group. J Renin Angiotensin Aldosterone Syst. 2015;16(4):975–981. doi:10.1177/1470320315598697
27. Azova M, Timizheva K, Ait Aissa A, et al. Gene Polymorphisms of the renin-angiotensin-aldosterone system as risk factors for the development of in-stent restenosis in patients with stable coronary artery disease. Biomolecules. 2021;11(5):763. doi:10.3390/biom11050763
28. Engeli S, Schling P, Gorzelniak K, et al. The adipose-tissue renin-angiotensin-aldosterone system: role in the metabolic syndrome? Int J Biochem Cell Biol. 2003;35(6):807–825. doi:10.1016/s1357-2725(02)00311-4
29. Kouyama R, Suganami T, Nishida J, et al. Attenuation of diet-induced weight gain and adiposity through increased energy expenditure in mice lacking angiotensin II type 1a receptor. Endocrinology. 2005;146(8):3481–3489. doi:10.1210/en.2005-0003
30. Mehri S, Koubaa N, Hammami S, et al. Genotypic interactions of renin-angiotensin system genes with diabetes type 2 in a Tunisian population. Life Sci. 2010;87(1–2):49–54. doi:10.1016/j.lfs.2010.05.010
31. Gutierrez-Rodelo C, Arellano-Plancarte A, Hernandez-Aranda J, et al. Angiotensin II inhibits insulin receptor signaling in adipose cells. Int J Mol Sci. 2022;23(11):6048. doi:10.3390/ijms23116048
32. Palatini P, Ceolotto G, Dorigatti F, et al. Angiotensin II type 1 receptor gene polymorphism predicts development of hypertension and metabolic syndrome. Am J Hypertens. 2009;22(2):208–214. doi:10.1038/ajh.2008.319
33. Zotova TY, Kubanova AP, Azova MM, et al. Analysis of polymorphism of angiotensin system genes (ACE, AGTR1, and AGT) and gene ITGB3 in patients with arterial hypertension in combination with metabolic syndrome. Bull Exp Biol Med. 2016;161(3):334–338. doi:10.1007/s10517-016-3408-0
34. Reja V, Goodchild AK, Phillips JK, et al. Upregulation of angiotensin AT1 receptor and intracellular kinase gene expression in hypertensive rats. Clin Exp Pharmacol Physiol. 2006;33(8):690–695. doi:10.1111/j.1440-1681.2006.04420.x
35. Ding L, Chapman A, Boyd R, et al. ERK activation contributes to regulation of spontaneous contractile tone via superoxide anion in isolated rat aorta of angiotensin II-induced hypertension. Am J Physiol Heart Circ Physiol. 2000;292(6):H2997–3005. doi:10.1152/ajpheart.00388.2006
36. Bao W, Behm DJ, Nerurkar SS, et al. Effects of p38 MAPK Inhibitor on angiotensin II-dependent hypertension, organ damage, and superoxide anion production. J Cardiovasc Pharmacol. 2007;49(6):362–368. doi:10.1097/FJC.0b013e318046f34a
37. Kim S, Dugail I, Standridge M, et al. Angiotensin II-responsive element is the insulin-responsive element in the adipocyte fatty acid synthase gene: role of adipocyte determination and differentiation factor 1/sterol-regulatory-element-binding protein 1c. Biochem J. 2001;357(Pt3):899–904. doi:10.1042/0264-6021:3570899
38. de Kloet AD, Krause EG, Woods SC. The renin angiotensin system and the metabolic syndrome. Physiol Behav. 2010;100(5):525–534. doi:10.1016/j.physbeh.2010.03.018
39. Ran J, Hirano T, Adachi M. Chronic ANG II infusion increases plasma triglyceride level by stimulating hepatic triglyceride production in rats. Am J Physiol Endocrinol Metab. 2004;287(5):E955–961. doi:10.1152/ajpendo.00199.2004
40. Montojo J, Zuberi K, Rodriguez H, et al. GeneMANIA Cytoscape plugin: fast gene function predictions on the desktop. Bioinformatics. 2010;26(22):2927–2928. doi:10.1093/bioinformatics/btq562
 © 2023 The Author(s). This work is published and licensed by Dove Medical Press Limited. The
full terms of this license are available at https://www.dovepress.com/terms
and incorporate the Creative Commons Attribution
- Non Commercial (unported, 3.0) License.
By accessing the work you hereby accept the Terms. Non-commercial uses of the work are permitted
without any further permission from Dove Medical Press Limited, provided the work is properly
attributed. For permission for commercial use of this work, please see paragraphs 4.2 and 5 of our Terms.
© 2023 The Author(s). This work is published and licensed by Dove Medical Press Limited. The
full terms of this license are available at https://www.dovepress.com/terms
and incorporate the Creative Commons Attribution
- Non Commercial (unported, 3.0) License.
By accessing the work you hereby accept the Terms. Non-commercial uses of the work are permitted
without any further permission from Dove Medical Press Limited, provided the work is properly
attributed. For permission for commercial use of this work, please see paragraphs 4.2 and 5 of our Terms.
Recommended articles
Metabolic Syndrome and Tendon Disease: A Comprehensive Review
Lai C, Li R, Tang W, Liu J, Duan XD, Bao D, Liu H, Fu S
Diabetes, Metabolic Syndrome and Obesity 2024, 17:1597-1609
Published Date: 9 April 2024