Back to Journals » Clinical and Experimental Gastroenterology » Volume 13
Effects of Aerobic Exercise Protocol on Genes Related to Insulin Resistance and Inflammation in the Pancreas of ob/ob Mice with NAFLD
Authors Simões e Silva LL ![]() , Santos de Sousa Fernandes M, Kubrusly MS, Muller CR, Américo ALV
, Santos de Sousa Fernandes M, Kubrusly MS, Muller CR, Américo ALV ![]() , Stefano JT
, Stefano JT ![]() , Evangelista FS
, Evangelista FS ![]() , Oliveira CP
, Oliveira CP ![]() , Jukemura J
, Jukemura J ![]()
Received 14 December 2019
Accepted for publication 4 April 2020
Published 19 June 2020 Volume 2020:13 Pages 223—234
DOI https://doi.org/10.2147/CEG.S242393
Checked for plagiarism Yes
Review by Single anonymous peer review
Peer reviewer comments 2
Editor who approved publication: Professor Everson Artifon
Lucas Lucena Simões e Silva,1 Matheus Santos de Sousa Fernandes,1 Márcia Saldanha Kubrusly,2 Cynthia Rodrigues Muller,3 Anna Laura Viacava Américo,3 Jose Tadeu Stefano,1 Fabiana Sant’Anna Evangelista,3 Claudia Pinto Oliveira,1 José Jukemura4
1Division of Gastroenterology and Hepatology, Department of Gastroenterology (LIM 07), University of São Paulo School of Medicine, São Paulo, Brazil; 2Department of Experimental Pathophysiology, Faculty of Medicine, University of Sao Paulo, Sao Paulo, Brazil; 3School of Arts, Science and Humanities, University of São Paulo, São Paulo, Brazil; 4Division of Digestive Surgery - Department of Gastroenterology, São Paulo State Cancer Institute - HCFMUSP, University of Sao Paulo School of Medicine, Sao Paulo, Brazil
Correspondence: Lucas Lucena Simões e Silva
University of Sao Paulo School of Medicine, Department of Gastroenterology, Av. Dr. Arnaldo, 455, São Paulo, Cerqueira Cesar 01246-903, Brazil
Tel +55 (11) 3061-7000
Email [email protected]
Purpose: To evaluate the effect of 8 weeks of aerobic training on insulin resistance and inflammatory response in obese mice (ob/ob) with NAFLD.
Materials and Methods: Male ob/ob mice were randomly divided into sedentary (n=7) and trained (n=7) groups. Aerobic training consisted of 5 weekly sessions, 60 min per session at 60% of the maximum speed of the running test. Hepatic and pancreatic samples were collected to evaluate histological features and gene expression associated with insulin resistance and inflammatory response after 8-week experiment protocol. RNA was performed by TRIzol®. PCR experiments were performed using the Rotor-Gene RG-3000. Parametric data were assessed by t-test, one-way ANOVA and Bonferroni test for multiple comparisons. Non-parametric data were assessed by the Mann–Whitney tests with Dunn’s post-test of multiple comparisons. Histological analysis was assessed by chi-square test with Fisher’s exact test. Significant variables were considered when p< 0.05. All the analyses were performed by GraphPad Prism V6.0 software (GraphPad Software Inc.).
Results: Reductions in bodyweight (p = 0.008), weight evolution (p = 0.03), food intake (p < 0.0001) and fat content were observed in trained group. Moreover, the trained group showed better results in peak velocity (p=0.03) physical effort tolerance (p=0.006) and distance (p=0.01). Gene expression showed differences in IL-10 (p=0.03) and GLUT-2 (p=0.03) in hepatic analysis, between groups. Pancreatic gene expression showed difference between groups in IRS-2 (p=0.004), GLUT-2 (p=0.03) and IL-10 (p=0.008) analysis. Also, the trained group showed lower values for interlobular fat and inflammatory infiltrate in histological analysis when compared to sedentary animals.
Conclusion: An 8-week physical training protocol was able to attenuate bodyweight gain, food intake and generate positive effects on gene expression related to insulin resistance and inflammation in both liver and pancreas of ob/ob mice.
Keywords: fatty liver, exercise, obese mice, insulin resistance, inflammation, pancreas
Introduction
Non-alcoholic fatty liver disease (NAFLD) encompasses a wide spectrum of hepatic modifications ranging from simple steatosis, without inflammation or fibrosis, to non-alcoholic steatohepatitis (NASH), cirrhosis, and hepatocellular carcinoma in the absence of alcohol consumption. It is considered the most common hepatic manifestation in Western population.1
Insulin resistance has been characterized as the crucial pathophysiological factor in NAFLD.2 Both hepatic and peripheral insulin resistance have strong correlation with NAFLD, regardless of disease severity.3 Pathophysiological processes of NAFLD involve other organs including the pancreas. Excessive accumulation of ectopic fat in the pancreas is referred to as pancreatic steatosis or non-alcoholic fatty pancreatic disease (NAFPD).4 In recent years, it has become an increasingly recognized condition, being present in about 67% of patients with NAFLD.5 Animal studies demonstrate that long-term exposure to a hyperlipidic diet induces accumulation of interlobular and intralobular fat, infiltration of inflammatory cells and fibrosis in the pancreas and pancreatic islets dysfunction.6 In addition, NAFPD is associated with other clinical conditions such as insulin resistance, diabetes, hyperlipidemia, metabolic syndrome, and obesity.7,8
Leptin deficient obese mice (ob/ob mice) are characterized by an excessive intake of nutrients and deficiency to leptin, which in turn, acts on these animals in determining the phenotype of obesity, hyperglycemia and hyperinsulinemia,9,10 being used in studies evaluating pathophysiological conditions such as: diabetes, obesity, inflammatory response and insulin resistance. The metabolic condition of ob/ob mice induces redistribution in body fat storage, non-fat tissues and hepatic content, making it a potential model for the study of NAFLD.
Aerobic exercise training (AET) has been widely used for the prevention and treatment of obesity, insulin resistance (IR) and type 2 diabetes (T2D) because it is able to improve mitochondrial function and fatty acid oxidation11,12 improves insulin sensitivity and glucose uptake in the skeletal muscle and ameliorates inflammatory response.13 It is highly supported by the American Gastroenterological Association and American Association for the Study of Liver Diseases that chronic aerobic exercise is a major component and plays a fundamental role in the treatment for NAFLD being considered as first-line treatment, however, the underlying mechanisms associated with disease progression are not fully understood. Therefore, the present study proposes to evaluate the effect of physical training on markers of inflammatory response and insulin resistance in ob/ob mice with NAFLD.
Materials and Methods
Animals
Male ob/ob mice (8 weeks old) were randomly divided into sedentary group (SED; n=7) and trained group (TF; n=7), kept under the same housing conditions (light/dark cycles of 12 hours at 22 ± 2 ° C and controlled ventilation), with water and food ad libitum. The present study followed the recommended guidelines of the Animal Experimentation Service of the Medical School of the University of São Paulo and was approved by the Ethics Committee on the Use of Animals (CEUA).
Running Capacity Test
Running capacity was assessed before, in the fourth and eighth weeks of aerobic exercise training (AET) using a progressive test without inclination on a treadmill. The initial speed was 0.4 km/h and the speed was increased by 0.2 km/h every three minutes until exhaustion of the animal, which was characterized by the impossibility of maintaining the standard rate. This protocol and its procedures were previously tested and validated by Ferreira.14
Aerobic Exercise Protocol
Aerobic exercise protocol was performed on a treadmill, 5 times a week, during 8 weeks. All training sessions had established intensities of 60% of running capacity maximum speed, and time being progressively increased, starting with 30 minutes in the first week and reaching 60 minutes in the fourth week, as described by Ferreira. After the fourth week, all sessions lasted 60 minutes. To minimize the influence of treadmill stress, the sedentary animals were placed on the treadmill for 10 min once a week at 0.3 km/h during the experimental protocol.
Bodyweight and Food Intake
Bodyweight was weekly measured in a digital balance (Gehaka/BG4001, Sao Paulo, Brazil) at the same time of day. Bodyweight evolution and bodyweight gain were calculated by the difference between the final bodyweight (week 8) and initial bodyweight (week 0). The 24-h water and food intake were determined weekly throughout the study in mice that were housed at three or four animals per cage. Also, the animals had free access to water and food ad libitum. A Nuvilab CR1 branded feed was used for a standard diet for both study groups.
Histological Analysis
Hepatic samples were collected from segments ll and lll of left lobe, which is more related to the onset and progression of NAFLD.15,16 Pancreatic samples were collected from the portion near the duodenum. Both tissues were fixed in 4% formalin solution, processed and submitted to hematoxylin-eosin (HE) staining. The histological slides of each tissue were evaluated in a “blind” way by an experienced pathologist. In the liver, we used a modified rodent score system proposed by Liang.17 The histological variables present in this system are: macrovesicular steatosis (0–3), microvesicular steatosis (0–3), hepatocellular hypertrophy (0–3) and foci of inflammation (0–3). The sum for steatosis ranges from 0 to 9.
Since there is no specific and validated score system for pancreatic analyses, the histological variables were: interlobular fat, intralobular fat, fibrosis, edema, acinar necrosis, inflammatory infiltrate, hemorrhage and fat necrosis.
RNA Quantification
Total RNA was extracted from liver and pancreas using TRIzol reagent according to the product’s technical specifications (Invitrogen Life Technologies, USA). RNA integrity was evaluated by 1% agarose gel electrophoresis and spectrophotometer quantification at 260 and 280nm. Samples whose ratio A260/280 were between 1.8 and 2.0 were used. RT-qPCR (Table 1) reactions were performed on the Rotor-Gene RG-3000 equipment (Corbett Research, Sydney, Australia) using SuperScript™ Platinum® One-Step Quantitative RT-PCR System reagents (Invitrogen Life Technologies, Carlsbad, USA) as recommended by the manufacturer. All RT-q PCR reactions were performed in duplicate for each tissue sample for both the target gene and the endogenous control (β-actin).
2−ΔΔCT Method was used for relative quantification. Ct (“threshold cycle”) is the real-time PCR cycle, where amplification reaches the logarithmic phase. ΔCt is the difference in expression between target gene and endogenous control of a given sample and ΔΔCt corresponds to the difference between the ΔCt of the sample and the ΔCt of the control.
Statistical Analysis
Data are expressed as mean or median (depending on the distribution of the variables) and their respective minimum (min), maximum (max) and standard deviation (SD) values. For parametric distribution variables, we used t-test, one-way ANOVA and Bonferroni post-test with multiple comparisons. For non-parametric distribution variables, Mann–Whitney, Kruskal–Wallis and Dunn’s post-test of multiple comparisons were used. We used chi-square test with Fisher’s exact test for histological scores between groups. For all statistical analysis, significance was set at p<0.05. All analyses were performed with GraphPad Prism V6.0 software (GraphPad Software Inc.).
Results
Running Capacity Test
Before the aerobic exercise protocol, no differences in running capacity test were observed between groups, however, at the end of the protocol, differences were observed for peak velocity, distance and time of exposure to the exercise test between groups (Figure 1). Data obtained in the fourth week were used only to adjust the intensity of PT (not shown).
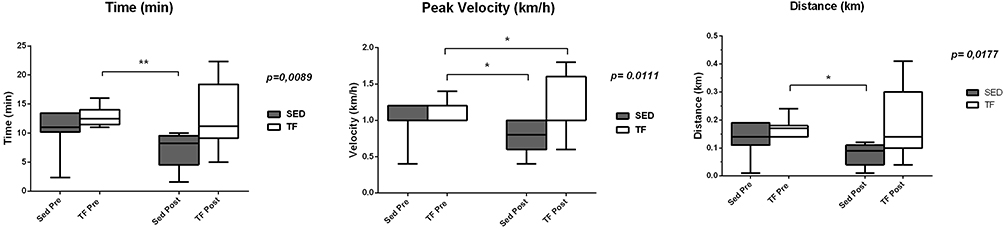 |
Figure 1 Data obtained from running capacity test of ob/ob mice after 8 weeks of aerobic exercise protocol. |
Bodyweight and Food Intake
Before the training protocol, no significant differences were observed between groups; however, after 8 weeks of protocol, significant differences were observed in the mean bodyweight of trained animals (TF: 12.9±2.9 vs SED: 9.6±2.1 p=0.008). In addition, bodyweight gain analysis showed significant differences between groups from the third week of training (Figure 2). Sedentary animals obtained an average weight gain of 35% during the whole experimental protocol while the animals submitted to aerobic training obtained 26%. Also, significant differences were found in both food and water intake (Table 2). In both analyses, sedentary animals presented higher values compared to trained animals (Table 2).
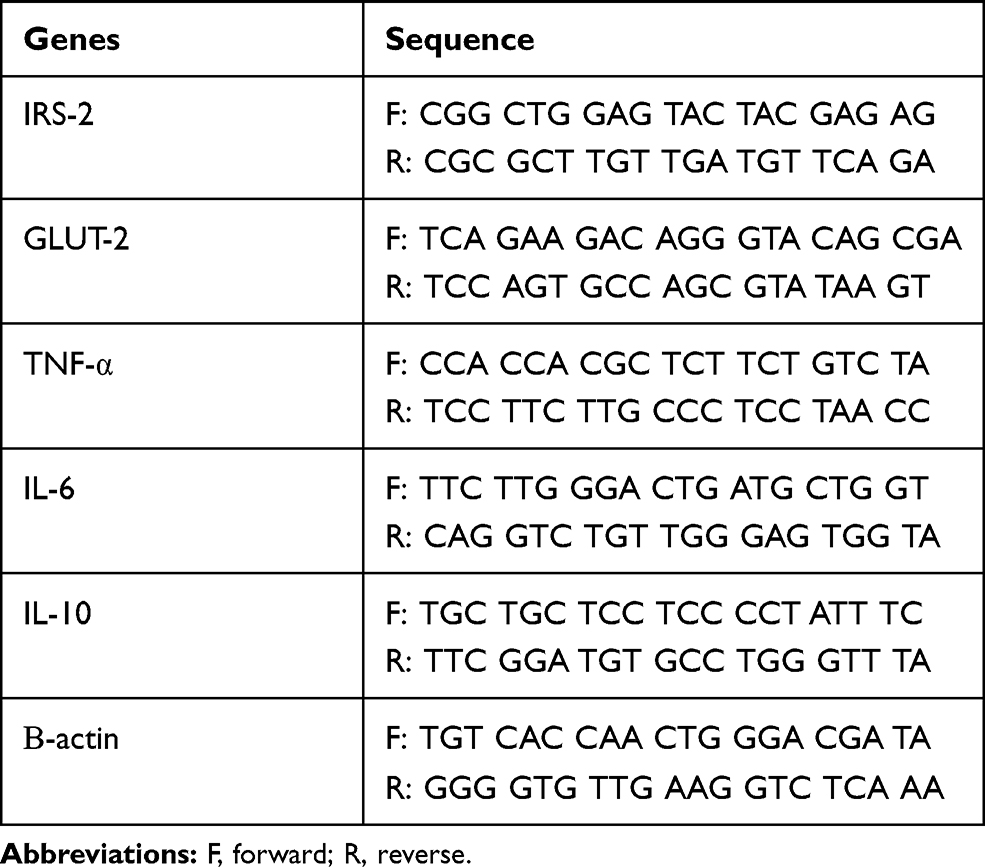 |
Table 1 Primers Sequence (Forward/Reverse) Used in the qRT-PCR Reaction for Each Gene Studied |
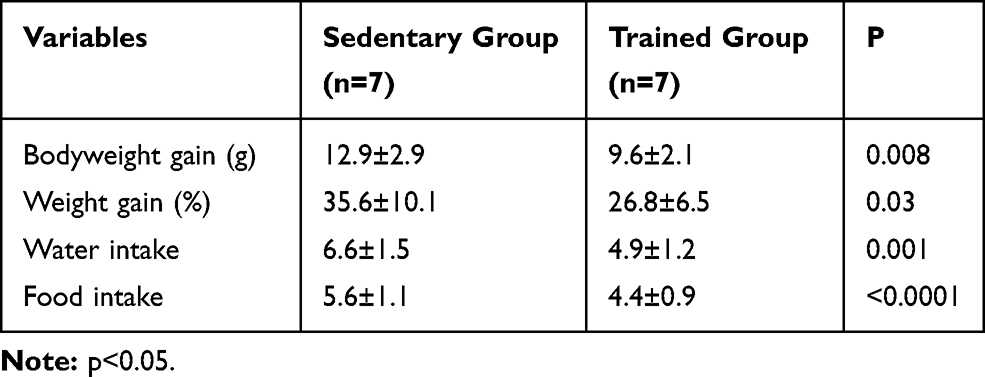 |
Table 2 Bodyweight Gain and Food Intake at the End of the Experimental Protocol |
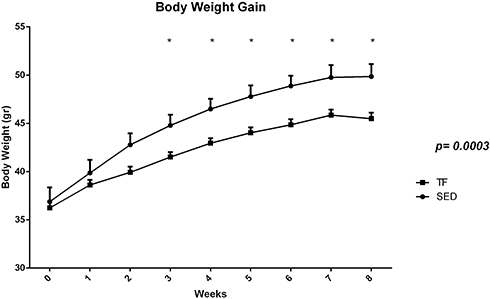 |
Figure 2 Average bodyweight and bodyweight gain during 8-week aerobic physical training protocol of both study groups. |
Adipose Tissue and Hepatic Weight
Table 3 shows the main differences between groups after 8 weeks or aerobic exercise protocol. Statistical analysis showed that trained animals had lower values for hepatic weight (both absolute and relative weight analysis) and retroperitoneal adipose tissue (both absolute and relative weight)
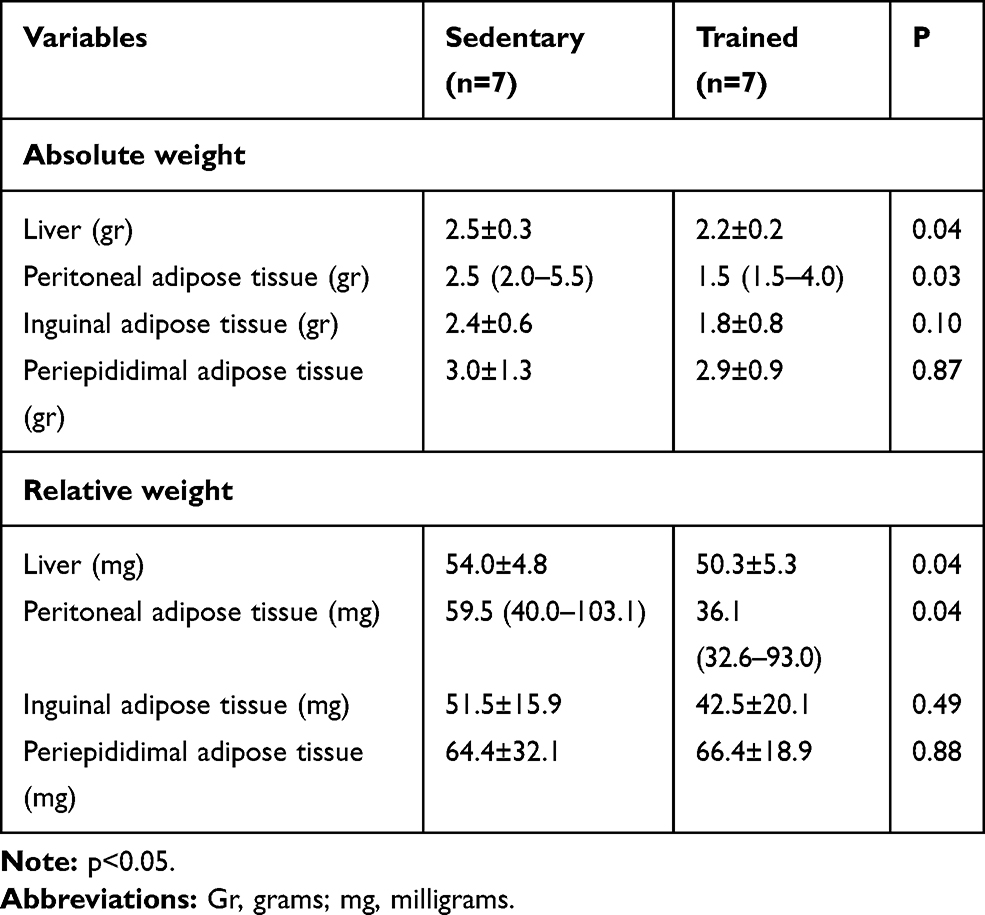 |
Table 3 Adipose Tissues and Hepatic Weight of ob/ob Mice from Both Groups at the End of the Aerobic Exercise Protocol (Absolute and Relative Weight) |
Liver Histology
Histological analysis in the liver showed no significant differences for macrovesicular steatosis, microvesicular steatosis, hepatocellular hypertrophy, and inflammatory foci (Table 4). Only a few differences can be observed between groups through images (Figure 3).
 |
Table 4 Histologic Features of Hepatic Tissue in ob/ob Mice |
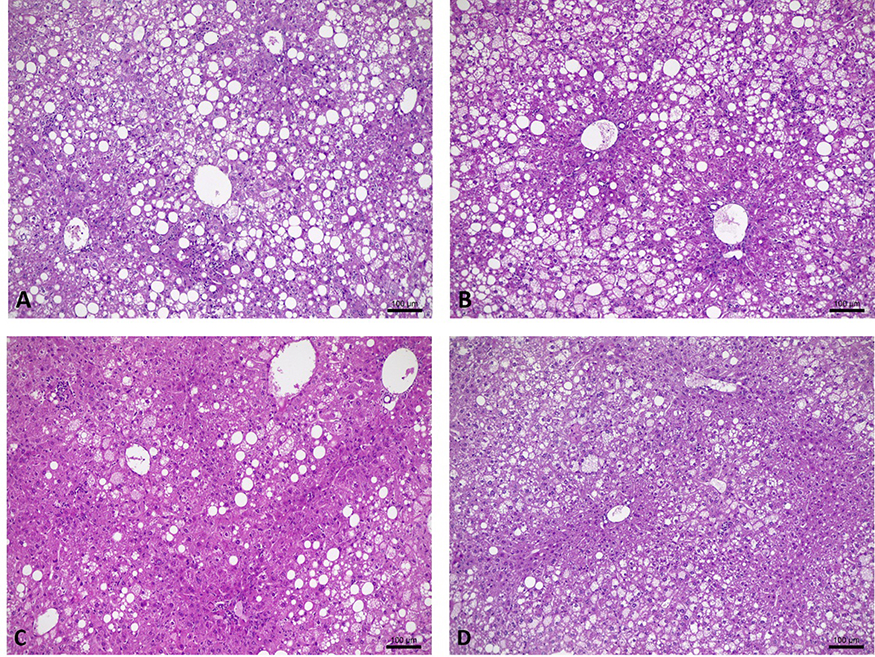 |
Figure 3 Liver histology of ob/ob mice. (A and B) Liver histology of sedentary animals (100 µm scale). (C and D) Liver histology of trained animals (100 µm scale). |
Pancreatic Histology
Due to the absence of a specific pancreas score, the group performed a descriptive table. The following variables were analyzed: interlobular fat, intralobular fat, fibrosis, edema, acinar necrosis, inflammatory infiltrate, hemorrhage and fat necrosis. The following table describes the characteristics of each animal evaluated (Table 5). Through histological images, it was observed morphological preservation of both pancreatic tissue and organ (Figures 4 and 5), and no signs of fat infiltration (Figures 6 and 7).
 |
Table 5 Description of Pancreatic Histological Analysis Performed in Both Study Groups After 8 Weeks of Aerobic Exercise Protocol |
 |
Figure 4 Pancreatic histology of sedentary ob/ob mouse without fat infiltration. 1 = Langerhans islet; 2 = blood vessel (original magnification ×40). |
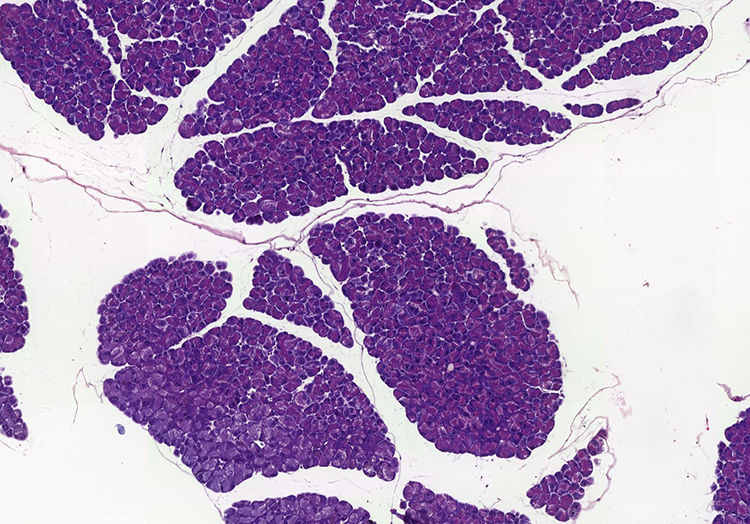 |
Figure 5 Panoramic view of the sedentary ob/ob mouse pancreas with preserved morphology and tissue (original magnification ×20). |
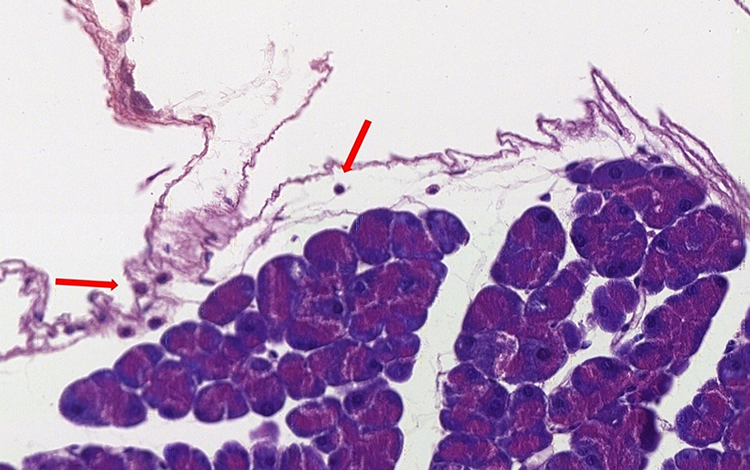 |
Figure 6 Sedentary ob/ob mouse pancreatic accino. Presence of rare lymphocytes (arrow) in loose periacinar tissue (original magnification ×40). |
 |
Figure 7 ob/ob trained mouse pancreas with visceral fat adjacent (arrow) to pancreatic parenchyma with no signs of lobular infiltration (original magnification ×5). |
Gene Expression
Hepatic Tissue
Hepatic gene expression showed statistical differences between sedentary and trained for GLUT-2 (1.5±0.6 vs 0.7±0.3) (Figure 8). For inflammation analysis, differences were found for IL-6 (1.1 (0.3–1.9) vs 3.6 (0.7–5.3)) and IL-10 (0.7 (0.2–2.7) vs 1.3 (0.6–3.6)) (Figure 9). For the other genes, no significant differences were observed.
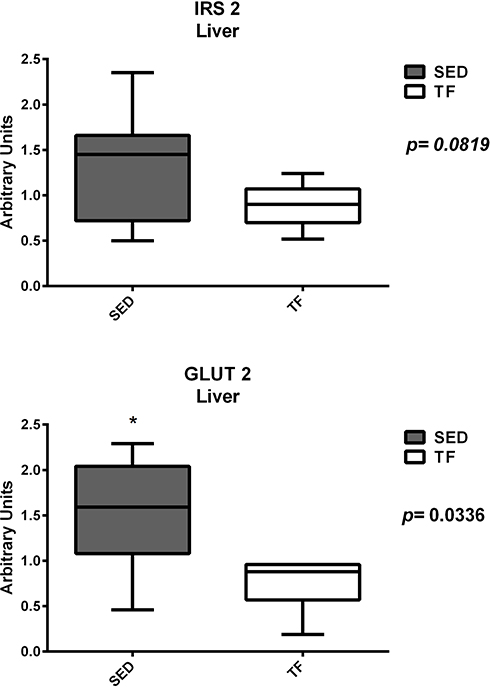 |
Figure 8 Hepatic expression of genes related to insulin resistance between groups. |
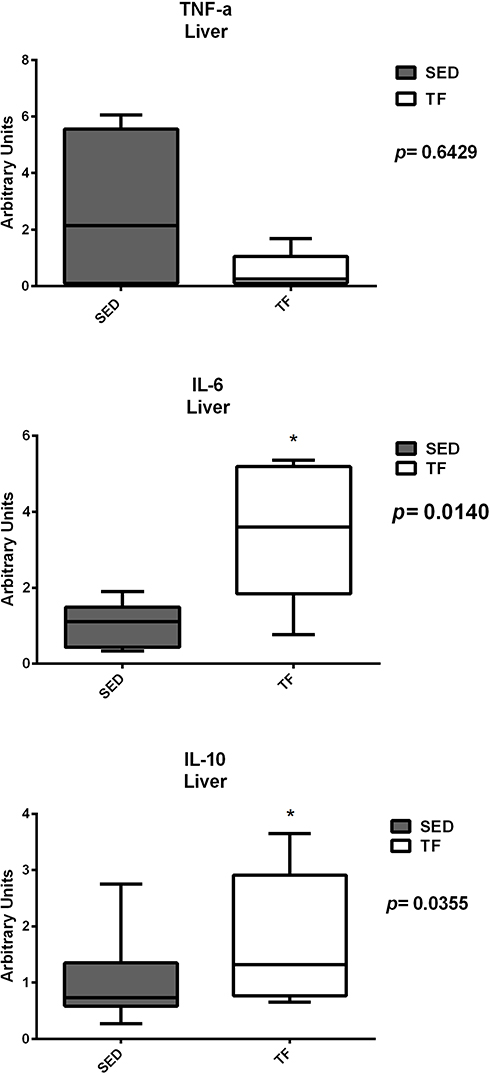 |
Figure 9 Hepatic expression of genes related to inflammation between groups. |
Pancreatic Tissue
Analysis of pancreatic gene expression, for insulin resistance, showed statistical differences between groups for IRS-2 (0.3 (0.1–0.9) vs 1.7 (0.7–5.2)) and GLUT-2 (0.5±0.3 vs 1.8±1.3) (Figure 10). Pancreatic genes related to inflammation showed statistical difference for IL-6 (0.07 (0.04–0.10) vs 3.1 (0.9–3.9)) and IL-10 (0.7 (0.4–1.7) vs 6.1 (1.1–14.3)) (Figure 11). No statistical differences observed for the other genes.
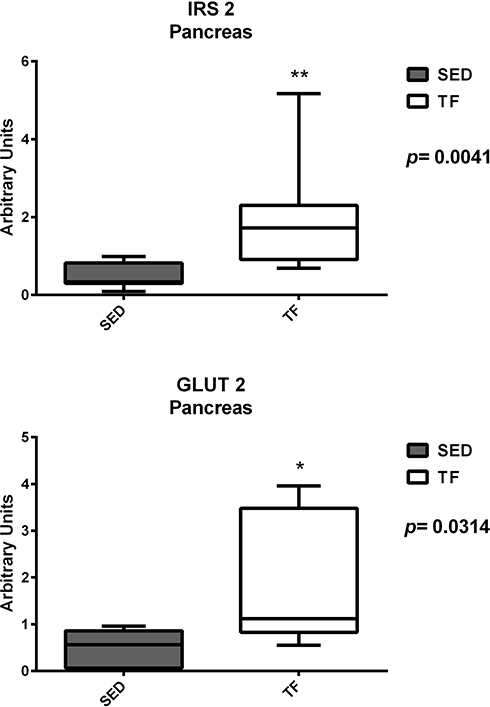 |
Figure 10 Pancreatic expression of genes related to insulin resistance between groups. |
 |
Figure 11 Pancreatic expression of genes related to inflammation between groups. |
Discussion
In the present study, the physical training attenuated the evolution in the bodyweight gain of the trained animals from the 3rd week showing an important metabolic impact on these animals (Figure 1). In addition, at the end of the protocol, sedentary animals presented a 35% weight gain percentage while trained animals presented a 26% percentage. Evangelista18 observed that aerobic training improved aspects related to bodyweight control and energy balance in obese mice (ob/ob mice) showing that the trained animals obtained a 23% increase in weight gain and sedentary animals 41%. In previous studies, physical training was able to control bodyweight gain in wild mice and animals fed high-fat cafeteria diet,19,20 and improvements insulin resistance, lipid metabolism, and greater tolerance to physical exercise.21
Regarding the water and food intake, we expected to find an increased food consumption of animals exposed to physical training, however, our results showed that trained animals had lower values for both water and food intake (Table 2). A possible explanation for this result may be the impact that continuous physical exercise causes on physiological processes. Physical exercise produces adjustments in blood flow, gastrointestinal hormone response, gastric emptying, muscle cell metabolism, adipose tissue biochemistry, and brain activity, this change may have interfered with some of the mechanisms involved in appetite control.22,23
Our results showed that the trained group had an increase in peak velocity in the pre-training moment compared to the post-training moment, showing that aerobic exercise was effective in improving this variable (Figure 1), corroborating with other authors as Evangelista,18 Higa,20 and Gollish.21 The increase in the peak velocity of these animals implies cardiorespiratory improvements and better oxidation capacity of skeletal muscle. Indeed, the oxidative capacity of skeletal muscle is a determining factor for exercise tolerance.24 Possible mechanisms induced by aerobic training that result in better oxidative metabolism are increases in the rate of glucose transport in skeletal muscle and in the transport of fatty acids to mitochondria.25
It is known that weight loss through lifestyle modifications reduces both visceral adipose tissue and liver fat content. 5% to 10% of weight loss is desirable for clinically significant reductions in visceral adipose tissue and for hepatic histological improvements (65% improvement in NAS score with weight loss>10%).26,27 In our study, the animals did not lose weight during the physical training protocol, so it was not possible to observe significant differences for liver histological analysis (Table 4). Studies indicate that although there is no weight loss through physical exercise, it is possible to observe positive effects on metabolic aspects in NAFLD and insulin resistance state.28,29 Therefore, regular exercise should be encouraged in the NAFLD population even if there are no significant changes in liver histology.
Since there is no specific histological score tool for the pancreas, our group performed a descriptive table of the analyzed data (Table 5). Through histopathological analysis, it was possible to observe that the trained animals had a slight decrease in pancreatic inflammation. A study by Mathur30 compared the differences between the pancreatic characteristics of ob/ob mice and their C57BL/6J (lean model). Histopathological results showed no statistical differences between groups, however obese animals had higher values in pancreatic fat content. However, more studies are needed involving interventions related to regular physical activity and physical exercise related to pancreatic fat infiltration, histologic analysis and features related to NAFLD.
The exposure to physical training, regardless of modality, is responsible to provide improvements in aspects related to insulin and glucose.31 Indeed, our group found significant differences in gene expression for IRS-2 and GLUT-2 (Figure 11) in the pancreas, ie, exposure to physical exercise was able to increase the expression of these genes, leading to improvements in both insulin receptors and glucose uptake. On the other hand, the increased expression of IRS-2 and GLUT-2 in the liver have different meanings when compared to the pancreas. It has been reported in animal studies that GLUT-2 expression is increased in response to hyperglycemia and decreased by hyperinsulinemia.32,33 In diabetic Wistars, an increase in hepatic GLUT-2 mRNA was observed, and this change was restored by the correction of glycemia by florizine, vanadium or insulin.34,35 Other studies in rat livers showed that GLUT-2 protein and mRNA increased 1.6 and 2-fold, respectively, after 3 weeks of diabetes,36,37 with a reverse response when these animals were exposed to insulin treatment for 5 days presenting gene levels similar to non-diabetic animals.37 Silva,38 showed that after 20 days of treatment with alloxan, Wistar rats showed a lower weight gain than the control group. In liver tissue, diabetes also promoted increased expression of GLUT-2, which was reversed with insulin administration. In our study, the exercise group had lower GLUT-2 expression values compared to the sedentary group (Figure 9), being similar to non-diabetes condition. Moreover, our results corroborate the findings of Silva showing that regular exercise, although not showing significant improvements in liver histology, acts on this organ with the same effect as synthetic insulin, contributing in the long term to improvements in aspects of NAFLD in both liver and pancreas.
Since physical exercise can significantly affect cellular homeostasis, it is not surprising that exercise increases plasma levels of various cytokines, including IL-6. Studies show that muscle contraction rapidly increases the expression of the IL-6 gene in skeletal muscles in rats39 and humans40,41 during prolonged exercises.39,42 Our findings for IL-6 in both organs were increased compared to sedentary animals (Figures 9 and 11). The first hint that IL-6 might also exert beneficial roles on the metabolism came from the observation that mice deficient for IL-6 (IL-6-/-) developed mature-onset diabetes with increased leptin and insulin levels, liver inflammation and hepato steatosis, in particular when fed a HFD.43,44 Interestingly, glucose homeostasis in these mice could be restored after TNF-a-inhibition or Kupffercell-depletion.45 In addition, increase in insulin sensitivity through upregulation of IRS-2 by adiponectin, a well-recognized anti-diabetic cytokine has been shown to be IL-6 mediated.46,47 These data show that IL-6 in the liver not only regulates glucose metabolism but is also necessary to maintain liver tissue homeostasis for proper control of metabolic functions. We believe that this increase was due to exposure to exercise, since it has a long duration and high muscle contraction. In addition, the TNF-α results of animals trained in both organs were lower compared to sedentary animals, although no significant differences were found. We believe that the increase in IL-6 expression was responsible for stimulating the activity of Interleukin 10 (IL-10), which in turn is able to inhibit the production of exacerbated circulating TNF-α. However, this hypothesis cannot be proven because it was not the objective of the present study.
Regarding IL-10, further studies in rodents fed a high-fat diet have shown that the presence of NAFLD and hyperglycemia was followed by low systemic IL-10 levels, leading to the proposition that IL-10 may have the ability to prevent hepatic steatosis and other metabolic abnormalities.48 Speretta49 evaluated the effect of eight weeks of high intensity/short duration strength training and moderate/long duration aerobic training on TNF-α and IL-10 gene expression and lipid profile. Regardless of exercise modality, animals undergoing physical training showed significant improvements in both TNF-a, IL-10 expression, as well as improvements in lipid profile and visceral fat content in their different compartments. These findings reinforce the idea that regular exercise generates potential benefits in controlling and maintaining not only the lipid profile, but also in improving IL-10 expression and inhibiting TNF-a expression. In our study, trained animals had higher IL-10 expression levels compared to sedentary animals (Figures 9 and 11). It is possible to state that the aerobic exercise training protocol had positive effects on the anti-inflammatory response, mainly in the pancreas of trained ob/ob animals and consequently, the improvement of IL-10 expression in these animals also favored the improvement and maintenance of the sensitivity to insulin, since this cytokine is strongly related to this phenomenon.
Conclusion
Eight-week aerobic exercise training protocol was able to promote positive modifications in both the liver and pancreas IRS-2 and GLUT-2 genes, as well as improvements in the expression of IL-10, conferring a protective factor on both organs. The study also showed that through this protocol, there was attenuation in the bodyweight gain of obese mice, improvements in food intake and increased exercise tolerance. Regarding the histopathological characteristics, it was not possible to observe a decrease in liver scores whereas in the pancreas, although no statistical differences were evidenced, the mice submitted to the aerobic training protocol presented lower histological values, especially in inflammatory infiltrate aspects.
Acknowledgments
We thank the Laboratory of Clinical and Experimental Gastroenterology (LIM-07), Laboratory of Transplantation and Liver Surgery (LIM-37) of the Department of Gastroenterology of the School of Medicine of the University of São Paulo (FMUSP) and Laboratory of Biomedicine of the School of Arts, Sciences and Humanities of USP (EACH-USP) in providing all structure and support for this study. This study was supported by grants from the Coordination of Improvement of Higher Level Personnel (CAPES).
Disclosure
The authors report no conflicts of interest in this work.
References
1. Townsend S, Newsome PN. Non-alcoholic fatty liver disease in 2016. Br Med Bull. 2016;119(1):143. doi:10.1093/bmb/ldw031
2. Harrison DM, Harrison SA. Nonalcoholic steatohepatitis and noncirrhotic hepatocellular carcinoma: fertile soil.
3. Gaggini M, Morelli M, Buzzigoli E, DeFronzo R, Bugianesi E, Gastaldelli A. Non-alcoholic fatty liver disease (NAFLD) and its connection with insulin resistance, dyslipidemia, atherosclerosis and coronary heart disease. Nutrients. 2013;5(5):1544–1560. doi:10.3390/nu5051544
4. Lee JS, Kim SH, Jun DW, et al. Clinical implications of fatty pancreas: correlations between fatty pancreas and metabolic syndrome. World j Gastroenterol. 2009;15(15):1869. doi:10.3748/wjg.15.1869
5. Wang CY, Ou HY, Chen MF, Chang TC, Chang CJ. Enigmatic ectopic fat: prevalence of nonalcoholic fatty pancreas disease and its associated factors in a Chinese population. J Am Heart Assoc. 2014;3(1):e000297. doi:10.1161/JAHA.113.000297
6. Zhang X, Cui Y, Fang L, Li F. Chronic high-fat diets induce oxide injuries and fibrogenesis of pancreatic cells in rats. Pancreas. 2008;37(3):e31–e8. doi:10.1097/MPA.0b013e3181744b50
7. Hori M, Takahashi M, Hiraoka N, et al. Association of pancreatic fatty infiltration with pancreatic ductal adenocarcinoma. Clin Transl Gastroenterol. 2014;5(3):e53. doi:10.1038/ctg.2014.5
8. Ou H-Y, Wang C-Y, Yang Y-C, Chen M-F, Chang C-J. The association between nonalcoholic fatty pancreas disease and diabetes. PLoS One. 2013;8(5):e62561. doi:10.1371/journal.pone.0062561
9. Garthwaite T, Martinson D, Tseng L, Hagen T, Menahan L. A longitudinal hormonal profile of the genetically obese mouse. Endocrinology. 1980;107(3):671–676. doi:10.1210/endo-107-3-671
10. Mayer J, Andrus S, Silides DJ. Effect of diethyldithiocarbamate and other agents on mice with the obese-hyperglycemic syndrome. Endocrinology. 1953;53(5):572–581. doi:10.1210/endo-53-5-572
11. Frantz EDC, Prodel E, Braz ID, et al. Modulation of the renin–angiotensin system in white adipose tissue and skeletal muscle: focus on exercise training. Clin Sci. 2018;132(14):1487–1507. doi:10.1042/CS20180276
12. Lehnig AC, Stanford KI. Exercise-induced adaptations to white and brown adipose tissue. J Exp Biol. 2018;221(Suppl1):jeb161570. doi:10.1242/jeb.161570
13. Krause M, Rodrigues-Krause J, O’Hagan C, et al. The effects of aerobic exercise training at two different intensities in obesity and type 2 diabetes: implications for oxidative stress, low-grade inflammation and nitric oxide production. Eur J Appl Physiol. 2014;114(2):251–260. doi:10.1007/s00421-013-2769-6
14. Ferreira JC, Rolim NP, Bartholomeu JB, Gobatto CA, Kokubun E, Brum PC. Maximal lactate steady state in running mice: effect of exercise training. Clin Exp Pharmacol Physiol. 2007;34(8):760–765. doi:10.1111/j.1440-1681.2007.04635.x
15. Ashworth W. A Computational Model of Hepatic Energy Metabolism: Understanding the Role of Zonation in the Development and Treatment of Non-Alcoholic Fatty Liver Disease (NAFLD). UCL (University College London); 2017.
16. Bedossa P. Pathology of non‐alcoholic fatty liver disease. Liver Int. 2017;37:85–89. doi:10.1111/liv.13301
17. Liang W, Menke AL, Driessen A, et al. Establishment of a general NAFLD scoring system for rodent models and comparison to human liver pathology. PLoS One. 2014;9(12):e115922. doi:10.1371/journal.pone.0115922
18. Evangelista FS, Muller CR, Stefano JT, et al. Physical training improves body weight and energy balance but does not protect against hepatic steatosis in obese mice. Int J Clin Exp Med. 2015;8(7):10911.
19. Higa TS, Bergamo FC, Mazzucatto F, Fonseca-Alaniz MH, Evangelista F. Physical training prevents body weight gain but does not modify adipose tissue gene expression. Braz J Med Biol Res. 2012;45(10):988–994. doi:10.1590/S0100-879X2012007500097
20. Higa TS, Spinola AV, Fonseca-Alaniz MH, Evangelista F. Remodeling of white adipose tissue metabolism by physical training prevents insulin resistance. Life Sci. 2014;103(1):41–48. doi:10.1016/j.lfs.2014.02.039
21. Gollisch KS, Brandauer J, Jessen N, et al. Effects of exercise training on subcutaneous and visceral adipose tissue in normal-and high-fat diet-fed rats. Am J Physiol Endocrinol Metab. 2009;297(2):E495–E504. doi:10.1152/ajpendo.90424.2008
22. Blundell J, Gibbons C, Caudwell P, Finlayson G, Hopkins M. Appetite control and energy balance: impact of exercise. Obesity Rev. 2015;16:67–76. doi:10.1111/obr.12257
23. Bouassida A, Chamari K, Zaouali M, Feki Y, Zbidi A, Tabka Z. Review on leptin and adiponectin responses and adaptations to acute and chronic exercise. Br J Sports Med. 2010;44(9):620–630. doi:10.1136/bjsm.2008.046151
24. McGee SL, Hargreaves M. AMPK-mediated regulation of transcription in skeletal muscle. Clin Sci. 2010;118(8):507–518. doi:10.1042/CS20090533
25. Fu L, Liu X, Niu Y, Yuan H, Zhang N, Lavi E. Effects of high-fat diet and regular aerobic exercise on global gene expression in skeletal muscle of C57BL/6 mice. Metabolism. 2012;61(2):146–152. doi:10.1016/j.metabol.2011.06.017
26. Harrison SA, Fecht W, Brunt EM, Neuschwander‐Tetri BA. Orlistat for overweight subjects with nonalcoholic steatohepatitis: a randomized, prospective trial. Hepatology. 2009;49(1):80–86. doi:10.1002/hep.22575
27. Musso G, Gambino R, Cassader M, Pagano G. A meta‐analysis of randomized trials for the treatment of nonalcoholic fatty liver disease. Hepatology. 2010;52(1):79–104. doi:10.1002/hep.23623
28. Hashida R, Kawaguchi T, Bekki M, et al. Aerobic vs. resistance exercise in non-alcoholic fatty liver disease: A systematic review. J Hepatol. 2017;66(1):142–152. doi:10.1016/j.jhep.2016.08.023
29. Johnson NA, Sachinwalla T, Walton DW, et al. Aerobic exercise training reduces hepatic and visceral lipids in obese individuals without weight loss. Hepatology. 2009;50(4):1105–1112. doi:10.1002/hep.23129
30. Mathur A, Marine M, Lu D, et al. Nonalcoholic fatty pancreas disease. HPB. 2007;9(4):312–318. doi:10.1080/13651820701504157
31. Goodyear LJ, Kahn BB. Exercise, glucose transport, and insulin sensitivity. Annu Rev Med. 1998;49(1):235–261. doi:10.1146/annurev.med.49.1.235
32. Postic C, Burcelin R, Rencurel F, et al. Evidence for a transient inhibitory effect of insulin on GLUT2 expression in the liver: studies in vivo and in vitro. Biochem J. 1993;293(1):119–124. doi:10.1042/bj2930119
33. Kim J-W, Kim Y-K, Ahn Y-H. A mechanism of differential expression of GLUT2 in hepatocyte and pancreatic β-cell line. Exp Mol Med. 1998;30(1):15. doi:10.1038/emm.1998.2
34. Brichard S, Ongemba L, Henquin J-C. Oral vanadate decreases muscle insulin resistance in obese fa/fa rats. Diabetologia. 1992;35(6):522–527. doi:10.1007/BF00400479
35. Burcelin R, Eddouks M, Kande J, Assan R, Girard J. Evidence that GLUT-2 mRNA and protein concentrations are decreased by hyperinsulinaemia and increased by hyperglycaemia in liver of diabetic rats. Biochem J. 1992;288(2):675–679. doi:10.1042/bj2880675
36. Oka Y, Asano T, Shibasaki Y, et al. Increased liver glucose-transporter protein and mRNA in streptozocin-induced diabetic rats. Diabetes. 1990;39(4):441–446. doi:10.2337/diab.39.4.441
37. Yamamoto T, Fukumoto H, Koh G, et al. Liver and muscle-fat type glucose transporter gene expression in obese and diabetic rats. Biochem Biophys Res Commun. 1991;175(3):995–1002. doi:10.1016/0006-291X(91)91663-W
38. Silva AD. O Diabetes Altera a Expressão Do RNAm Do GLUT2 Em Fígado e Rim: Participação Dos Fatores Transcricionais Hepatic Nuclear Factor-(HNF-) 1a, 3b e 4a. Universidade de São Paulo; 2011.
39. Kurauti MA, Costa-Júnior JM, Ferreira SM, et al. Interleukin-6 increases the expression and activity of insulin-degrading enzyme. Sci Rep. 2017;7(1):46750. doi:10.1038/srep46750
40. Ellingsgaard H, Hojman P, Pedersen BK. Exercise and Health–emerging roles of IL-6. Curr Opin Physiol. 2019;10:49–54. doi:10.1016/j.cophys.2019.03.009
41. Morettini M, Palumbo MC, Sacchetti M, Castiglione F, Mazza C. A system model of the effects of exercise on plasma Interleukin-6 dynamics in healthy individuals: role of skeletal muscle and adipose tissue. PLoS One. 2017;12(7):e0181224. doi:10.1371/journal.pone.0181224
42. Febbraio MA, Hiscock N, Sacchetti M, Fischer CP, Pedersen BK. Interleukin-6 is a novel factor mediating glucose homeostasis during skeletal muscle contraction. Diabetes. 2004;53(7):1643–1648. doi:10.2337/diabetes.53.7.1643
43. Matthews VB, Allen T, Risis S, et al. Interleukin-6-deficient mice develop hepatic inflammation and systemic insulin resistance. Diabetologia. 2010;53(11):2431–2441. doi:10.1007/s00125-010-1865-y
44. Wallenius V, Wallenius K, Ahrén B, et al. Interleukin-6-deficient mice develop mature-onset obesity. Nat Med. 2002;8(1):75–79. doi:10.1038/nm0102-75
45. Wunderlich FT, Ströhle P, Könner AC, et al. Interleukin-6 signaling in liver-parenchymal cells suppresses hepatic inflammation and improves systemic insulin action. Cell Metab. 2010;12(3):237–249. doi:10.1016/j.cmet.2010.06.011
46. Awazawa M, Ueki K, Inabe K, et al. Adiponectin enhances insulin sensitivity by increasing hepatic IRS-2 expression via a macrophage-derived IL-6-dependent pathway. Cell Metab. 2011;13(4):401–412. doi:10.1016/j.cmet.2011.02.010
47. Schmidt-Arras D, Rose-John S. IL-6 pathway in the liver: from physiopathology to therapy. J Hepatol. 2016;64(6):1403–1415. doi:10.1016/j.jhep.2016.02.004
48. Zhou D, Liang Z, Qin Q, Zhang M, Li S. Therapeutic efficacy and mechanisms of quercetin in a rat model of nonalcoholic fatty liver disease. Zhonghua Gan Zang Bing Za Zhi Zhonghua Ganzangbing Zazhi. 2013;21(2):134–137. doi:10.3760/cma.j.issn.1007-3418.2013.02.014
49. Speretta GFF, Rosante MC, Duarte FO, et al. The effects of exercise modalities on adiposity in obese rats. Clinics. 2012;67(12):1469–1477. doi:10.6061/clinics/2012(12)19
 © 2020 The Author(s). This work is published and licensed by Dove Medical Press Limited. The
full terms of this license are available at https://www.dovepress.com/terms
and incorporate the Creative Commons Attribution
- Non Commercial (unported, 3.0) License.
By accessing the work you hereby accept the Terms. Non-commercial uses of the work are permitted
without any further permission from Dove Medical Press Limited, provided the work is properly
attributed. For permission for commercial use of this work, please see paragraphs 4.2 and 5 of our Terms.
© 2020 The Author(s). This work is published and licensed by Dove Medical Press Limited. The
full terms of this license are available at https://www.dovepress.com/terms
and incorporate the Creative Commons Attribution
- Non Commercial (unported, 3.0) License.
By accessing the work you hereby accept the Terms. Non-commercial uses of the work are permitted
without any further permission from Dove Medical Press Limited, provided the work is properly
attributed. For permission for commercial use of this work, please see paragraphs 4.2 and 5 of our Terms.