")
Back to Journals » Therapeutics and Clinical Risk Management » Volume 11
Effect of vitamin D therapy on interleukin-6, visfatin, and hyaluronic acid levels in chronic hepatitis C Egyptian patients
Authors Sabry D, Al-Ghussein M , Hamdy G, Abul-Fotouh A, Motawi T, El Kazaz A, Eldemery A, Shaker M
Received 24 April 2014
Accepted for publication 22 September 2014
Published 19 February 2015 Volume 2015:11 Pages 279—288
DOI https://doi.org/10.2147/TCRM.S66763
Checked for plagiarism Yes
Review by Single anonymous peer review
Peer reviewer comments 3
Editor who approved publication: Professor Garry Walsh
Dina Sabry,1 Mohamed AS Al-Ghussein,2 Gehan Hamdy,3 Amr Abul-Fotouh,4 Tarek Motawi,5 Amany Y El Kazaz,6 Ahmed Eldemery,7 Marwa Shaker8,9
1Medical Biochemistry and Molecular Biology Department, Faculty of Medicine, Cairo University, Giza, Egypt; 2Biochemistry Department, Faculty of Pharmacy, Al-Azhar University, Gaza, State of Palestine, 3Internal Medicine Department, 4Tropical Medicine Department, Faculty of Medicine, 5Biochemistry Department, Faculty of Pharmacy, Cairo University, Giza, Egypt; 6Medical Biochemistry Department, Faculty of Medicine, Suez Canal University, Ismaileya, Egypt; 7Medical Biochemistry Department, Faculty of Medicine, October 6 University, Giza, Egypt; 8Tropical Medicine Department, Faculty of Medicine, Cairo University, Giza, Egypt; 9Tropical Medicine Department, Bny Swif University, Bny Swif, Egypt
Objectives: We aimed to compare serum levels of interleukin-6, visfatin, and hyaluronic acid in chronic hepatitis C Egyptian patients who received standard of care (SOC) therapy for chronic hepatitis C virus (HCV) consisting of pegylated interferon (PEG-IFN) and ribavirin (RBV) and in those who received SOC with vitamin D (vit D) for 48 weeks in HCV genotype 4a subjects.
Design and methods: One hundred chronic HCV patients were classified into two groups: study 50 patients received SOC therapy PEG-IFN/RBV + vit D and control 50 patients received SOC PEG-IFN/RBV without vit D. Both groups were followed up at 12 weeks, 24 weeks, and 48 weeks of treatment.
Results: Results showed a significant elevation in vit D levels in the group treated with SOC and vit D compared to SOC group and a reduction in HCV RNA from the 12th week to reach zero level in the 24th week. Interleukin-6, visfatin, and hyaluronic acid levels were also reduced significantly. Alanine transaminase and aspartate transaminase biomarkers were significantly reduced, indicating decreased liver injury.
Conclusion: SOC PEG-IFN/RBV + vit D therapy for chronic HCV led to reduced interleukin-6, visfatin, and hyaluronic acid levels and follow up liver biochemical biomarkers as aspartate transaminase and alanine transaminase indicates proper liver healing and monitoring.
Keywords: hepatitis C virus, HCV 4a RNA, pegylated interferon, ribavirin, AST, ALT
Introduction
Chronic hepatitis C virus (CHC) is a serious health problem and infects approximately 170 million individuals worldwide and is a major cause of mortality and morbidity.1
Egypt almost has the highest hepatitis C virus (HCV) prevalence in the world (overall prevalence of HCV is 12% among the general population, reaches about 40% in persons above 40 years of age, and is more in rural areas).2
Current treatment of HCV infection is pegylated interferon (PEG-IFN) and ribavirin (RBV) for 24 weeks for HCV genotypes 2 or 3 or for 48 weeks for HCV genotype 1. The main objective of HCV therapy is a sustained virologic response (SVR). SVR is defined as an undetectable serum HCV RNA level at 24 weeks after the end of therapy. Rates of SVR range from 60% to 70% in CHC patients with genotypes 2 and 3 but is less than 50% in patients with genotype 1 using conventional therapy.3
HCV genotype 4 is the most prevalent in Egypt. Several antiviral acting drugs have been formulated, but till now no interferon-free regimen has proved as effective as interferon-incorporating regimens. None of interferon-incorporating regimens has been yet effective in treatment of genotype 4 HCV.4
1,25-dihydroxyvitamin D, the activated hormonal form of vitamin D (vit D), is an important immune modulator that has an impact on innate and adaptive immune pathways.5
The relationship between vit D and liver disease is reciprocal. Therefore, liver diseases including CHC may be responsible for low serum levels of 25-hydroxyvitamin D (25(OH)D). Consequently vit D deficiency was associated with poor response to PEG-INF α and RBV in HCV genotype 1.6
Visfatin is a new adipokine involved in several processes. Visfatin is not only an adipocyte-specific protein but also plays an important role in inflammatory processes. It has been demonstrated that recombinant visfatin induced dose-dependent production of pro-inflammatory interleukin-1β (IL-1β), tumor necrosis factor-α, and IL-6 as well as anti-inflammatory cytokines such as IL-10 and IL-1 receptor antagonist in human monocytes.7
In vivo intraperitoneal injections of recombinant murine visfatin significantly increased circulating IL-6 levels and IL-6 messenger RNA expression in the small intestine in mice.8
The data concerning visfatin in CHC are small. A recent study showed that serum visfatin concentration increases significantly in CHC patients. These findings suggest that visfatin is important in the pathogenesis of the inflammatory process in CHC. The measurement of visfatin serum concentration was correlated significantly with fibrosis scores (r=0.23, P=0.02) in CHC patients.9
CHC is a slowly progressing inflammatory disease of the liver that can lead to cirrhosis and its complications. Assessment of liver damage in hepatitis C has been primarily via histological evaluation. Liver biopsy, while useful in determining the extent of liver damage, has associated costs and places patients at a small but finite risk of bleeding. Studies have identified serum markers shown to correlate with liver histology, including procollagen III peptide and hyaluronic acid (HA).10 Serum HA measurement is clinically useful to noninvasively assess the degree of fibrosis and cirrhosis. Results of international studies suggest that the (HA) serum level is a useful marker in determining the severity of fibrosis in patients with chronic viral hepatitis.11
We aim to compare the prevalence of vit D deficiency between standard of care (SOC) therapy group (received PEG-INF and RBV) and SOC plus vit D group. The effect of vit D supplementation on serum levels of IL-6, visfatin, and HA was also evaluated.
Patients and methods
One hundred chronic HCV patients were recruited from the outpatient clinic at Tropical Medicine Department, Bny Swif University, from April 2013 to October 2013, with follow-up period of 48 weeks, according to the following inclusion and exclusion criteria:
Inclusion criteria
- Adult Egyptian male and female patients
- Chronic HCV infection for >6 months and detectable serum quantitative HCV RNA
- HCV genotype 4 patients
- Serum alanine transaminase (ALT) above the laboratory-defined upper limit of normal
- Compensated liver disease with the following minimum hematologic and biochemical criteria:
- Hemoglobin (Hb) >12 g/dL
- White blood cells >3,000/mm3; granulocyte count >1,500/mm3
- Platelet count >75,000/mm3
- Albumin within normal limits
- Thyroid function test within normal limits
- Antinuclear antibody 1:320
- Ultrasound of the liver obtained within the preceding 3 months of study entry.
- Liver biopsy within 3 months prior to study entry confirming a histological diagnosis consistent with HCV necroinflammatory score (metavir) 1 and fibrosis score 1.
Exclusion criteria
- Infection with HCV genotype other than genotype 4
- Co-infection with hepatitis B virus or HIV or schistosomiasis
- Decompensated liver disease (Child-Pugh classification B or C) including a history of decompensation
- Variceal bleeding, ascites, or portosystemic encephalopathy
- Other causes of liver diseases such as autoimmune or metabolic liver disease
- Renal or parathyroid disease
- Hepatocellular carcinoma
- History of anti-HCV therapy
- Receiving drugs affecting the level of vit D.
Study design (sample size)
All patients were enrolled after screening, meeting study criteria, and signing the informed consent, and the sample size had to show that the response rate for the 48-week treatment in the triple-therapy arm (PEG-INF plus RBV combination with vit D) was greater than the response rate for control (48-week treatment in the PEG-INF plus RBV combination). The sample size in the two groups was 50 each, and alfa (one-tailed) was set at 0.05. The sample size also took into account a 5% drop-out rate from either arm.
The study population is illustrated in Figure 1. It consisted of two arms (SOC therapy and SOC therapy with vit D) of 50 patients each with treatment-naïve CHC (total =100 participants). Group 1 (patients study group): PEG-INF α2a (F. Hoffmann-LaRoche, Basel, Switzerland) – standard dose 180 μg weekly; plus RBV (Copegus®; F. Hoffmann-LaRoche) dose determined by patient weight (<75 kg =1,000 mg/day; ≥75 kg =1,200 mg/day) for 48 weeks; plus vitamin D3 – 15,000 IU/week for the treatment of chronic HCV (50 patients). Group 2 (control group): PEG-INF α2a (F. Hoffmann-LaRoche) – standard dose 180 μg weekly; plus RBV (Copegus®; F. Hoffmann-LaRoche) dose determined by patient weight (<75 kg =1000 mg/day; ≥75 kg =1,200 mg/day) for 48 weeks for the treatment of chronic HCV (50 patients). End of treatment response was defined as undetectable HCV RNA in the blood at the end of treatment.12
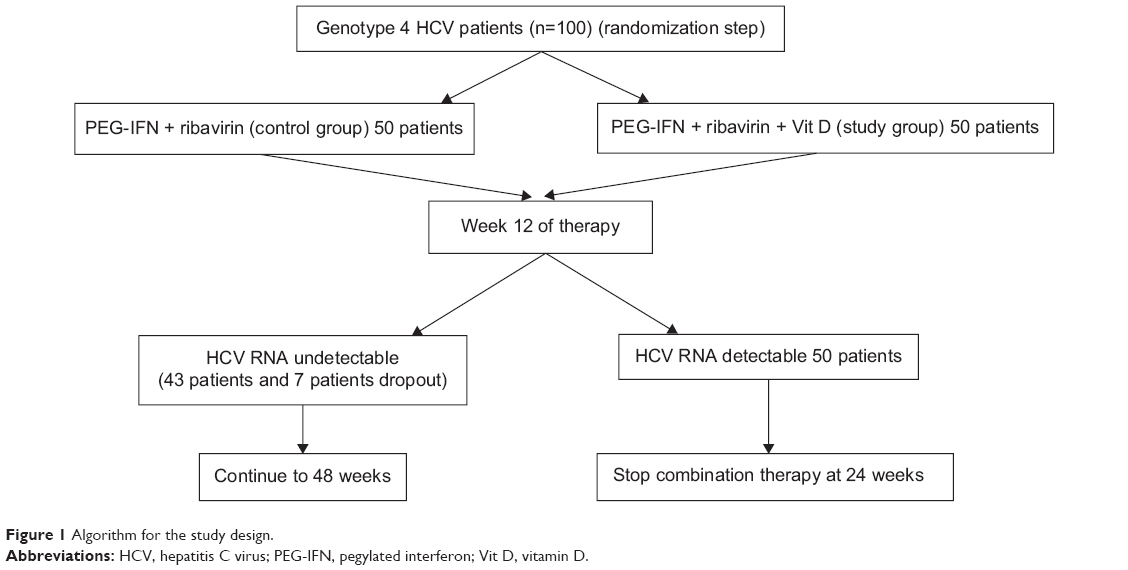 | Figure 1 Algorithm for the study design. |
Blood samples collection
A five-milliliter blood sample was obtained from each patient at 0 weeks, 12 weeks, 24 weeks, and 48 weeks after enrollment in the study and was divided into two parts. The first part was collected into ethylenediaminetetraacetic acid tubes to assess aspartate transaminase (AST), ALT, total bilirubin (T. Bil), direct bilirubin (D. Bil), albumin, alkaline phosphatase (ALKP), creatinine, random blood sugar (RBS), hemoglobin A 1c (HbA1c), prothrombin concentration (PC), international normalized ratio (INR), Hb, total leukocytes count (TLC), absolute neutrophil counts (ANC), platelets, thyroid-stimulating hormone (TSH), and alfa-fetoprotein (AFP). The second part was collected into another tube to assess vit D serum, IL-6, visfatin, and HA levels and to extract HCV RNA for HCV quantitative polymerase chain reaction (PCR) detection.
Vit D level assessment
Vit D serum level was detected using (DRG International Inc., Springfield, New Jersey, USA) enzyme-linked immunosorbent assay (ELISA) kit. Vit D status was indicated by the 25(OH)D serum levels. Vit D insufficiency is defined as a 25(OH)D concentration of 20–30 ng/mL, while vit D deficiency is defined as a 25(OH)D concentration less than 20 ng/mL.
IL-6, visfatin, and HA levels assessment
Visfatin serum level was assessed using ELISA kit provided by DRG International Inc. IL-6 serum level was detected using ELISA kit provided by Invitrogen Corporation (Camarillo, CA, USA). HA serum level was detected using ELISA kit provided by Corgenix (Broomfield, CO, USA).
All protocols followed the manufacturers’ instructions. Each ELISA test was run in duplicate, with mean absorbance computed from the average for two wells normalized to a zero-calibrator well.
Patients’ laboratory parameter levels assessment
AST, ALT, T. Bil, D. Bil, albumin, ALKP, RBS, and creatinine were detected using kits provided by Randox Laboratories Limited (Country Antrim, UK). TSH and AFP were detected using kits provided by DRG International Inc. HbA1c and PC were detected using kits provided by Stanbio Laboratory (Boerne, TX, USA). Hb, TLC, ANC, and platelets were detected by cell counter (Sysmex XT-4000i Automated Hematology Analyzer; Sysmex, Lincolnshire, IL, USA). Hepatic fibrosis metavir score was used to evaluate liver inflammation A (0–3), fibrosis F (0–4), and size S (0–4).
HCV RNA extraction and quantitative PCR detection
HCV RNA was extracted from 140 μL of serum using the QIAamp Viral RNA Mini Kit (QIAgen, Hilden, Germany). Absolute quantitation of the concentration of HCV RNA was based on an external standard curve (HCV Standards IU/mL) in the presence of an internal positive control. Internal positive control was added to a mixture of lysis buffer and sample material during RNA extraction of clinical blood samples. TaqMan assay was used by the AgPath-ID™ One-Step real time (RT)-PCR kit (Applied Biosystems, Foster City, CA, USA). One-step RT-PCR kit includes an enzyme mixture, buffer, and detection enhancer for one-step quantitative reverse transcription PCR. Amplification was performed in a 25-μL reaction mixture containing 2× TaqMan Universal RT-PCR Master Mix, 20 μM of each primer and probe for both sample and inductively coupled plasma, and 8.5 μL of extracted RNA. All samples were performed in duplicate. RT-PCR mix was incubated at 50°C for 2 minutes for uracil N’-glycosylase inactivate possible contaminating amplicons, 45°C for 10 minutes for complementary DNA synthesis by reverse transcriptase, and followed by 10 minutes at 95°C that activates AmpliTaq Gold Polymerase and inactivates uracil N’-glycosylase. PCR cycling program consisted of 45 cycles of 15 seconds at 95°C and 45 seconds at 60°C (universal conditions).
Statistical analysis
Results were disclosed as means ± standard deviations. One-way analysis of variance and Tukey’s multiple comparison post hoc tests were performed. P<0.05 was considered significant.
The study protocol was performed in accordance with the ethical guidelines of the 1975 Declaration of Helsinki. Approval was obtained from the hospital’s Institutional Review Board and Ethics Committee, and written informed consent was obtained from all included patients.
Results
Baseline demographic and clinical characteristics
Demographics, ethnicity, and degree of liver disease were similar in the patients treated with vit D along with PEG-INF and RBV (study group) and in the control group, who received PEG-INF and RBV (Table 1).
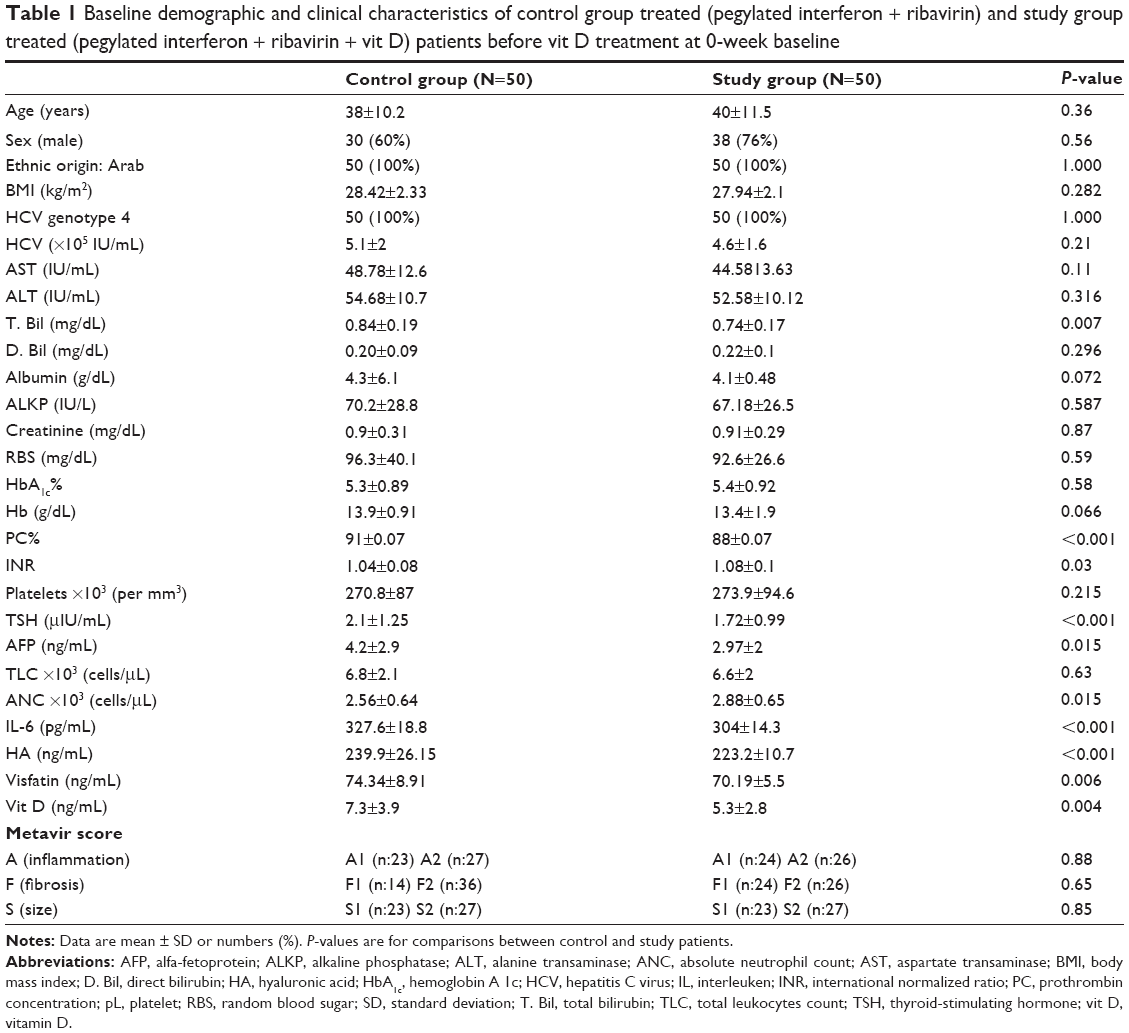 | Table 1 Baseline demographic and clinical characteristics of control group treated (pegylated interferon + ribavirin) and study group treated (pegylated interferon + ribavirin + vit D) patients before vit D treatment at 0-week baseline |
Treatment analysis was conducted for both study and control group patients who had a subsequent efficacy observation during 48 weeks (50 patients in each group). Control group patients’ results after 48 weeks did not show any significant changes in parameters compared to 0-week baseline. Accordingly, we decided to compare the study group at different scheduled weeks versus the baseline control group.
As outlined in Table 1, all patients were middle-aged Egyptians, predominantly males who had HCV genotype 4 with mild or moderate inflammation (A1 and A2, respectively), mild or moderate fibrosis (F1 and F2, respectively) by liver biopsy, and normal or enlarged liver size (S1 and S2, respectively) by abdominal ultrasonography for both groups. All subjects were overweight, while nine control and five study subjects were obese (body mass index, BMI 28.42 kg/m2 for control and 27.94 kg/m2 for study groups). Both groups had normal T. Bil, D. Bil, albumin, creatinine, ALKP, RBS, HbA1c%, Hb, PC%, INR, platelets, and AFP. Mild increases were observed in both AST (control 48.78 IU/mL vs study 44.85 IU/mL; P=0.11) and ALT (control 54.68 IU/mL vs study 52.58 IU/mL; P=0.32) (Table 1). Baseline vit D level was deficient in both groups (control 7.3±3.9 ng/mL vs study 5.3±2.8 ng/mL; P=0.004), which is common in all HCV patients. TLC and ANC were elevated with high serum IL-6 level (control 327.6 ng/mL vs study 304 ng/mL; P=0.001), high serum visfatin level (control 74.34 ng/mL vs study 70.19 ng/mL; P=0.006), and high serum HA level (control 239.9 ng/mL vs study 223.2 ng/mL; P=0.001) (Table 1).
Vit D levels assessment
Vit D serum level was elevated after 48 weeks of treatment from pretreatment moderate deficiency to reach above the normal sufficient value after treatment. Serum vit D level was significantly doubled at 12th week (14.47±6.16 ng/mL; P≤0.001 comparing both control and study groups) (Figure 2A). Serum vit D level was significantly high at 24th week (17.95±9.89 ng/mL; P≤0.001 comparing both control and study groups) (Figure 2A). A significant elevation was detected when comparing 12th week with 24th week (P=0.037). After the 48th-week of vit D treatment, high significant elevation was detected in serum vit D level (66.89±17.36 ng/mL; P≤0.001 comparing both the control and study groups) (Figure 2A).
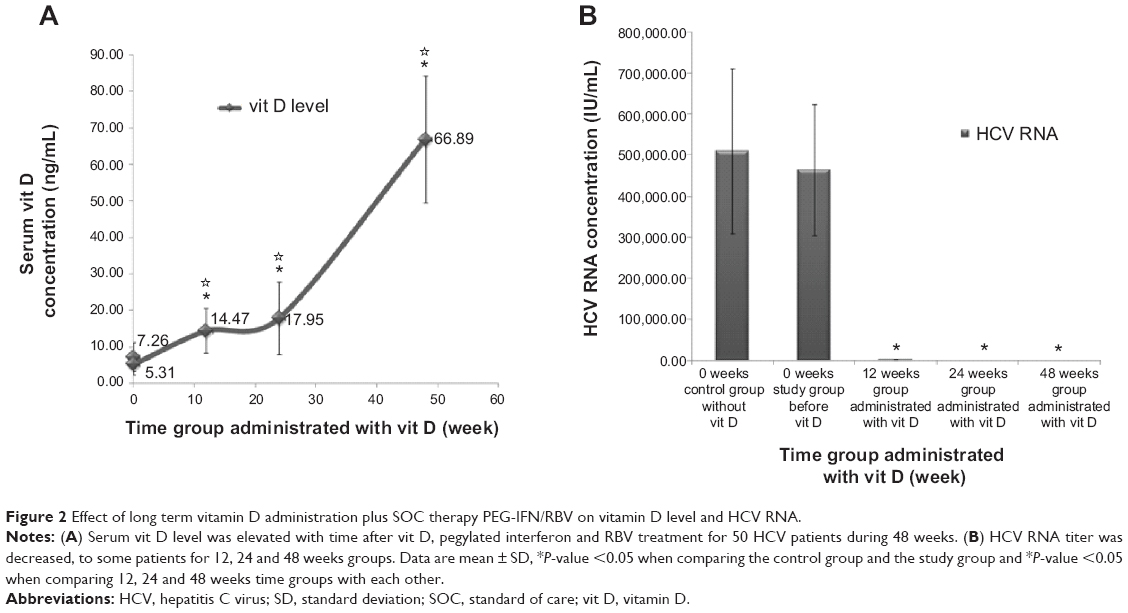 | Figure 2 Effect of long term vitamin D administration plus SOC therapy PEG-IFN/RBV on vitamin D level and HCV RNA. |
Serum HCV RNA titers
Vit D decreased serum HCV RNA titers in HCV genotype 4 naïve patients. There was a highly statistically significant difference in HCV RNA titers from baseline in the study group treated with vit D. At 12 weeks, results were 0.02±0.005 IU/mL (P≤0.001) and reached zero level at 24 and 48 weeks (P≤0.001) when comparing the control and study groups (Figure 2B). Accordingly, there was evidence indicating that vit D was effective in decreasing HCV RNA titer in those patients.
IL-6, visfatin, and HA serum assessment
Vit D decreased serum IL-6 level and visfatin and HA levels with time. High significant difference was found when comparing the IL-6 values at baseline between the control and study groups and at 12 weeks (120.38±13.74 pg/mL; P≤0.001), 24 weeks (28.56±6.92 pg/mL; P≤0.001), and 48 weeks (8.07±1.18; P≤0.001) (Figure 3A). Visfatin levels also showed a high significant difference when comparing baseline control and study groups and at 12 weeks (33.99±2.66 pg/mL; P≤0.001), 24 weeks (21.52±2.76 pg/mL; P≤0.001), and 48 weeks (14.06±2.49 pg/mL; P≤0.001) (Figure 3B). HA values were decreased with high significance when comparing baseline control and study groups and at 12 weeks (114.01±19.27 pg/mL; P≤0.001), 24 weeks (67.94±13.05 pg/mL; P≤0.001), and 48 weeks (32.89±3.13 pg/mL; P≤0.001) (Figure 3C).
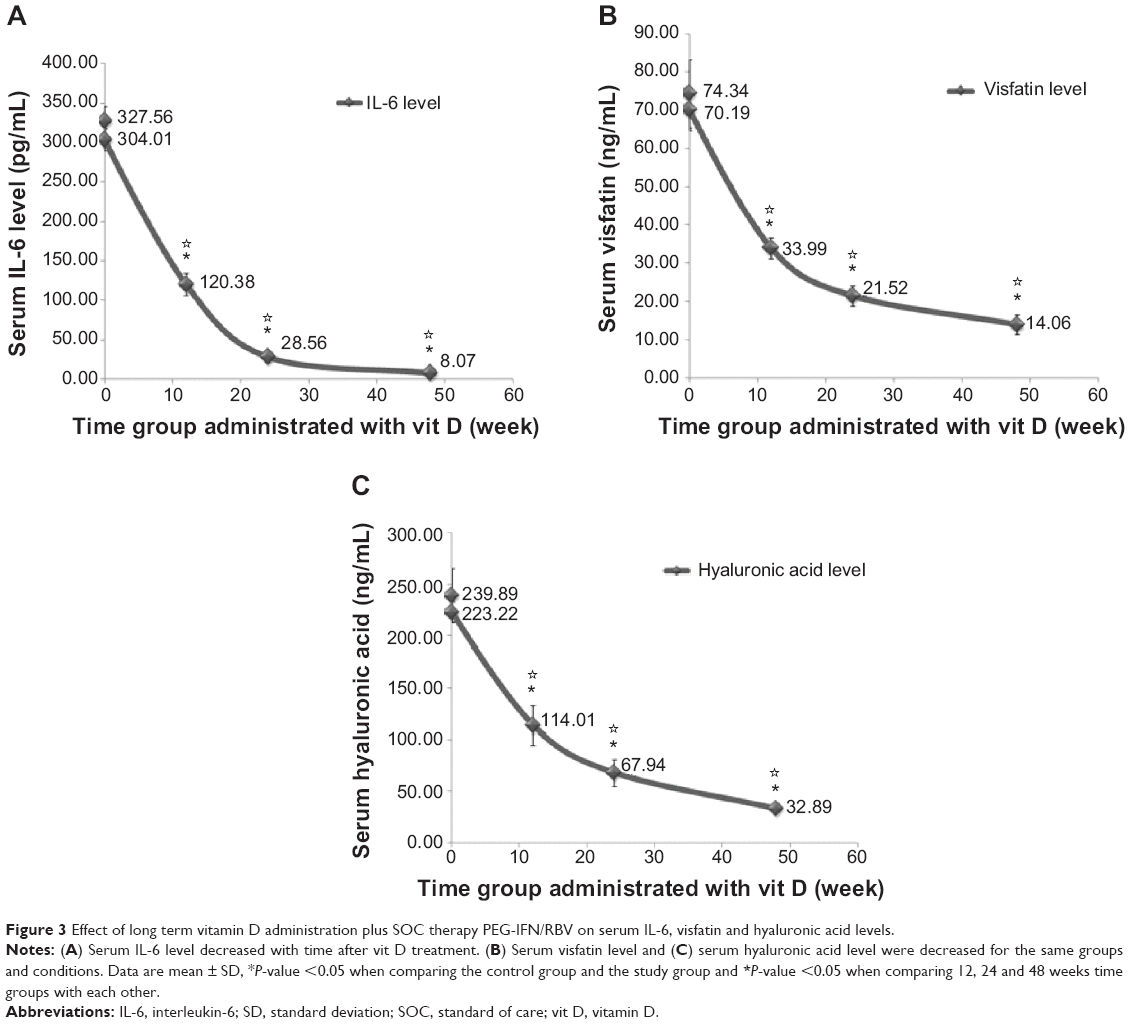 | Figure 3 Effect of long term vitamin D administration plus SOC therapy PEG-IFN/RBV on serum IL-6, visfatin and hyaluronic acid levels. |
Other serum biomarkers assessment
Elevated serum AST and ALT values are surrogate indicators of liver injury used in patient care and clinical research. Vit D decreased serum AST and ALT levels with time. When comparing AST values to baseline control and 0-week study groups, significant difference was found at 24 weeks (41.35±13.22 IU/mL; P≤0.005 vs control group and P=0.161 vs study group) (Figure 4A). High significance was noticed when comparing 0 week with 48 weeks for both AST (36.42±10.55 IU/mL; P≤0.001 vs control and study groups) and ALT (39.26±15.93 IU/mL; P≤0.001 vs control and study groups). Between-group significant difference was clarified with P≤0.05 when comparing 12 weeks and 24 weeks against 48 weeks for AST and ALT (Figure 4A). Despite the significant reduction (P≤0.001) against control and study groups shown in Figure 4B–D for Hb, TLC, ANC, and platelets, their levels remained within normal ranges.
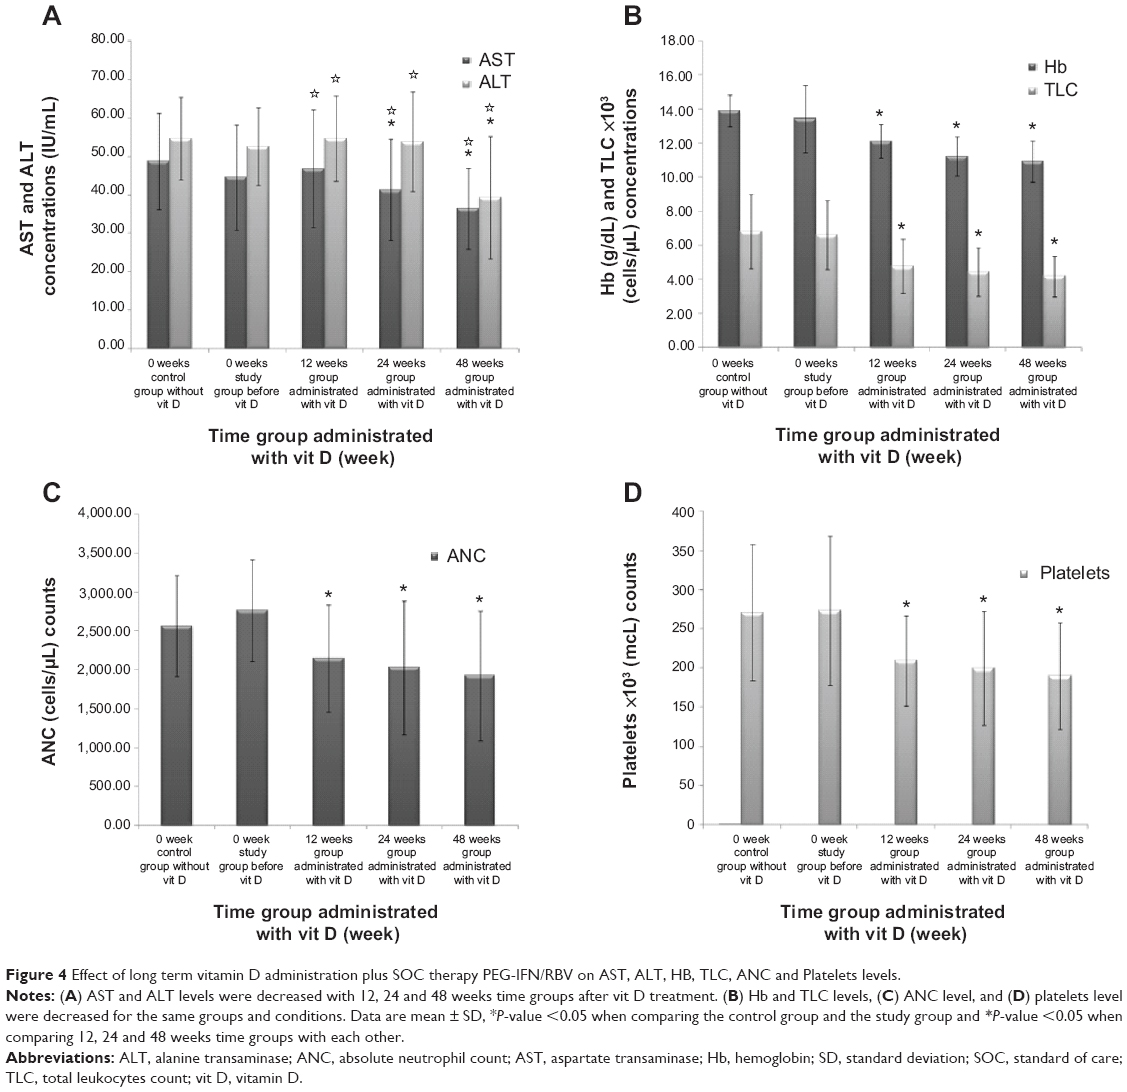 | Figure 4 Effect of long term vitamin D administration plus SOC therapy PEG-IFN/RBV on AST, ALT, HB, TLC, ANC and Platelets levels. |
Figure 5A and B did not show any significant difference for study group at different scheduled weeks in parameters of TSH, creatinine, albumin, INR, HbA1c, AFP, T. Bil, D. Bil, ALKP, RBS, and PC, but results were nearly constant and equal to baseline normal levels.
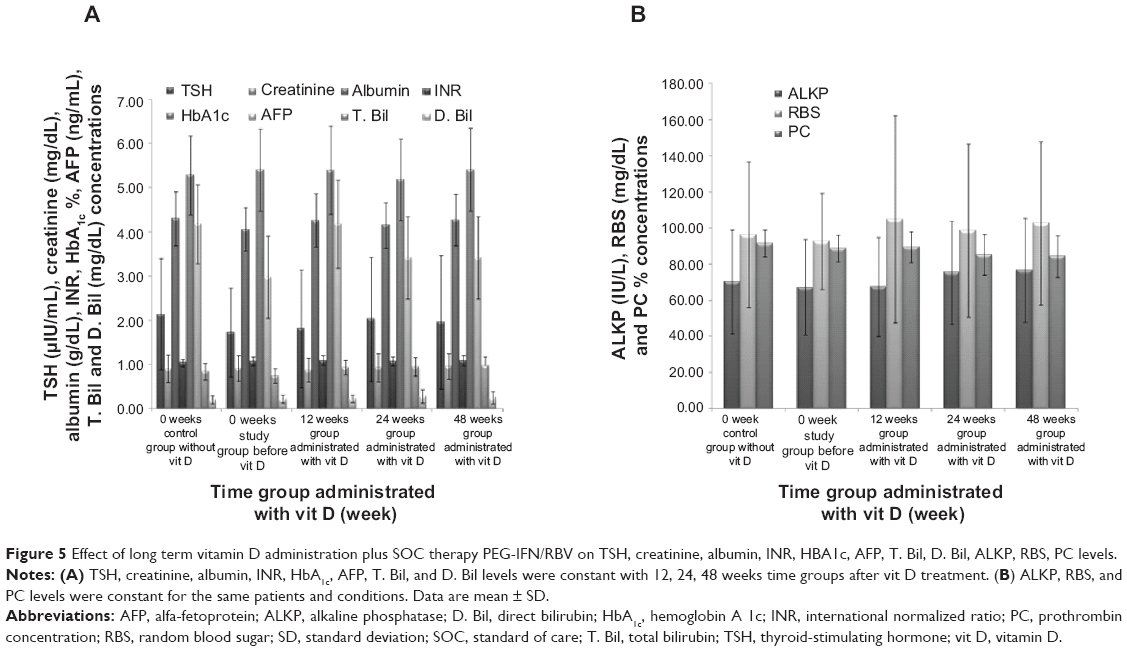 | Figure 5 Effect of long term vitamin D administration plus SOC therapy PEG-IFN/RBV on TSH, creatinine, albumin, INR, HBA1c, AFP, T. Bil, D. Bil, ALKP, RBS, PC levels. |
Discussion
This study showed that the response rate for the 48-week treatment in the triple-therapy arm (PEG-INF plus RBV combination with vit D) is greater than the response rate for active control (48-week treatment with PEG-INF plus RBV combination). The sample size also takes into account a 5% dropout rate from either arm.
We aimed to assess the efficacy of vit D treatment combined with PEG-INF/RBV treatment for 48 weeks on insufficient baseline vit D, serum HCV genotype 4 RNA titers, IL-6, visfatin, HA, and vital body parameters levels assessment.
Vit D is metabolized by the liver and converted to 1,25-dihydroxyvitamin D3, which is the active form of the vitamin.13 Individuals with HCV may have poor conversion from vitamin D3 or any of its other biologically active metabolites that may increase the risk of vit D deficiency.14 Because of the above serum baseline levels of vit D (Table 1, Figure 2A), it is classified as a deficiency.15 We assessed the vit D status after the 48-week vit D treatment as a consequence of the HCV infection. Serum vit D levels were significantly doubled at 12 weeks, tripled at 24 weeks, and increased ten times after 48 weeks (Figure 2A). Even though some studies have been conducted to evaluate vit D supplementation in HCV patients due to the observation of its deficiency,16–18 they were performed for short time periods with small patient samples and only with genotypes 1, 2, and 3 but not 4. A study analyzed a cohort of 167 G1 CHC patients treated with PEG-INF and RBV for hepatitis C and detected an association between lower vit D serum levels and failure to achieve SVR. Moreover, low vit D is linked to severe hepatic fibrosis.6 This study by Petta et al started focusing on vit D role in hepatic fibrosis and response to antiviral therapy in CHC, but they did not study the effect of vit D supplementation on these parameters. Another following study showed that vit D supplementation (cholecalciferol 800 IU/day) improves the probability to achieve sustained virological response to antiviral treatment for recurrent hepatitis C in liver transplant recipients.16 The addition of vit D to PEF-INF α2b and RBV in naïve patients infected with HCV genotype 2 and 3 significantly increased the rate of viral response. Nimer et al suggested routine testing of vit D levels prior to combination therapy and replacement during treatment for CHC.17
This study documented highly significant decreases in serum HCV RNA titers after 12 weeks, an important predictive timeline for response in HCV treatments with vit D,19 that reached zero at the 24-week treatment in overweight patients with treatment-naïve, chronic HCV genotype 4 infections (Figure 2B). The comparable mean decrease in HCV RNA for the 12-week and for the 24-week treatment indicates a continuing effect during the treatment period. Vit D could have, as a co-adjuvant, a valuable therapeutic effect for HCV genotype 4–infected patients.
It has been suggested that serum IL-6,20 visfatin,9,21 and HA10,11,22 values were elevated in HCV. As shown in Table 1, both groups had elevated baseline serum IL-6 and HA, although they were significantly lower in the patient group compared to the control group (control 327.6 vs study 304 ng/mL; P=0.001) and (control 239.9 vs study 223.2 ng/mL; P=0.001), respectively. From our point of view, this difference may have no effect on our results as the suppressed inflammatory process by antiviral treatment could jump over this gap.
This study showed a high significant reduction in serum IL-6, visfatin, and HA levels with time in the patient group by the effect of vit D therapy. Serum IL-6, visfatin, and HA values reached one-third for IL-6 and half for visfatin and HA compared to baseline at 12 weeks (Figure 3). Results were gradually dropped during 24 weeks and 48 weeks to reach normal levels. Reduction in these values indicated amelioration of liver inflammation.
Vitamin D3 has a direct effect on IL-6 by inhibiting its synthesis induced by prostaglandin F2α or prostaglandin E123 and HA synthesis inhibition.24 Correlations between vit D and the ALT and AST levels in HCV patients were weak and divergent after a short administration period.25 Significant reductions in serum AST and ALT levels were observed at 24 weeks and 48 weeks to reach normal values due to a decline in liver injury by the effect of vit D (Figure 4A). Although Figure 4B–D shows a significant reduction for Hb, TLC, ANC, and platelets, normal values remained without any marked changes. The reduction of TLC and ANC were confirmed with the previous results by decreasing liver infection and inflammation after vit D supplementation. Vit D therapy did not have any significant correlation with RBC count or indices or with total white blood cell count or lymphocyte/neutrophil ratio after short periods.26
TSH, creatinine, albumin, INR, HbA1c, AFP, T. Bil, D. Bil, ALKP, RBS, and PC values were stabilized constantly at near-normal levels and without any deterioration before and after vit D supplementation (Figure 5A and B).
Accordingly, the addition of vit D to PEG-INF α2b and RBV in naïve patients infected with HCV genotype 4 significantly increased the rate of viral response. We suggest routine testing of vit D levels prior to combination therapy and replacement during treatment for CHC.
Conclusion
There was an amelioration of liver infection and inflammation for HCV genotype 4a patients treated with SOC and vit D. IL-6, visfatin, and HA levels were significantly reduced as an indicator of decreasing inflammation. Long-term vit D therapy should be administered hand in hand with SOC therapy for HCV patients to gain the optimal benefits of treatment, as vit D sufficiency may help in decreasing hepatic inflammation. Future research is warranted with long-term follow-up and studying the effect of higher dose of vit D on hepatic inflammation markers.
Acknowledgments
The authors thank all the staff members at the Medical Biochemistry and Molecular Biology Unit at the Faculty of Medicine, Cairo University.
Author contributions
DS carried out RNA extraction and real-time PCR as regards molecular biology assessment and also participated in manuscript writing and submission. MG performed biotechnology procedures; measured vit D, IL-6, visfatin, and HA; and carried out manuscript writing and submission as a corresponding author. AA and GH collected patients’ samples, did clinical registration, and participated in the design of the study and revising and editing it critically for important intellectual content. MS participated in the design of the study, revised and edited the manuscript critically for important intellectual content, and collected patients’ samples. TM, AYK, and AE carried out kits brought, preparations, molecular study work and took part in drafting and revising the manuscript. All authors had access to the study data and reviewed and approved the final manuscript.
Financial support
This study did not receive any grants or financial support.
Disclosure
The authors report no conflicts of interest in this work.
References
World Health Organization. Hepatitis C. Fact sheet number 164. 2014. Available from: http://www.who.int/mediacentre/factsheets/fs164/en. Accessed April 5, 2014. | ||
Khattab MA. Targeting host factors: a novel rationale for the management of hepatitis C virus. World J Gastroenterol. 2009;15(28):3472–3479. | ||
Pawlotsky JM. Therapy of hepatitis C: from empiricism to eradication. Hepatology. 2006;43:S207–S220. | ||
Lawitz E, Mangia A, Wyles D, et al. Sofosbuvir for previously untreated chronic hepatitis C infection. N Engl J Med. 2013;16:1878–1887. | ||
Von Essen MR, Kongsbak M, Schjerling P, Olgaard K, Odum N, Geisler C. Vitamin D controls T cell antigen receptor signaling and activation of human T cells. Nat Immunol. 2010;11:344–349. | ||
Petta S, Camma C, Scazzone C, et al. Low vitamin D serum level is related to severe fibrosis and low responsiveness to interferon-based therapy in genotype 1 chronic hepatitis C. Hepatology. 2010;51(4):1158–1167. | ||
AL-Suhaimi EA, Shehzad A. Leptin, resistin and visfatin: the missing link between endocrine metabolic disorders and immunity. Eur J Med Res. 2013;18(12):1–13. | ||
Moschen AR, Kaser A, Enrich B, et al. Visfatin, an adipocytokine with proinflammatory and immunomodulating properties. J Immunol. 2007;178:1748–1758. | ||
Huang JF, Huang CF, Yu ML, et al. Serum visfatin is correlated with disease severity and metabolic syndrome in chronic hepatitis C infection. J Gastroenterol Hepatol. 2011;26(3):530–535. | ||
Yilmaz S, Bayan K, Tüzün Y, et al. Replacement of histological findings: serum hyaluronic acid for fibrosis, high-sensitive C-reactive protein for necroinflammation in chronic viral hepatitis. Int J Clin Pract. 2007;61(3):438–443. | ||
Moghaddam FM, Arrbabi H, Khajedaloei M. Determination of the relationship of serum hyaluronic acid levels to the degree of liver fibrosis in biopsies of patients with chronic viral hepatitis B and C. Hepat Mon. 2010;10(3):168–172. | ||
Ghany MG, Strader DB, Thomas DL, Seeff LB. Diagnosis, management and treatment of hepatitis C: an update. Hepatology. 2009;49(4):1335–1374. | ||
Reiberg T, Payer BA, Obermayer-Pietsch B, Rieger A, Peck-Radosavljevic M. 25-OH-vitamin D levels are associated with early viral kinetics and sustained virologic response in patients with HCV-HIV coinfection. Hepatology. 2011;54:1191–1192. | ||
Arteh J, Narra S, Nair S. Prevalence of vitamin D deficiency in chronic liver disease. Dig Dis Sci. 2010;55:2624–2628. | ||
Hollis BW. Circulating 25-hydroxyvitamin D levels indicative of vitamin D sufficiency: implications for establishing a new effective dietary intake recommendation for vitamin D. J Nutr. 2005;135:317–322. | ||
Bitetto D, Fabris C, Fornasiere E, et al. Vitamin D supplementation improves response to antiviral treatment for recurrent hepatitis C. Transpl Int. 2011;24(1):43–50. | ||
Nimer A, Mouch A. Vitamin D improves viral response in hepatitis C genotype 2–3 naïve patients. World J Gastroenterol. 2012;18:800–805. | ||
Abu-Mouch S, Fireman Z, Jarchovsky J, Zeina AR, Assy N. Vitamin D supplementation improves sustained virologic response in chronic hepatitis C (genotype 1)-naïve patients. World J Gastroenterol. 2011;17:5184–5190. | ||
Zeuzem S. Interferon-based therapy for chronic hepatitis C: current and future perspectives. Nat Clin Prac Gastroenterol Hepatol. 2008;5:610–622. | ||
Salter ML, Lau B, Mehta SH, Go VF, Leng S, Kirk GD. Correlates of elevated interleukin-6 and C-reactive protein in persons with or at high risk for HCV and HIV infections. J Acquir Immune Defic Syndr. 2013;64(5):488–495. | ||
Hano AEl-F, Deghady A, Shaaban S, Rahman MAEl. Serum visfatin in patients with chronic hepatitis C. J Am Sci. 2011;7(2):94–101. | ||
McHutchison JG, Blatt LM, De Medina M, et al. Measurement of serum hyaluronic acid in patients with chronic hepatitis C and its relationship to liver histology. J Gastroenterol Hepatol. 2000;15(8):945–951. | ||
Kozawa O, Tokuda H, Kaida T, Matsuno H, Uematsu T. Effect of vitamin D3 on interleukin-6 synthesis induced by prostaglandins in osteoblasts. Prostaglandins Leukot Essent Fatty Acids. 1998;58(2):119–123. | ||
Dickson IR, Roughley PJ. The effects of vitamin D deficiency on proteoglycan and hyaluronate constituents of chick bone. Biochim Biophys Acta. 1993;1181(1):15–22. | ||
Iacob SA, Banica D, Panaitescu E, Cojocaru M, Iacob D. Positive correlation of 25-hydroxyvitamin D plasma level and T helper activity in chronic hepatitis C patients. Inter J Biol Biomed Eng. 2010;2:43–51. | ||
Soliman AT, Eldabbagh M, Elawwa A, Saleem W. Does Vitamin D therapy affect hematological indices in adolescents with vitamin D deficiency? Indian J Endocrinol Metab. 2012;16(4):659–660. |
 © 2015 The Author(s). This work is published and licensed by Dove Medical Press Limited. The full terms of this license are available at https://www.dovepress.com/terms.php and incorporate the Creative Commons Attribution - Non Commercial (unported, v3.0) License.
By accessing the work you hereby accept the Terms. Non-commercial uses of the work are permitted without any further permission from Dove Medical Press Limited, provided the work is properly attributed. For permission for commercial use of this work, please see paragraphs 4.2 and 5 of our Terms.
© 2015 The Author(s). This work is published and licensed by Dove Medical Press Limited. The full terms of this license are available at https://www.dovepress.com/terms.php and incorporate the Creative Commons Attribution - Non Commercial (unported, v3.0) License.
By accessing the work you hereby accept the Terms. Non-commercial uses of the work are permitted without any further permission from Dove Medical Press Limited, provided the work is properly attributed. For permission for commercial use of this work, please see paragraphs 4.2 and 5 of our Terms.