Back to Journals » Clinical, Cosmetic and Investigational Dentistry » Volume 17
Effect of Staining and External Bleaching on the Color Stability and Surface Roughness of Universal-Shade Resin-Based Composite
Authors AlHabdan A ![]() , Alsuhaibani A, Alomran L, Almutib L
, Alsuhaibani A, Alomran L, Almutib L
Received 7 October 2024
Accepted for publication 19 December 2024
Published 6 January 2025 Volume 2025:17 Pages 1—12
DOI https://doi.org/10.2147/CCIDE.S494320
Checked for plagiarism Yes
Review by Single anonymous peer review
Peer reviewer comments 2
Editor who approved publication: Professor Christopher E. Okunseri
AlHanouf AlHabdan,1 Amal Alsuhaibani,2 Lama Alomran,2 Lulwah Almutib2
1Department of Restorative Dental Sciences, King Saud University, Riyadh, Saudi Arabia; 2College of Dentistry, King Saud University, Riyadh, Saudi Arabia
Correspondence: AlHanouf AlHabdan, Department of Restorative Dental Sciences, King Saud University, Riyadh, Saudi Arabia, Email [email protected]
Aim: This study evaluated the color stability and surface roughness of two universal-shade compared to two nanohybrid composites after staining and external bleaching with 40% hydrogen peroxide.
Methods: Two universal shade resin-based composites and two nanohybrid composites were tested. Twenty disc-shaped specimens from each material were fabricated and divided into two subgroups: one group was stained and bleached (staining group) and the other received bleaching treatment only (control group). The staining group was stained with coffee solution for 24 h. Subsequently, each sample of all four materials was bleached using an in-office bleaching gel using 40% hydrogen peroxide. Color measurements were performed using a spectrophotometer to obtain the International Commission on Illumination parameters, L*; a*; and b* for each of the following periods: baseline, after bleaching, and two weeks after bleaching for the control group. The staining group was examined at baseline, after staining, after bleaching, and two weeks after bleaching. Surface roughness (Ra) of all the materials after each treatment step were also recorded. The data was statistically analyzed using SPSS 26.0 statistical software. Changes were considered statistically significant at P = 0.05.
Results: Descriptive statistics (means and standard deviations) were used to describe color measurements and surface-roughness values. Two-analysis of variance and one-way analysis of variance were used to compare the mean values of surface roughness, L*a*b*and ΔE00 values. Statistically significant differences and clinically acceptable ΔE00 were observed between all materials during the different stages in color measurements, whereas the surface roughness was significantly different for each study material and treatment mode.
Conclusion: Staining with coffee solution and external bleaching produced acceptable color changes for all materials tested. Staining and bleaching increased the surface roughness values of the tested resin-based composites.
Keywords: composite, surface roughness, bleaching, teeth, spectrophotometer, profilometer
Clinical Significance
Staining and bleaching alter the color of some universal shade composites. This effect can reduce the need for composite replacement after bleaching.
Introduction
Conventional composite restorations are currently the main restorative materials used by dentists worldwide. They are fabricated in different shades that dentists can use to mimic the shades of the surrounding natural tooth.1 It is challenging to match the color of a composite with that of the surrounding tooth structure, and it depends on environmental and operator-dependent variables.2 The clinical effectiveness of dental composites depends on their physical, chemical, and mechanical features, which are strongly affected by the oral environment and properties of the resin material.3
Color stability is an important physical feature of composite materials. Color changes can occur due to a variety of etiologic variables, including both extrinsic and intrinsic factors.3 Intrinsic discoloration may arise as a result of a physiomechanical reaction within the material, whereas extrinsic discoloration is defined as the staining of the superficial layer of the resin composite. Extrinsic discoloration is caused by water sorption, smoking, and nutrition habits.4,5 In addition, the surface roughness of the composites is considered one of the main causes of extrinsic discoloration.6 Surface roughness exceeding 0.2 μm increases the likelihood of biofilm accumulation, which may result in staining and discoloration of the restoration.6,7
The staining of resin-based composites poses a major drawback, even when composites with different compositions are used. Staining can be caused by colored solutions such as coffee, tea, and chlorhexidine.4 A staining agent can penetrate the superficial layer of a composite. Hence, staining is observed more often in a composite with a greater amount of resin because of the high percentage of water sorption which increases the presentation of microcracks and interfacial gaps at resin filler interface, through which the stains can penetrate and contributes to color changes of resin composite.8 Discolored composites can be restored via professional cleaning, polishing, and bleaching.9 In severe cases, replacement is the preferred treatment option. Several studies support bleaching with H2O2 to remove stains and restore the original color of the composite.10
Universal shade resin composites were recently introduced to the market with the goal of decreasing the requirement for a variety of composite shades to be stored on hand, minimize the amount of wasted composite shades, cutting down on chairside time, eliminating the need for shade selection, and lowering the reliance on shade-matching techniques. The improved color adjustment potential, which is characterized as the “property that describes and quantifies the interaction between the physical and perceptual components of blending”, is demonstrated by these composites, according to the inventors.11 These materials have a universal opacity and are available in a few Vita tones, which the inventors recommend using in single-shade increments to match varied tooth colours.11 Resin based composites generally consist of three main components: the resin matrix (organic content), fillers (inorganic part), and coupling agents.12 The resin matrix of these composites mostly consists of bisphenol A-glycidyl dimethacrylate (Bis-GMA) mixed in different combinations with short-chain monomers, such as trietheneglycol-dimethacrylate (TEGDMA), urethane dimethacrylate (UDMA), and bisphenol A polyethylene glycol diether dimethacrylate (Bis-EMA). The fillers are made of glass, silica, or zirconia in different concentrations and shapes.13–16 Examples of universal composites include Omnichroma and Estelite (Tokuyama Dental), Beautifil (Shofu), Essentia Universal (GC), and Filtek Universal (3M).
In order to understand the effect of office bleaching on the color and surface roughness of universal shade composite, this in vitro study aimed to assess the color stability and surface roughness of different universal shade resin-based composite after staining and external bleaching with 40% hydrogen peroxide (H2O2). The null hypothesis was that there is no effect of staining and external bleaching on the color stability and surface roughness of universal shade composite.
Materials and Methods
This study was approved by the institutional review board of King Saud University project No (E-22-7075) and College of Dentistry Research Center of King Saud University No (IR 0428).
Four composite resin materials were used in this study. Two universal shade resin-based composites were used: Omnichroma (Tokuyama dental; Tokyo, Japan) and Beautifil II enamel (T) (Shofu Dental Corporation; Japan). They were compared with two nanohybrid composites, Tetric n-Ceram (A2) (Ivoclar Vivadent; Schaan, Liechtenstein) and Filtek Z350 XT (A2) (3M ESPE; St. Paul, USA). Additionally, one staining solution and one in-office bleaching product (Table 1) were used in this study. Specimens of each material were randomly divided into two subgroups of 10 specimens each. One group was subjected to staining and bleaching (staining group), and the other received the bleaching treatment only (control group).
 |
Table 1 Description of Materials Used in This Study |
Specimen Preparation
Twenty disc-shaped (10 mm × 5 mm) specimens were fabricated from each material (N = 80) using a stainless-steel mold. Each composite was packed into a mold using a plastic filing instrument. The mold was covered with a celluloid strip and glass plate. The samples were then light-cured using a light-emitting diode (LED) at a power density of approximately 800 mW/cm2 for 80s (3M ESPE Dental Products; Monrovia, CA, USA) from both the top and bottom. The distance between the light source and samples was standardized by placing the tip of the light-cure unit in direct contact with the glass slab. The specimens were directly finished and polished using a diamond finishing bur and Sof-lex discs and stored in distilled water at 37 °C for 24 h.
Staining Procedure
Ten discs from each major group (N = 40) were stained with 10 mL of a coffee solution, which was prepared by mixing coffee powder (Nescafé Gold; Nestle, Indonesia) in boiling water according to the manufacturer’s instructions. Subsequently, the specimens were immersed in the coffee solution for 3 h every day at room temperature for a test period of 2 weeks. The staining solution was changed every day. After each staining session, the specimens were gently rinsed and stored in artificial saliva until the following day. After the staining sessions were completed, surface roughness and color stability measurements were recorded.
Bleaching Procedure
In-office bleaching was performed on each sample in the four groups using an in-office bleaching gel containing 40% H2O2. After activating the syringe, the bleaching gel was applied in equal amounts for 45 min in three cycles, with each cycle lasting 15 min, according to the manufacturer’s instructions. Light rinsing was performed to eliminate the bleaching material via air drying after each cycle. After bleaching, the specimens were stored in distilled water until color measurements were performed.
Color Measurement
The color of the specimens was measured at three time points for the control group (baseline, after bleaching, and 2 weeks after bleaching) and at four time points for the staining group (baseline, after staining, after bleaching, and 2 weeks after bleaching). The color measurements were conducted using a VITA Easyshade V sрectrорhоtometer (VITA Zahnfabrik; Bad Säckingen, Germany). The device was calibrated and used according to the manufacturer’s instructions. Color measurements were recorded after the probe tip (Easyshade) was placed perpendicular to the center of the specimens. The L*a*and b* coordinates of the CIE system were recorded for each specimen. The L* coordinate represents color lightness, varying from white to black. The a* and b* coordinates represent the chroma of the color with the axes ranging from green to red and blue to yellow, respectively. C * is another parameter called the metric chroma, and it is given by the equation C* = (a2 + b2)1/2. ΔE00 values were then calculated using the following formula shown in Figure 1.
 |
Figure 1 Formula used to calculate ΔE00 values. |
Evaluation of Surface Roughness
The surface roughness (Ra) of the specimens was measured after each treatment step, including baseline, staining, and bleaching, for all groups. Characterization and imaging were performed using a Contour GT-K 3D Optical Microscope (Bruker) and via 3D non-contact surface metrology and interferometry. Each sample was scanned at three equidistant positions at three intervals and the average surface roughness (Ra) was determined.
Statistical Analysis
Data were analyzed using the SPSS software version 26 (IBM corporation; Chicago, IL, USA). Descriptive statistics (mean and standard deviation) were used to describe the surface-roughness values and the L*a*and b* coordinates of the color measurements. The two-way analysis of variance followed by Tukey’s multiple comparison test was used to compare the mean surface roughness Ra, L*a*b*and ΔE values at different experiment stages for the four study materials. A p-value of less than or equal to 0.05 was used to determine the statistical significance.
Results
Color Difference Results
Table 2 shows the mean and standard deviation of the color parameters in the CIELab systems for each material from the control and staining groups at the study stages. The L* values decrease for all the materials after staining and increase after bleaching. The highest L* value was recorded for Filtek after bleaching in the control group 61.669 (0.476) while the lowest L* value was recorded for Beautifil after staining 50.55 (0.601). Regarding a* values, the highest value was scored for Omnichroma in the staining group after bleaching −0.2633 (0.146) and the lowest value was recorded for Beautifil after staining −3.148 (0.222). The highest b* values was recorded for Omnichroma after staining 10.013 (1.000) and the lowest was for Beautifil after bleaching for the control group −6.126 (0.162).
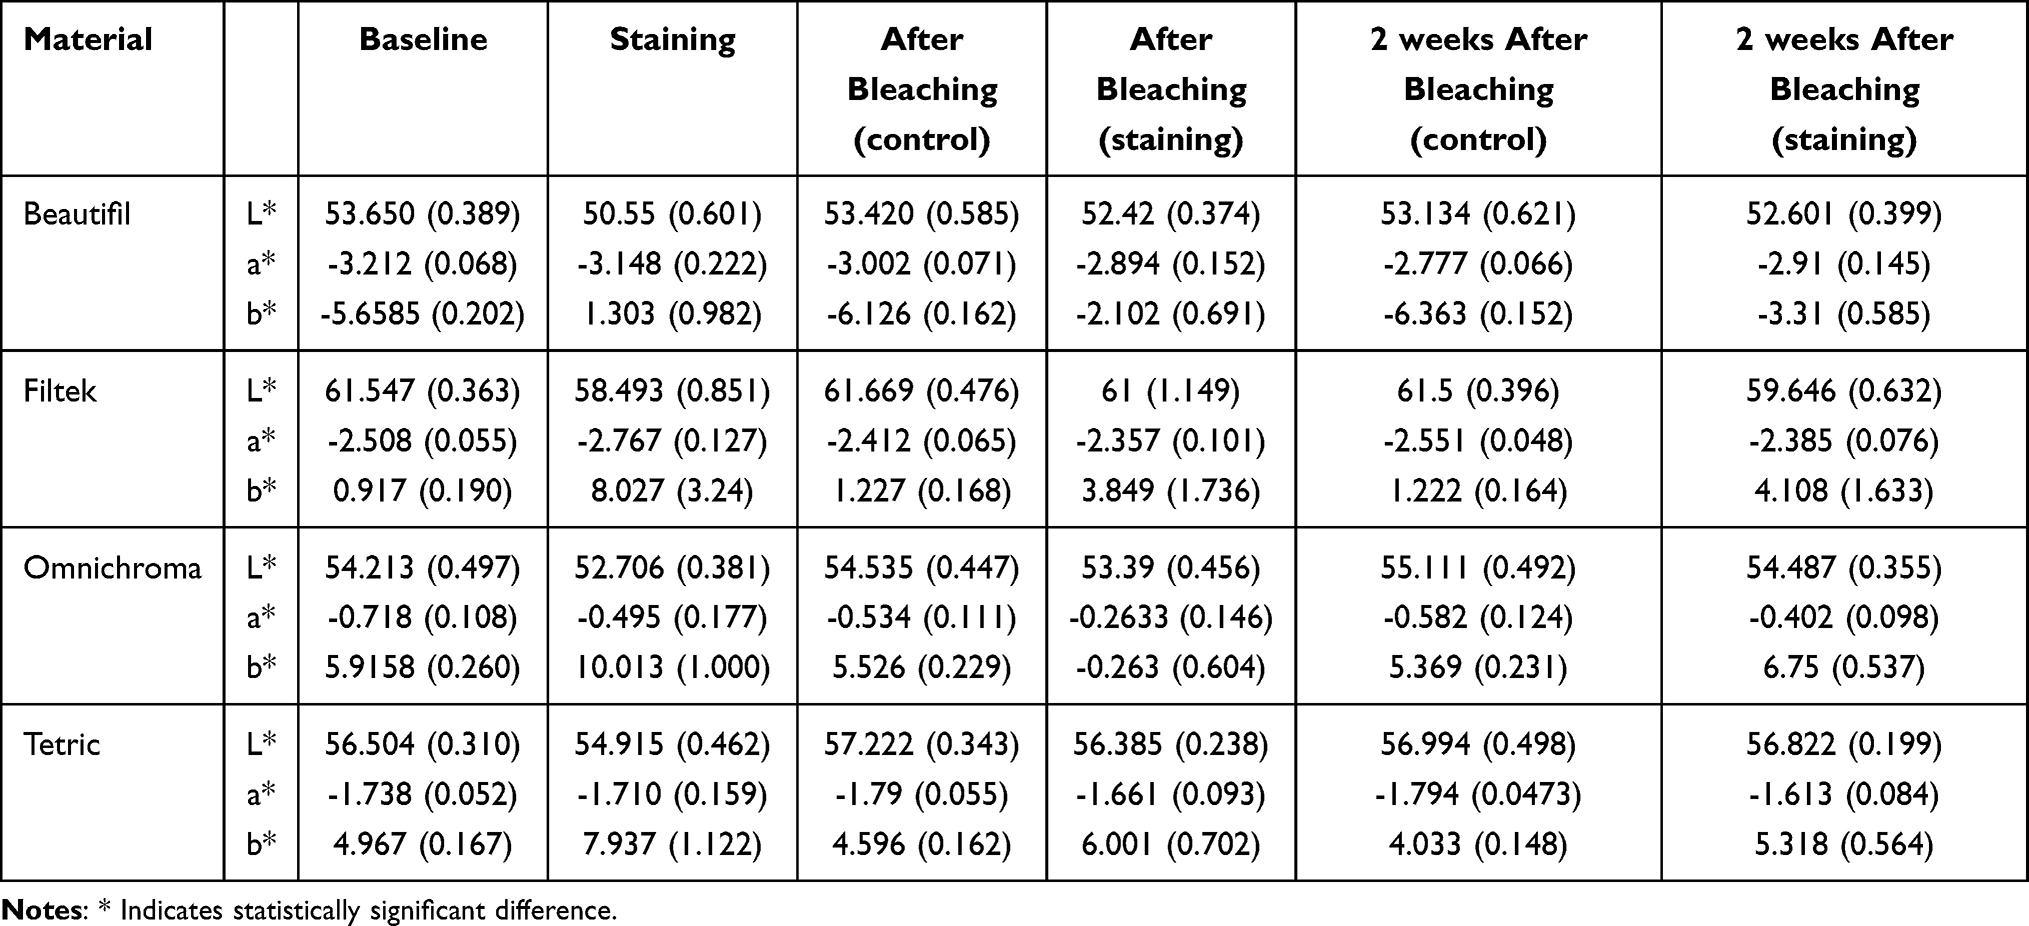 |
Table 2 Mean (Standard Deviation) Color Parameters in the CIELAB System for Specimens of Each Material at Different Study Stages |
Figure 2 shows the color differences (∆E00) values observed between different study stages for each material in the staining group. Beautifil exhibits the highest ∆E00 after staining (p < 0.001 for all materials), followed by Filtek, Omnichroma, and Tetric N-Ceram. After bleaching, Filtek exhibits the highest ∆E00 value, followed by Beautifil, Tetric N-Ceram, and Omnichroma. Two weeks after bleaching, the ∆E00 values decreases for all materials, with Omnichroma showing the highest values. Statistically significant differences were observed between all materials at the different stages of the study.
 |
Figure 2 Color difference (ΔE00) values at different study stages of each material from the staining group. |
Figure 3 shows the color differences (∆E00) values observed between different study stages for each material in the control group. All materials exhibit comparable ∆E00 values after bleaching and two weeks after bleaching. Tetric and Omnichroma exhibit the highest values of 0.7342 and 0.5179 after bleaching and two weeks after bleaching, respectively. Statistically significant differences were observed between all materials at the different stages of the study.
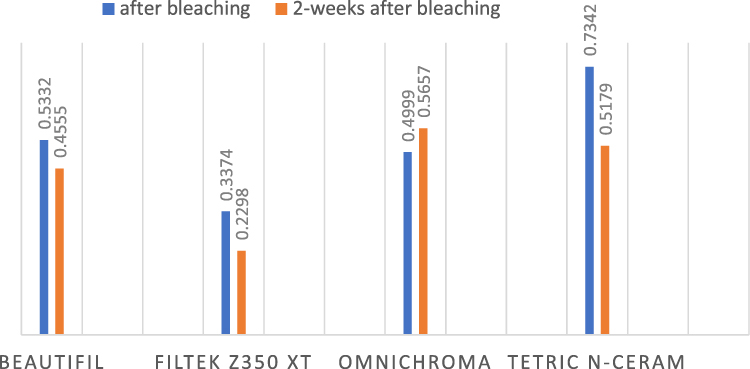 |
Figure 3 Color difference (ΔE00) values at different study stages of each material from the control group. |
Surface Roughness
The two-way analysis of variance was performed for comparing the average surface roughness at the different stages of the experiment (baseline, staining, bleaching (control) and bleaching (staining)) for the four study materials (Beautifil, Filtek, Omnichroma, and Tetric N-Ceram). The results showed a highly statistically significant difference in the mean values for the overall model (F = 5.401, p < 0.0001), type of material (F = 8.699, p < 0.0001), type of treatment (F = 11.218, p < 0.0001) and for the interaction term (type of material * type of treatment) (F = 2.076, p = 0.034). This indicated that the surface roughness values were significantly different for each study material and treatment.
One-way analysis of variance was performed for comparing the average surface roughness across the different stages of the experiment for the four study materials. The results showed a highly statistically significant difference between the Filtek (F=10.836, p<0.0001) and Omnichroma materials (F = 7.629, p<0.0001). Multiple comparisons of the average surface roughness revealed that, after the bleaching (staining) treatment, the mean surface roughness of the Filtek material after the bleaching (staining) treatment was significantly higher than that observed after the other three treatments. There was no difference in the mean surface roughness among the pairs for the three treatments (baseline, staining, and bleaching (control)). The mean surface roughness of the Omnichroma material after the bleaching treatment in both staining and control groups was significantly higher than the mean values obtained using the baseline and staining treatments. There was no significant difference in the mean values between the baseline and staining treatments. Additionally, no significant difference was observed in the mean values between bleaching (staining) and bleaching (control) treatments. However, the mean surface roughness values were not statistically significantly different across the four treatments for the Beautifil and Tetric N-Ceram materials (Table 3).
 |
Table 3 Comparison of Mean Values of Surface Roughness Among Different Stages of the Experiment in Each of the Four Study Materials |
We compared the mean surface roughness of the four types of materials at each stage of the experiment (Baseline, Staining, Bleaching(control), and Bleaching(staining)). The results showed a highly statistically significant difference at baseline (F = 6479, p = 0.001), after staining (F = 3.160, p = 0.036), and after bleaching (baseline) (F = 3.939, p = 0.016). The multiple comparison of mean surface roughness showed that at baseline, the mean surface roughness of three materials, Beautifil, Omnichroma, and Tetric N-ceram, was significantly lower than the mean surface roughness of Filtek. Additionally, there was no difference in the mean values between the pairs of these three materials. For the staining treatment, the multiple comparisons of mean values did not show any significant differences for any pair of the four study materials. After the bleaching (baseline) treatment, the mean surface roughness of the Omnichroma material was significantly higher than that of the Filtek material and was not significantly different from the mean surface roughness of the other two materials (Beautifil and Tetric N-Ceram). There were no differences in the mean surface roughness between any pair of Filtek, Beautifil, and Tetric N-Ceram. However, the mean surface roughness values were not significantly different among the four types of materials used for the bleaching (staining) treatment (Table 4).
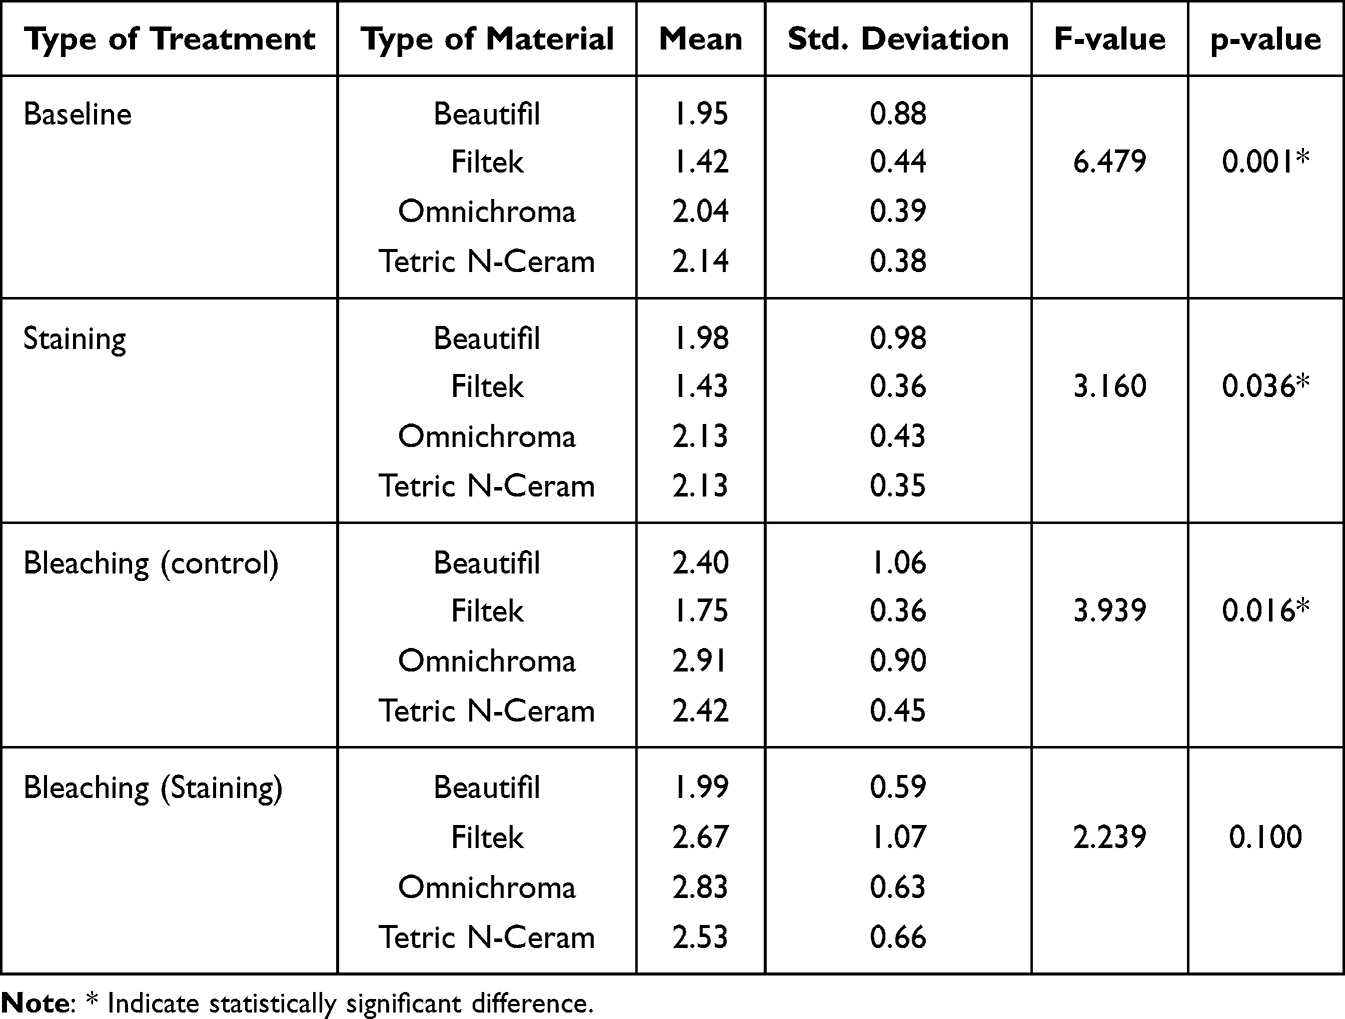 |
Table 4 Comparison of Mean Values of Surface Roughness Among the Four Types of Materials for Each Different Stages of the Experiment |
Discussion
The present study evaluated the color stability and surface roughness of two universal shade resin-based composites with respect to those of nanohybrid composites after staining with a coffee solution and external bleaching with 40% H2O2. The effect of bleaching materials on both the morphology and surface texture of resin-based composite materials should be considered, as it is a routine treatment in common dental practice. This study was postulated on the hypothesis that there is no effect of staining and external bleaching on the color stability and surface roughness of universal shade composite. Depending on the result of this study the null hypothesis was rejected.
Coffee was selected as the staining solution because it is one of the most frequently consumed beverages worldwide. Moreover, it has a substantial staining effect on both composites and natural teeth as it contains tannins and chromogens.17 Coffee discoloration is caused by both the adsorption and absorption of colorants by resin-based restorative products.18 Other potential staining agent includes: Tea (Black, Green, or Herbal), Soft Drinks (Cola-based), energy drinks and fruit juices.
According to the data provided by the manufacturers, the resin-based composites used in the present study differed in the size and percentage of the inorganic fillers, in addition to the type of organic matrix. The size, type, and distribution of fillers, along with the resin matrix composition and filler-matrix interaction, play crucial roles in determining the color stability and surface roughness of dental composites.19 Advanced composites, such as nano-hybrids with optimized filler load and strong matrix bonding, generally exhibit better aesthetics and durability, with lower susceptibility to staining and wear.20 Universal shade composite like omnichroma used in this study incorporates nano sized silicon dioxide (silica) and zirconium dioxide (zirconia) particles. These fillers are uniformly structured and engineered to specific sizes, giving the composite its ability to reflect specific wavelengths of light based on their size and arrangement, allowing the composite to adapt to the color of surrounding tooth structure. This eliminates the need for multiple shades, as one material can match virtually any tooth color in the A1–D4 shade range. The overall size and volume percentage of the inorganic fillers tested in this study is as follows for Filtek has an average filler size of 0.6 µm with 60% volume, while Tetric N-Ceram has a particle size in the range of 0.04–3 μm with 56% filler volume. Omnichroma has an average fillers size of 0.3 μm with 68% volume. Beautifil has fillers 10–20 nm in size and a load of 83.3%. Filtek contains Bis-GMA, UDMA, and Bis-EMA. Omnichroma contains 1.6(methacryl ethyloxycarbonylamino), UDMA, and TEGDMA. Tetric N-Ceram uses Bis-GMA, Bis-EMA, and TEGDMA as resin matrices. Beautifil contains Bis-GMA and TEGDMA. Bis-GMA and UDMA play essential roles in controlling the susceptibility of the materials to staining.21
Accurate color matching is critical in dentistry for aesthetic outcomes, particularly in restorative and prosthetic procedures.22 Utilizing instrument-based color measurement techniques such as digital imaging, colorimeters, or spectrophotometers generally helps eliminate sources of human error, leading to unbiased and reproducible results.22 The spectrophotometer assesses a single wavelength at a time by measuring the reflectance or transmittance of an object, rather than employing color filters that mimic the spectral sensitivity of the standard observer’s vision. A recent study demonstrated that in around 47% of cases, the spectrophotometer yielded more accurate outcomes compared to visual selection.23 This represents a significant advancement in the intricate process of color matching in clinical settings, offering potential benefits to both patients and dental laboratory technicians. In the present study, VITA Easyshade V sрectrорhоtometer was used to record specimen shade using CIE Lab color coordinates.The exceptional reliability, user-friendliness, and worldwide validity of the CIE Lab color system are well-known. Using this system color is mainly described in three coordinates: L*a*and b*. L* represent color lightness, a* represents chroma in red-green direction, and b* represent s chroma in yellow-blue direction. The aforementioned formula (Figure 1) is used to determine these coordinates manually or using a computer program to yield ΔE* values. In 2001, the CIE recommended its most recently discovered formula for color difference, CIEDE2000 (ΔE00), which is recognized as the ISO/CIE (ISO IOS-J03) standard.24 Compared to the traditional CIE Lab formula, most researchers believe that the CIEDE2000 formula more accurately captures color variations as seen by the human eye. When the ΔE00 value is detected between 0–0.8, it indicates the absence of any color change between the compared samples thus meaning an excellent match. If ΔE00 is between 0.8 and 1.8 it indicates an acceptable change in color. However, this change is undetectable visually and might be clinically acceptable Further, if ΔE00 is 1.8 and above, the change is detectable visually and might be considered unacceptable if it reaches more than 3.2.25 In agreement with previous studies,21,26 there were statistically significant differences between all materials during the different stages of this study. In the staining group, Beautifil exhibited the highest ∆E00 after staining among all the materials, whereas Filtek exhibited the highest ∆E00 after bleaching. Other studies have reported that Filtek exhibited the least color change.27,28 This may be because of the different bleaching materials and techniques used in the current and previous studies.27 For two weeks after bleaching, Omnichroma recorded the highest ∆E00 values. In the control group, all materials exhibited comparable ∆E00 both after bleaching and two weeks after bleaching.
The findings from the staining group indicated that all materials exhibited higher ΔE values after the staining procedure than the acceptable color change range (ΔE00 < 3.3), except for Tetric-N-Ceram, which exhibited a ΔE00 of 2.7. After bleaching the staining group, only Omnichroma and Filtek exhibited ΔE00 values higher than the clinically acceptable range of color change (ΔE00 < 3.3). Two weeks after bleaching, all materials showed ΔE values less than the acceptable color-change values. All materials in the control group showed ΔE values less than the acceptable range of color change (ΔE00 <3.3) in both stages (after bleaching and two weeks after bleaching).
The surface roughness of resin-based composites is considered the main factor causing extrinsic discoloration as it can significantly affect their ability to adjust color thus impacting their optical properties negatively.6,29–32 Surface roughness (Ra) is measured in micrometers. A surface roughness of 0.2 µm is the critical value. A surface roughness exceeding 0.2 µm is considered clinically relevant as this may increase the risk of biofilm accumulation, gingival inflammation, and extrinsic discoloration.33 In literature, studies have reported inconsistent results regarding the effect of whitening regimes on the surface roughness of different resin composites.34,35 While some studies found no significant impact of whiting treatment on resin composite others reported the opposite.36,37 One of the studies evaluated the effects of coffee staining and in-office bleaching with 30% H2O2 on the surface roughness of Joyfil nano-hybrid and Omnichroma resin-based composites. The results showed that the surface roughness of all groups were within the critical value (Ra < 0.2 μm) for both materials, with no significant difference among the groups (p > 0.05).26 Additionally, it was found that bleaching generally did not cause surface roughness, except for one type of composite resin (Opallis), for which bleaching with carbamide peroxide promoted an increase in surface roughness (p = 0.027).38 This variation in their results is likely due to several influencing factors, including the type of resin composite, the concentration of the whitening agent, the duration of exposure, the application protocol, and the type of measuring device used.
The present study showed that the surface roughness of Omnichroma and Tetric-N-Ceram exceeded 0.2 µm in all four subgroups (type of treatment). The surface roughness of Beautifil II exceeded 0.2 µm after bleaching in both staining and control groups. The mean surface roughness of Filtek surpassed 0.2 µm after bleaching in the staining group only. The differences between the mean values for the Filtek (F = 10.836, p < 0.0001) and Omnichroma materials (F = 7.629, p < 0.0001) were statistically significant. The difference between the mean surface-roughness values of Beautifil and Tetric-N-Ceram were not statistically significantly across the four subgroups (4 types of treatments).
The staining resistance of resin-based restorations in the oral environment is a crucial requirement for withstanding the exposure to saliva, food, and drinks, which are common extrinsic factors that lead to the discoloration of dental restorations.39 The results of our study are in agreement with those reported by Peng et al, who reported that the surface roughness of Filtek Z350 increased after bleaching in the Tetric N-Ceram group. However, this increase was not statistically significant.40 By contrast, another study concluded that the mean surface roughness values (Ra) of all sub-groups of Omnichroma did not exceed the critical limits (Ra < 0.2 μm).26,41,42 This controversial result may be attributed to the percentage of H2O2 in the bleaching material used in the present study.43 Wilder et al found that, compared to dry polishing, wet polishing resulted in greater surface roughness, which may be another reason for this controversy.44
This study has several limitations. The study samples were immersed in a particular type of staining beverage, which may not accurately reflect the staining potential of commonly consumed foods and beverages. However, as this was an in vitro study, it was difficult to accurately duplicate oral environments because food and beverage consumption is a dynamic process that does not allow for continuous static stain-retention in the oral cavity. Therefore, the in vitro effects of staining and bleaching on the surface roughness of restorative materials may differ from the in vivo effects. The effects of aging were not tested in this study. Hence, additional investigations are advised to assess the effect of aging on the color stability of the restorations. Further research on the effects of aging, occlusal stress, and clinical circumstances is warranted.
Conclusion
Within the limitations of the present study, we concluded that staining with coffee solution and bleaching with 40% H2O2 produced acceptable color changes for human eye detection. Staining significantly increased the surface roughness of Omnichroma. In addition, it was found that external bleaching increased the surface roughness of all tested composite resin materials.
Data Sharing Statement
Data presented in this research are available upon reasonable request to the corresponding author.
Ethics Approval and Consent to Participate
This study has been approved by the Institutional Review Board (IRB Project No. E-22-7075), College of Medicine, King Saud University and the College of Dentistry Research Center (CDRC No. IR 0428), King Saud University.
Acknowledgments
This paper has been uploaded to ResearchSquare as a preprint: https://www.researchsquare.com/article/rs-4361175/v1
Author Contributions
All authors made a significant contribution to the work reported, whether that is in the conception, study design, execution, acquisition of data, analysis and interpretation, or in all these areas; took part in drafting, revising or critically reviewing the article; gave final approval of the version to be published; have agreed on the journal to which the article has been submitted; and agree to be accountable for all aspects of the work.
Funding
No funding was received for this study.
Disclosure
The authors declares no competing interest.
References
1. Brown KM. Post-orthodontic restorative solution: conservative techniques with direct composite bonding. J Cosmetic Dent. 2020;36(3).
2. AlHamdan EM, Bashiri A, Alnashmi F, et al. Evaluation of smart chromatic technology for a single-shade dental polymer resin: an in vitro study. Appl Sci. 2021;11(21):10108. doi:10.3390/app112110108
3. Ahmed MA, Jouhar R, Vohra F. Effect of different pH beverages on the color stability of smart monochromatic composite. Appl Sci. 2022;12(9):4163. doi:10.3390/app12094163
4. Shamszadeh S, Sheikh-Al-Eslamian SM, Hasani E, Abrandabadi AN, Panahandeh N. Color stability of the bulk-fill composite resins with different thickness in response to coffee/water immersion. Int J Dent. 2016;2016:1–5. doi:10.1155/2016/7186140
5. Paolone G, Pavan F, Mandurino M, et al. Color stability of resin‐based composites exposed to smoke. A systematic review. J Esthetic Restorative Dentistry. 2023;35(2):309–321. doi:10.1111/jerd.13009
6. Jaramillo-Cartagena R, López-Galeano EJ, Latorre-Correa F, Agudelo-Suárez AA. Effect of polishing systems on the surface roughness of nano-hybrid and nano-filling composite resins: a systematic review. Dent J. 2021;9(8):95. doi:10.3390/dj9080095
7. Schmitt VL, Puppin-Rontani RM, Naufel FS, Nahsan FPS, Alexandre Coelho Sinhoreti M, Baseggio W. Effect of the polishing procedures on color stability and surface roughness of composite resins. Int Scholarly Res Notices. 2011;2011(1):617672.
8. Mundim FM, Garcia L, Pires-de-Souza Fd CP. Effect of staining solutions and repolishing on color stability of direct composites. J Appl Oral Sci. 2010;18(3):249–254. doi:10.1590/S1678-77572010000300009
9. TÜRKÜN LŞ, Türkün M. Effect of bleaching and repolishing procedures on coffee and tea stain removal from three anterior composite veneering materials. J Esthetic Restorative Dentistry. 2004;16(5):290–301. doi:10.1111/j.1708-8240.2004.tb00056.x
10. Osman EZ, Betamar NM, Bubteina NH, Mohamed RA. Effect of staining and bleaching on color change of resin composite restorative materials. Libyan J Dent. 2022;6(1):27–35. doi:10.37376/ljd.v6i1.3731
11. de Abreu JLB, Sampaio CS, Benalcazar Jalkh EB, Hirata R. Analysis of the color matching of universal resin composites in anterior restorations. J Esthetic Restorative Dentistry. 2021;33(2):269–276. doi:10.1111/jerd.12659
12. Ferracane JL. Resin composite--state of the art. Dent Mater. 2011;27(1):29–38. doi:10.1016/j.dental.2010.10.020
13. Abdulwahhab ZS, Alkhalidi EF. Effect of staining and bleaching on surface roughness of different nano hybrid resin composite materials. Al-Rafidain Dent J. 2021;21(1):42–50. doi:10.33899/rden.2020.127506.1042
14. Roeters J, Shortall A, Opdam N. Can a single composite resin serve all purposes? Br. Dent. J. 2005;199(2):73–79. doi:10.1038/sj.bdj.4812520
15. Zimmerli B, Strub M, Jeger F, Stadler O, Lussi A. Composite materials: composition, properties and clinical applications. A literature review. Schweizer Monatsschrift fur Zahnmedizin= Revue mensuelle suisse d’odonto-stomatologie= Rivista mensile svizzera di odontologia e stomatologia. 2010;120(11):972–986.
16. Mitra SB, Wu D, Holmes BN. An application of nanotechnology in advanced dental materials. J Am Dent Assoc. 2003;134(10):1382–1390. doi:10.14219/jada.archive.2003.0054
17. Gül P, Harorli OT, Akgül N, Gündoğdu M. Effect of different bleaching applications on the surface properties and staining susceptibility of dental composites. J Wuhan Univ TechnolMater Sci Ed. 2016;31(3):677–683. doi:10.1007/s11595-016-1428-2
18. Um CM, Ruyter I. Staining of resin-based veneering materials with coffee and tea. Quintessence Int. 1991;22(5):377–386.
19. Elfakhri F, Alkahtani R, Li C, Khaliq J. Influence of filler characteristics on the performance of dental composites: a comprehensive review. Ceram. Int. 2022;48(19):27280–27294. doi:10.1016/j.ceramint.2022.06.314
20. Alsharif S, Alhareb A, Abudalazez A. Components of dental resin composites: a literature review. AlQalam J Med Appl Sci. 2024;427–440. doi:10.54361/ajmas.247301
21. Peng P-W, Huang C-F, Hsu C-Y, et al. Color stability and staining susceptibility of direct resin-based composites after light-activated in-office bleaching. Polymers. 2021;13(17):2941. doi:10.3390/polym13172941
22. Mottaleb E, Tay W-M, Louca C, Leung A, Blizard R, editors. Assessment of the accuracy and repeatability of shade taking using visual and digital shade guides. ConsEuro Conference 2015; 2015.
23. Lasserre J-F, Pop-Ciutrila I-S, Colosi H-A. A comparison between a new visual method of colour matching by intraoral camera and conventional visual and spectrometric methods. J Dent. 2011;39:e29–e36. doi:10.1016/j.jdent.2011.11.002
24. AlHabdan A, AlShamrani A, AlHumaidan R, AlFehaid A, Eisa S. Color matching of universal shade resin‐based composite with natural teeth and its stability before and after in‐office bleaching. Int J Biomater. 2022;2022(1):8420890. doi:10.1155/2022/8420890
25. Paravina RD, Ghinea R, Herrera LJ, et al. Color difference thresholds in dentistry. J Esthet Restor Dent. 2015;27 Suppl 1:S1–9.
26. Abdul Wahhab ZS, Alkhalidi EF. Color change of two different nano-hybrid resin composite materials after staining and bleaching.(an in vitro study). Medico-Legal Update. 2021;21(1).
27. Rao YM, Srilakshmi V, Vinayagam KK, Narayanan LL. An evaluation of the color stability of tooth-colored restorative materials after bleaching using CIELAB color technique. Indian J Dent Res. 2009;20(1):60–64. doi:10.4103/0970-9290.49071
28. Rosentritt M, Lang R, Plein T, Behr M, Handel G. Discoloration of restorative materials after bleaching application. Quintessence Int. 2005;36(1):33–39.
29. Ereifej NS, Oweis YG, Eliades G. The effect of polishing technique on 3-D surface roughness and gloss of dental restorative resin composites. Oper Dent. 2013;38(1):E1–12. doi:10.2341/12-122-L
30. Chiang Y-C, Lai E-H-H, Kunzelmann K-H. Polishing mechanism of light-initiated dental composite: geometric optics approach. JFormos Med Assoc. 2016;115(12):1053–1060. doi:10.1016/j.jfma.2015.10.010
31. Jefferies SR. Abrasive finishing and polishing in restorative dentistry: a state-of-The-art review. Dent Clin North Am. 2007;51(2):379–397. doi:10.1016/j.cden.2006.12.002
32. Chour RG, Moda A, Arora A, Arafath MY, Shetty VK, Rishal Y. Comparative evaluation of effect of different polishing systems on surface roughness of composite resin: an: in vitro: study. J Int Soc Prev Comm Dent. 2016;6(Suppl 2):S166–S70. doi:10.4103/2231-0762.189761
33. Telang A, Narayana IH, Madhu K, Kalasaiah D, Ramesh P, Nagaraja S. Effect of staining and bleaching on color stability and surface roughness of three resin composites: an: in vitro: study. Contemp Clin Dent. 2018;9(3):452–456. doi:10.4103/ccd.ccd_297_18
34. Paravina RD, Pérez MM, Ghinea R. Acceptability and perceptibility thresholds in dentistry: a comprehensive review of clinical and research applications. J Esthetic Restorative Dentistry. 2019;31(2):103–112. doi:10.1111/jerd.12465
35. Chen S, Zhu J, Yu M, Jin C, Huang C. Effect of aging and bleaching on the color stability and surface roughness of a recently introduced single-shade composite resin. J Dent. 2024;143:104917. doi:10.1016/j.jdent.2024.104917
36. Savic-Stankovic T, Karadzic B, Komlenic V, et al. Effects of whitening gels on color and surface properties of a microhybrid and nanohybrid composite. Dent Materials J. 2021;40(6):1380–1387. doi:10.4012/dmj.2021-030
37. Erturk-Avunduk AT, Cengiz-Yanardag E, Karakaya I. The effect of bleaching applications on stained bulk-fill resin composites. BMC Oral Health. 2022;22(1):392. doi:10.1186/s12903-022-02414-9
38. Fernandes RA, Strazzi-Sahyon HB, Suzuki TYU, Briso ALF, Dos Santos PH. Effect of dental bleaching on the microhardness and surface roughness of sealed composite resins. Restorative Dent Endod. 2020;45(1). doi:10.5395/rde.2020.45.e12
39. Karadas M, Alkurt M, Duymus Z. Effects of hydrogen peroxide-based mouthwashes on color changes of stained direct composite resins. J Res Dent. 2016;4(1):11–16. doi:10.4103/2321-4619.176018
40. Kaya S, Bektaş Ö. Effect of in-office bleaching on the surface roughness of different composite resins. Cumhuriyet Dent J. 2022;25.
41. Bollenl CM, Lambrechts P, Quirynen M. Comparison of surface roughness of oral hard materials to the threshold surface roughness for bacterial plaque retention: a review of the literature. Dent. Mater. 1997;13(4):258–269. doi:10.1016/S0109-5641(97)80038-3
42. Zissis AJ, Polyzois GL, Yannikakis SA, Harrison A. Roughness of denture materials: a comparative study. Int J Prosthodontics. 2000;13(2):136–140.
43. Sulieman M, Addy M, MacDonald E, Rees J. The effect of hydrogen peroxide concentration on the outcome of tooth whitening: an in vitro study. J Dent. 2004;32(4):295–299. doi:10.1016/j.jdent.2004.01.003
44. Wilder A Jr, Swift E Jr, May K Jr, Thompson J, McDougal R. Effect of finishing technique on the microleakage and surface texture of resin-modified glass ionomer restorative materials. J Dent. 2000;28(5):367–373. doi:10.1016/S0300-5712(99)00075-5
 © 2025 The Author(s). This work is published and licensed by Dove Medical Press Limited. The
full terms of this license are available at https://www.dovepress.com/terms
and incorporate the Creative Commons Attribution
- Non Commercial (unported, 3.0) License.
By accessing the work you hereby accept the Terms. Non-commercial uses of the work are permitted
without any further permission from Dove Medical Press Limited, provided the work is properly
attributed. For permission for commercial use of this work, please see paragraphs 4.2 and 5 of our Terms.
© 2025 The Author(s). This work is published and licensed by Dove Medical Press Limited. The
full terms of this license are available at https://www.dovepress.com/terms
and incorporate the Creative Commons Attribution
- Non Commercial (unported, 3.0) License.
By accessing the work you hereby accept the Terms. Non-commercial uses of the work are permitted
without any further permission from Dove Medical Press Limited, provided the work is properly
attributed. For permission for commercial use of this work, please see paragraphs 4.2 and 5 of our Terms.