Back to Journals » Drug Design, Development and Therapy » Volume 11
Effect of roll compaction on granule size distribution of microcrystalline cellulose–mannitol mixtures: computational intelligence modeling and parametric analysis
Authors Kazemi P ![]() , Khalid MH, Pérez Gago A, Kleinebudde P, Jachowicz R, Szlęk J, Mendyk A
, Khalid MH, Pérez Gago A, Kleinebudde P, Jachowicz R, Szlęk J, Mendyk A
Received 14 October 2016
Accepted for publication 25 November 2016
Published 18 January 2017 Volume 2017:11 Pages 241—251
DOI https://doi.org/10.2147/DDDT.S124670
Checked for plagiarism Yes
Review by Single anonymous peer review
Peer reviewer comments 2
Editor who approved publication: Dr James Janetka
Pezhman Kazemi,1 Mohammad Hassan Khalid,1 Ana Pérez Gago,2 Peter Kleinebudde,2 Renata Jachowicz,1 Jakub Szlęk,1 Aleksander Mendyk1
1Department of Pharmaceutical Technology and Biopharmaceutics, Faculty of Pharmacy, Jagiellonian University Medical College, Krakow, Poland; 2Institute of Pharmaceutics and Biopharmaceutics, Heinrich-Heine-University, Düsseldorf, Germany
Abstract: Dry granulation using roll compaction is a typical unit operation for producing solid dosage forms in the pharmaceutical industry. Dry granulation is commonly used if the powder mixture is sensitive to heat and moisture and has poor flow properties. The output of roll compaction is compacted ribbons that exhibit different properties based on the adjusted process parameters. These ribbons are then milled into granules and finally compressed into tablets. The properties of the ribbons directly affect the granule size distribution (GSD) and the quality of final products; thus, it is imperative to study the effect of roll compaction process parameters on GSD. The understanding of how the roll compactor process parameters and material properties interact with each other will allow accurate control of the process, leading to the implementation of quality by design practices. Computational intelligence (CI) methods have a great potential for being used within the scope of quality by design approach. The main objective of this study was to show how the computational intelligence techniques can be useful to predict the GSD by using different process conditions of roll compaction and material properties. Different techniques such as multiple linear regression, artificial neural networks, random forest, Cubist and k-nearest neighbors algorithm assisted by sevenfold cross-validation were used to present generalized models for the prediction of GSD based on roll compaction process setting and material properties. The normalized root-mean-squared error and the coefficient of determination (R2) were used for model assessment. The best fit was obtained by Cubist model (normalized root-mean-squared error =3.22%, R2=0.95). Based on the results, it was confirmed that the material properties (true density) followed by compaction force have the most significant effect on GSD.
Keywords: computational intelligence, milling, roll compaction, dry granulation, neural network, Cubist
Introduction
Roll compaction is one of the most common dry granulation unit operations used to convert powder mixture into ribbons. Dry granulation is commonly used in the pharmaceutical industry if the powder mixture is sensitive to heat and moisture and has poor flow properties. Dry granulation generally consists of roll compaction stage in which the powder mixture flows through two counter-rotating rolls, usually with the assistance of one or two feed screws, to be compacted and form densified ribbons that will afterward pass through a milling step to produce granules with specific size distribution. The ribbon properties are the result of multivariate interactions between various process parameters, configuration and conditions of roll compaction process that can influence different properties of intermediate and final products.1–3 Furthermore, as the milling stage is located right after the roll compaction process, the granule properties are strong functions of the ribbon properties. The granule size distribution (GSD) is known as an important characteristic that has significant effect on the properties of the final product, such as dissolution profile and compact strength.4 To find out the multifactorial dependency between formulation, process and quality attributes, the use of multivariate approaches, such as design of experiment (DoE), sensitivity analysis, response surface method and multivariate data analysis, is unavoidable. To find out these complex dependencies, the US Food and Drug Administration (FDA) introduced the quality by design (QbD) approach.4,5 Pharmaceutical QbD is a systematic approach toward formulation development that starts with predefined objectives and emphasizes product and process understanding.6 In general, QbD approach has expressed the need for deeper understanding of different pharmaceutical processes and how input parameters, such as material properties or process settings, influence granule quality and process performance with respect to the variation in critical quality attributes (CQAs) of the final product.7 Several studies have been performed by using traditional DoE technique to investigate how the roll compaction settings influence the properties of granules. Most of them used the DoE technique which involved response surface methodology (RSM) combined with multiple linear regression (MLR).5 However, the behavior of most processes in the pharmaceutical industry is complex and nonlinear, which makes it difficult to model these systems precisely by using linear regression.8 Emerging computational intelligence (CI) techniques that can be easily coupled with DoE can overcome the limitation of these methods. One of the most important benefits of CI methods is that the model can be developed easily without prior knowledge about the process. Several CI techniques, such as decision trees, artificial neural networks (ANNs), genetic programming and support vector machines, have been used to model pharmaceutical processes.7,9–11
Rambali et al12 studied the effect of roll compactor variables such as compaction force, roll surface type, gap width and screen size on mean granule size (d50). To perform experiments, they used full-factorial design approach. Based on their analysis, the compaction force and roll surface type are the most meaningful factors. For a fixed gap width and sieve size, increasing compaction force and using smooth roll surface led to a decrease in mean granule size.
Weyenberg et al13 employed experimental factorial design to study the effect of roll compaction (Fitzpatrick® IR220) settings on the preparation of bioadhesive granules. The formulation consisted of drum-dried waxy maize starch, Carbopol® 974P and ciprofloxacin in the ratio of 90.5:5:3 (w/w/w). The roll speed, the horizontal screw speed and the compaction force were varied, while the vertical screw speed was kept constant. Afterward, the ribbons were milled to obtain granules within the specific size ranges. They found that compaction force and the roll speed have the most significant influence on the granule characteristics, followed by the horizontal screw speed.
In other work, Souihi et al6 estimated the design space of the roll compaction process by using statistical DoE and multivariate modeling. For this purpose, a reduced central composite face-centered (CCF) design was used to assess the effect of roll compaction process variables (roll force, roll speed, gap width and screen size) on the different intermediate and final products. They showed that roll force and screen size were the most critical parameters in roll compaction process.
In brief, most of the studies in the past have been performed by using DoE combined with linear regression and less works were conducted on CI methods. The goal of this study was to demonstrate the usefulness of CI techniques as potential tools to reveal the influence of roll compaction process on the particle size distribution. In particular, our objective was to demonstrate how to build a complete model for GSD integrating various types of information, namely quantitative and qualitative composition, physicochemical characteristics of the materials and technological parameters. Despite purely empirical nature of our approach, focusing on CI tree-based systems, we also attempted to elucidate some quantitative relationships governing GSD in the design space of the available data set.
Materials and methods
Microcrystalline cellulose (MCC, Avicel® PH101; FMC BioPolymer, Philadelphia, PA, USA), and mannitol (Pearlitol® 200SD; Roquette, Lestrem, France), which are widely used excipients in the pharmaceutical industry, were used as model powders. The true density of the pure powders was determined using a helium pycnometer (Accupyc 1330; Micromeritics Instrument Corp., Norcross, GA, USA). Moreover, the influence of mixture composition, their mechanical properties on the roll compaction process and the quality of granules were studied. Therefore, five binary mixtures composed of mannitol and MCC (15%, 30%, 50%, 70%, and 85% MCC) were produced. To calculate the true density of the mixture, the following equation was used:14
|
|

where ρ1, ρ2 and ρm are the true density of powder 1, powder 2 and their mixture, respectively. n1 and n2 are the weight fractions of the constituent powders. The detailed explanation of the preparation of binary mixture can be found in the study by Pérez Gago and Kleinebudde.1
Roll compaction and granulation
The feed powder and their binary mixture were compacted by Gerteis roll compactor 3-W-Polygran® 250/50/3 (Gerteis Maschinen + Processengineering AG, Rapperswil-Jona, Switzerland). The powder was fed to the system by the hopper and transported to the compaction zone by feeding auger (FA) and tamping auger (TA). The compaction system consisted of two counter-rotating rolls of 250 mm in diameter and 50 mm in width with knurled surfaces and cheek plates sealing system. Different combinations of roll compaction setting (Table 1) were used to produce ribbons with different properties.
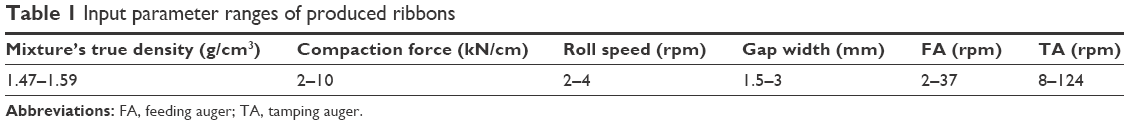 | Table 1 Input parameter ranges of produced ribbons |
For the milling stage, around 300 g of ribbons collected was milled in a Frewitt sieving machine (GLA ORV 0215; Frewitt, Fribourg, Switzerland) under standard conditions. This mill was equipped with a 1 mm mesh sieve, and the speed and oscillating angle were kept constant at 154 rpm and 90°, respectively. To minimize noise in the output, the sieve machine was cleaned between each batch with a vacuum cleaner. The samples were kept in a climate room under 21°C and 45% relative humidity for at least 24 h before performing any characterization.
GSD
To obtain a uniform sample for analysis, the granules were sampled using a rotary sample divider (PT, Retsch Technology GmbH, Haan, Germany). To measure the GSD, a dynamic image analyzer (Camsizer® XT; Retsch Technology GmbH) with the X-jet module was used. The dispersion pressure used in this study was 30 kPa and ~9 g of granules were measured for each sample. Analysis of each batch was run in triplicates.
Data set
According to DoE, 161 data records were generated by varying roll compaction process setting. The data set consisted of information about the mixture’s true density (g/cm3), compaction force (kN/cm), gap width (mm), roll speed (rpm), TA speed (rpm), FA speed (rpm) and size class. The size class is a nonphysical parameter denominating the difference between various classes of volume distribution q3(x). By choosing different values (1, 10, 31, 45, 64, 90, 125, 180, 250, 325, 500, 710, 1,000, 1,400 and 2,000) of a size class, the model can predict, q3(x), the whole GSD curve.
Model assessment
Model goodness of fit was expressed as root-mean-squared error (RMSE, Equation 1) and normalized root-mean-squared error (NRMSE; Equation 2):
|
|
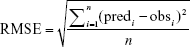
where obs and pred are the observed and predicted values, respectively; i is the data record number and n is the total number of records.
|
|
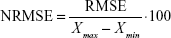
where RMSE is the error calculated for model, Xmax is the maximum value of the observed results and Xmin is the minimum value of the observed results.
Linear scaling was employed based on Equation 4 for ANNs in the output range of 0.1–0.9 to meet the criteria of nonlinear transfer functions:
|
|
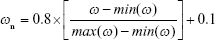
where ω and ωn are the standard and normalized values of input data, respectively.
Furthermore, to assess the generalization ability of the models, sevenfold cross-validation (CV) scheme was applied. Since the data set was represented by seven mixtures, each fold was composed of data points for six mixtures for training and the seventh for testing the model. Figure 1 shows a simple schematic diagram of sevenfold CV. The best models were chosen according to the lowest average NRMSE and the highest R2 values.
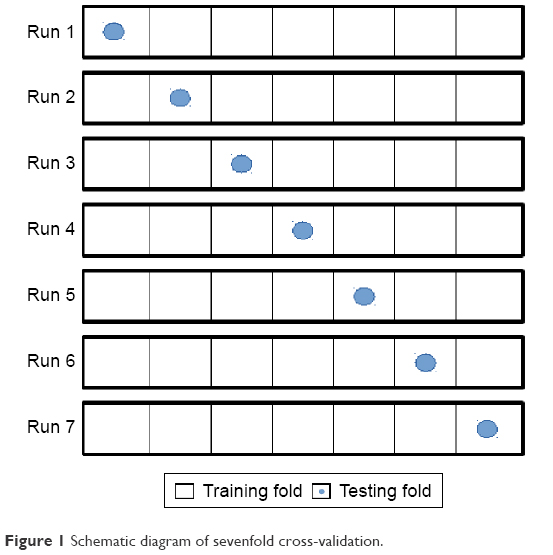 | Figure 1 Schematic diagram of sevenfold cross-validation. |
Computational methods
MLR
To verify whether a linear relationship exists between input and output parameters, the MLR model approach was utilized. MLR model was implemented by using lm() function in the R environment.15
ANN model
The ANN is a powerful tool for solving highly nonlinear problems without prior knowledge by finding the relationship between input and output parameters. Generally, ANN is an information processing unit which is bioinspired by the human brain. The main processing component of ANN is artificial neuron. ANN models have three different layers including input, hidden and output layers, where each layer is composed of interconnected neurons.4 The structure of an ANN model can be defined by the number of layers with respective number of neurons in each layer and the type of the transfer function. Optimizing the structure of the neural network is still one of the challenging steps in ANN modeling. There is no rule to finding the best structure; therefore, the trial and error method has been widely used by many researchers. There are several types of ANN models such as feed-forward, radial basis function (RBF), recurrent neural network and modular neural networks which have been used to model different engineering problems.4,16,17 Among different types of feed-forward network, multilayer perceptrons (MLPs) have been used extensively. In this article, a feed-forward ANN based on back propagation (BP) algorithm was implemented. In feed-forward neural network, the signal flows toward the output layer through one or more hidden layers occupied with interconnected neurons. Different types of transfer function such as hyperbolic tangent sigmoid (tansig), logarithm sigmoid (logsig) or linear (purelin) can be used for each layer. The transfer function is essential to transfer the weighted sum of all the signals connected with a neuron. In this study, to implement the feed-forward neural network, “monmlp” package in the R environment was used.15,18 The monmlp is the generalized feed-forward MLP neural networks which work in a monotone fashion. All studied networks consisted of two hidden layers with 2–20 neurons per layer. The transfer function for hidden layer and output layer was chosen as tansig and purelin, respectively. The ensemble system consisted of 10 or 20 neural networks for each model. To avoid local minima, the trial parameter was set to 5. Furthermore, 10, 50, 80, 100, 200, 400, 500, 800 and 1,000 iterations were applied. As mentioned earlier, the trial and error method was utilized to find out the best structure and parameters of the network.19
Cubist
Cubist is an implementation of model tree approach in R, which was first introduced by Quinlan.20 The Cubist model is very similar to binary decision tree except there are linear regression functions at each node starting from the root to the last node. The whole model can be expressed as a set of rules, where each rule has an associated linear regression model created at terminal node. If a situation satisfies a rule’s conditions, the associated model is applied to predict the output. The model construction consists of two stages. In stage one, splitting criteria are applied to create a decision tree and afterward in stage two a pruning approach will be used to prune back an overgrown tree.21 The algorithm uses standard deviation reduction (SDR) criteria to find out the best splitting set. After considering all the possible splits, the algorithm chooses the one that maximizes the SDR criteria. This splitting procedure often creates a large tree structure which causes overfitting with testing dataset. To solve this problem, the pruning procedure is implemented to replace a sub-tree with a linear regression function.20,22
For the modeling purpose, “Cubist” package in the R environment was used.15,23 The maximum number of rules and the number of committees were set at 100 and from 1 to 100, respectively. The extrapolation parameter, which controls the extrapolation ability of created models, was set at 100. The sample parameter, which is a percentage of the randomly selected data set for model building, was considered at zero.
Random forest (RF)
RFs are tree-based models which are using the combination of hundreds of unpruned decision trees to produce more accurate predictions and overcome the overfitting problem. RF is a nonparametric statistical method that was first introduced by Breiman.24 RF model construction has different steps. The first step is random selection of subsamples, where approximately two-thirds of the initial sample will be chosen as bootstrap sample (called the in-bag samples) and the remaining sample will be left out (called the out-of-bag [OOB] samples).25 The second step involves the selection of the number of variables randomly sampled as candidates at each node (mtry). To reduce the chance of overfitting, the mtry value should be minimized. The third step includes the construction of a tree, based on the in-bag and the mtry variables. The number of constructed trees in the forest can be defined by ntree parameter. The tree construction algorithm uses recursive partitioning approach to split the larger space into two smaller pieces. The selection of split point is an optimization problem based on the squared error loss.25,26 “randomForest” package in an R environment was used to develop RF models.15,27 The following parameters were used during the modeling process: from 1 to 7, the variables were randomly selected at each split (mtry); the maximum number of nodes was set at 1,000 (maxnodes) and the number of trees was set from 10 to 1,000 (ntree). maxnodes is the minimum size of terminal nodes, if the number is larger the smaller trees are grown.
k-Nearest Neighbors algorithm (k-NN)
k-NN belongs to intuitive methods frequently used for regression and classification problems. It is a simple method that stores all available cases and predicts the new cases based on a similarity measure. In a simple way, k-NN works by selecting the k-closest samples to the considered point and predicting the output based on the weighted mean of the outputs of k-NN.28 Generally, the neighbors can be selected by different similarity metrics such as Euclidean, Manhattan and Canberra distance. The upper limit for k-value is a total number of observations in the training data set. There is more chance of decreasing computation complexity and increasing model accuracy by choosing a proper k-value. The optimal k-value is often determined by CV approach.29,30 k-NNreg function of Caret package in an R environment was used to develop k-NN models.15,31 The number of neighbors was established iteratively.
Results and discussion
More than 10,000 models with different architectures were trained and tested over important tuning parameters of mentioned CI methods. To find out the generalization ability of developed models, sevenfold CV approach was implemented. The developed model was not intended to be used with different excipients and/or active pharmaceutical ingredients (APIs) except the binary mixture of MCC and mannitol; therefore, all the results and conclusions reflect only the case involving both excipients. Introduction of the third excipient or API may completely change the behavior of the powder and as a consequence the results.
Model performance
The performance results of sevenfold CV of the best obtained models are shown in Table 2. The MLR model was used to indirectly point out the high nonlinearity in the data set. The statistical characteristics of the developed MLR model are shown in Table 3. The importance of each parameter relies on P-value; hence, those parameters with P-values <0.05 were chosen as the most important ones among others. Based on this statement, size class, compaction force, true density, gap width and intercept were the most important parameters. The relationship between the actual values and predicted ones for the MLR model is shown in Figure 2.
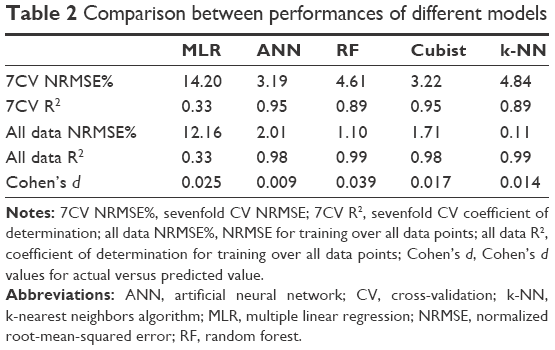 | Table 2 Comparison between performances of different models |
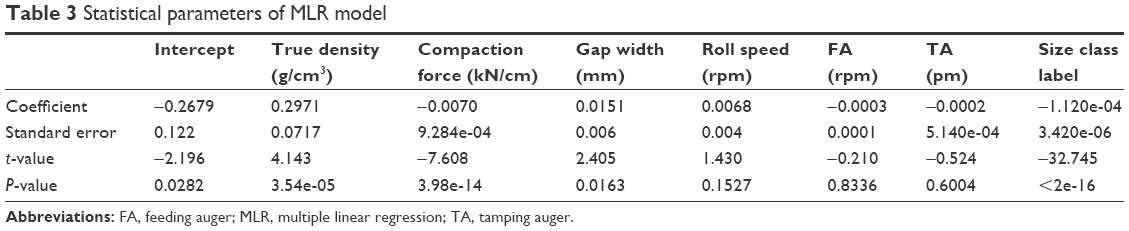 | Table 3 Statistical parameters of MLR model |
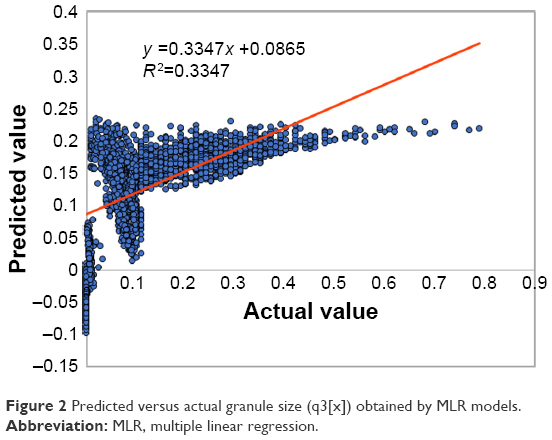 | Figure 2 Predicted versus actual granule size (q3[x]) obtained by MLR models. |
From Figure 2, it can be concluded that severe nonlinearity (R2=0.33) exists between input and output parameters, suggesting the use of other efficient methods to address this problem. Therefore, to develop more precise model, ANN, RF, Cubist and k-NN were used. According to Table 2, by considering sevenfold CV NRMSE, ANN, and Cubist models have indicated higher prediction performance and generalization ability compared to RF and k-NN. Figure 3 shows the observed versus predicted values for Cubist (Figure 3A) and ANN (Figure 3B) models based on the sevenfold CV data set. The linear regression fit applied to the plotted data shows the correlation coefficients of 0.95 for both models, and NRMSE values of 3.22% and 3.19%, respectively. In comparison, the prediction of both models was in the same range; however, Figure 3B shows that some points, especially those which are close to zero, were predicted as negative values indicating inefficiency of the ANN to predict values near the border of the designed space. The inaccuracy of the ANN model to predict q3(x) is also depicted in Figure 4. Other methods such as Cubist, RF, and k-NN were precise in terms of following the distribution profile, except the ANN which predicted the q3(0) as negative value.
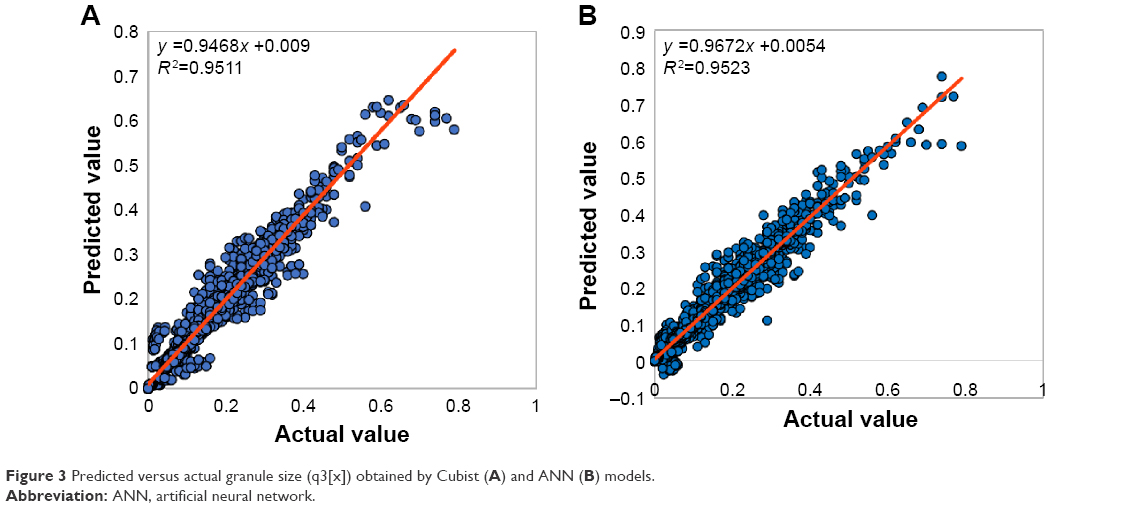 | Figure 3 Predicted versus actual granule size (q3[x]) obtained by Cubist (A) and ANN (B) models. |
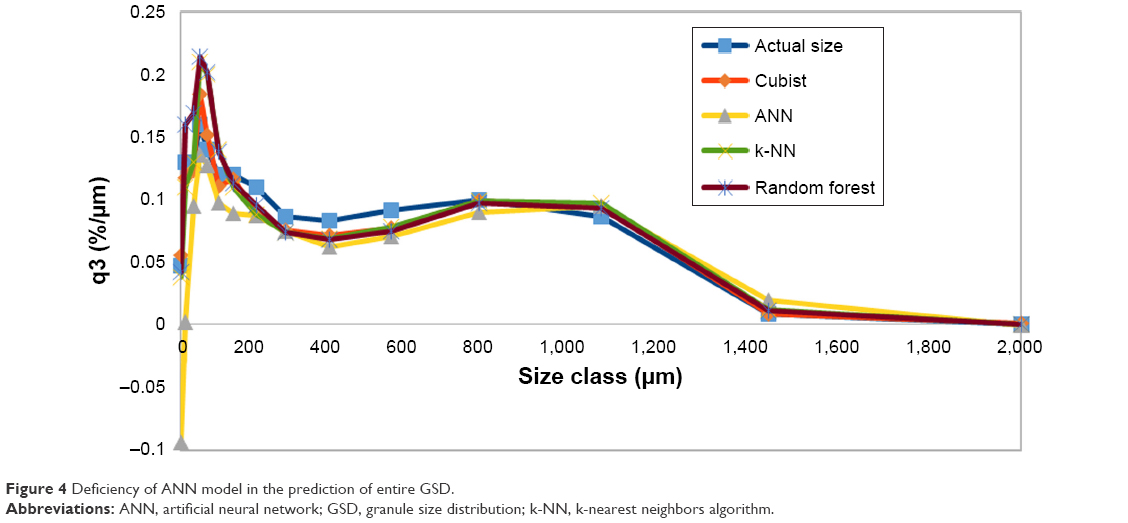 | Figure 4 Deficiency of ANN model in the prediction of entire GSD. |
Although the inaccuracy of the ANN model can be addressed by using absolute values of predicted data points, yet ANNs are generally black box models. Therefore, the developed ANN model cannot be analyzed further to see how the parameters are interacting with each other to predict the size distribution. Moreover, ANN models are very unstable compared to Cubist models, which means that retraining may produce models with different generalization errors. Using modified data set during retraining and training is identified as the major sources of instability.
On the contrary, Cubist is stable and fast and offers white box behavior and interpretability of the developed models. Cubist shows a good prediction performance of NRMSE =3.22% for sevenfold CV data set. The benefit of Cubist method is that the results are transparent; thus, they can be expressed in the form of rules and equations.
The example given below shows a sample of obtained Cubist model tree:
if |
|
X1 > 1.486832 |
|
X2 > 2 |
|
X7 > 710 |
|
X7 <= 1,000 |
|
then |
|
outcome = −0.0050119 − 0.012 X3 + 0.07 X1 |
|
if |
|
X1 > 1.504054 |
|
X2 <= 2 |
|
X7 > 90 |
|
X7 <= 180 |
|
then |
|
outcome = 4.6290477 − 0.002045 X7 − 2.68 X1 + 0.019 X3 |
where X1, X2, X3 and X7 are the true density, compaction force, gap width and class label, respectively. The outcome is density distribution q3(x).
Variable importance by Cubist
The Cubist algorithm has the feature that shows the percentage of times where each variable was used in either the rule condition or the linear model. Therefore, using linear combination of the variable usage in the rule conditions and the model, the variable importance can be obtained. This feature can be very useful to make the model less complex and more accurate by discarding the input variables which are not contributing truly toward the outcome (q3(x)). In this work, “varImp” function from Caret package in the R environment was used to extract the variable importance.31 Figure 5 shows the obtained variable importance. As can be seen in the figure, the most significant parameter is the size class label followed by the true density and compaction force. There is almost 30% reduction in the variable importance between compaction force and the remaining parameters, suggesting less contribution of those parameters on q3(x) within the design space. These results are also consistent with the obtained results from the MLR model. Based on the obtained results, different input vectors were chosen to develop new Cubist models with less inputs. Models developed without the information of roll width, roll speed, FA and TA speed predicted q3(x) accurately (Table 4, experiments with three and four inputs). Comparison between different input vectors suggests redundancies in the original data set. Therefore, removing them did not influence the accuracy of the model. Moreover, the model with four inputs had better generalization ability when compared to the Cubist model with three inputs; thus, this model was considered for further analysis.
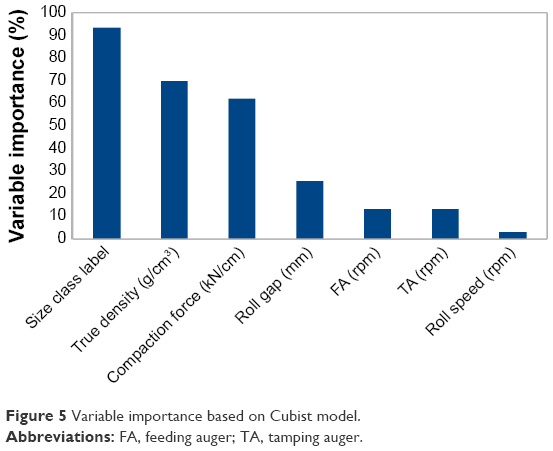 | Figure 5 Variable importance based on Cubist model. |
 | Table 4 Performance of Cubist models based on different inputs |
Effect of parameters on the mean granule size (d50)
As d50 is the most important granule characteristic of granules within the pharmaceutical industry, further analysis was performed to study the effect of each parameter on d50. Figure 6 shows the generalization of Cubist model using four inputs by plotting predicted d50 of granules as a function of different input variables. For the construction of these figures, each of the three process parameters was simultaneously varied, while the remaining parameters were fixed at their midrange values. Figure 6A illustrates the effect of mixture density on d50. As can be seen by varying mixture’s true density, d50 decreases until reaching 1.554 g/cm3 point then increases again by increasing the true density. This phenomenon can be described by using percolation theory that describes the connectivity of a system, such as the interaction between two or more powders or the conductivity of electricity through a material.32 By using percolation theory, sudden change in the connectivity of the system can be described as a percolation threshold. For example, the percolation threshold for an oil and water emulsion would be the concentration at which a phase inversion occurs. In the pharmaceutical industry, this sudden change is a function of concentration, density or pressure. The percolation threshold can be calculated by plotting the line of best fit for two sources of data. If these lines cross each other, sudden change may occur in the system as the concentration, pressure, density, etc. increases. The percolation threshold for the system was determined according to Figure 6A and will occur on 1.554 g/cm3 of true density.1,32 MCC is a plastic material, and thus it is softer, while mannitol is harder due to its brittle attribute. The true density of MCC and mannitol are 1.59 and 1.47 g/cm3, respectively; thus, mixing these two powders creates a mixture with the inherited properties from both of them. The impact of compaction force on the granule size (d50) is depicted in Figure 6B. As expected, increasing the compaction force leads to an increase in granule size (d50). This is due to the fact that increasing compaction forces led to the formation of tougher ribbons with lower porosity which would not easily break to smaller particles; thus, larger granules were produced.33 Figure 6C shows the effect of gap width on granule size (d50). By increasing the gap width, d50 will decrease. As the gap width increases, the constant force applied by the roll has to be transmitted through a thicker layer of powder, and thus the ribbon will have a lower strength and will likely result in smaller, weaker granules following the milling process.34 Figure 7 shows the ability of Cubist model to predict the GSD curve using response surface plot. This figure illustrates the effect of varying compaction force on volume distribution, q3(x). For the construction of this plot, compaction force and size class label were simultaneously varied, while the remaining parameters were fixed at their midrange values. As can be seen in the figure, the first peak that mostly indicates the amount of fines gradually decreases by increasing the compaction force due to the fact that, as mentioned earlier, tougher ribbons are produced.
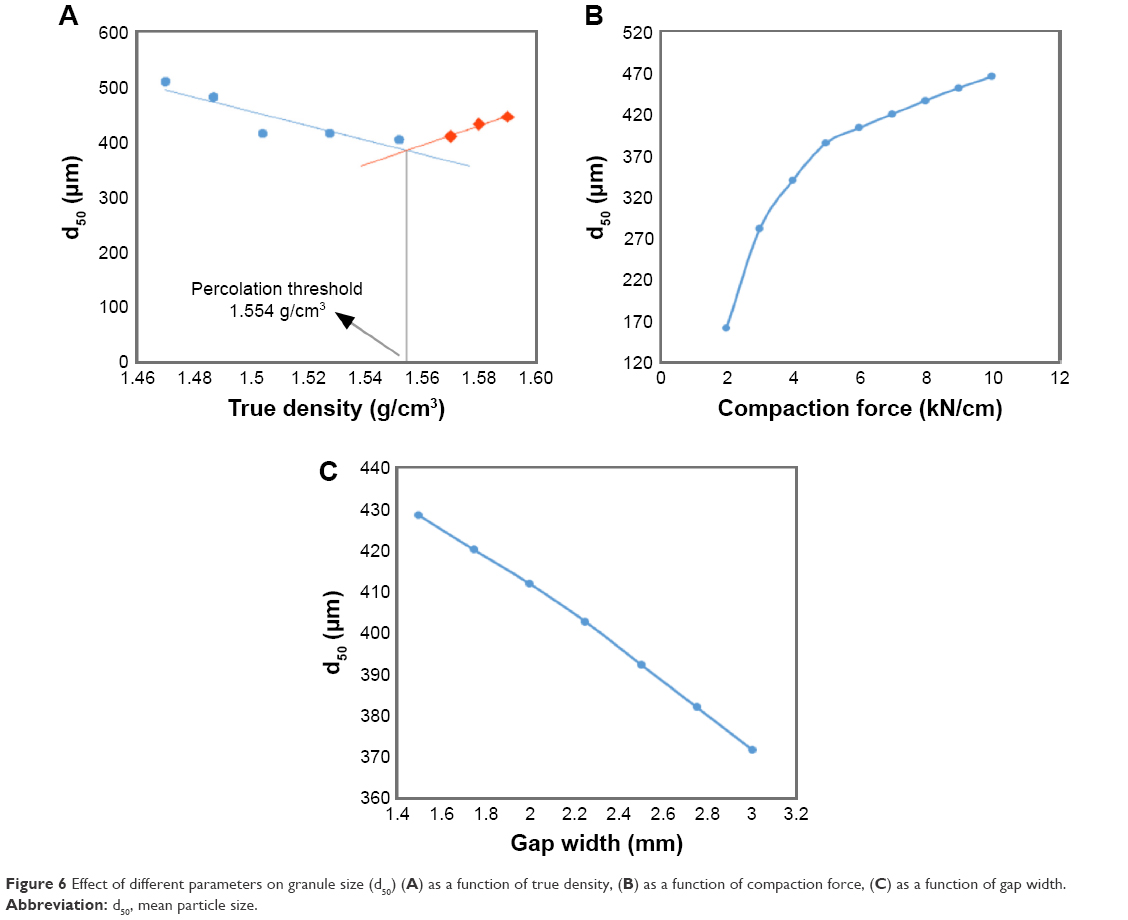 | Figure 6 Effect of different parameters on granule size (d50) (A) as a function of true density, (B) as a function of compaction force, (C) as a function of gap width. |
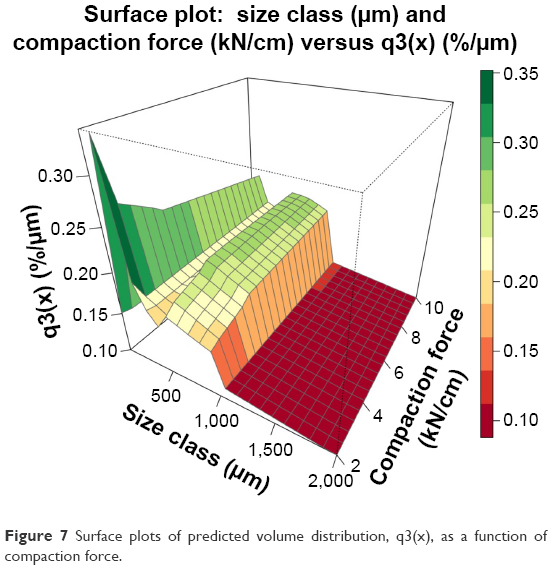 | Figure 7 Surface plots of predicted volume distribution, q3(x), as a function of compaction force. |
Estimation of correlation between parameters was performed by using “cor()” command in the R environment.15 Figure 8 demonstrates the correlation between parameters.
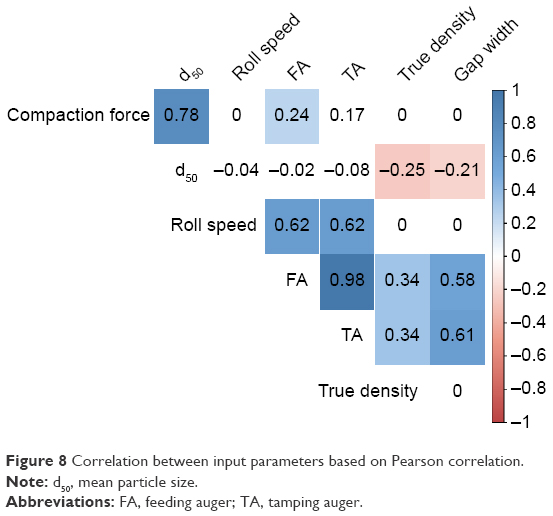 | Figure 8 Correlation between input parameters based on Pearson correlation. |
From Figure 8, it can be seen that the most significant correlation exists between FA and TA speed. This is due to the fact there is a fixed ratio of 1:3.5 between them, and the control system alters the speed based on the set gap width. Other high correlation exists between d50 and compaction force, both auger speed (FA and TA) and gap width and both auger speed (FA and TA) and roll speed.
Conclusion
In this study, different CI techniques are presented to predict the GSD, using roll compaction process parameters and material properties. All the models were developed based on the experimental data set. Iterative procedure assisted by sevenfold CV scheme was implemented to find out the best model among thousands. Different parameters such as true density, compaction force, roll speed, gap width, FA speed and TA speed were considered as inputs for the models. However, later it was found that the input vector can be reduced to four inputs. The first phase of study by using MLR method showed that severe nonlinearity exists in the data set suggesting the use of other complex methods. Based on NRMSE, both Cubist and ANN had a better prediction performance compared to the other models. From transparency point of view, Cubist was simple, reliable and easy to interpret compared to the ANN model. The results also revealed that ANN despite having an NRMSE close to Cubist had deficiency to predict small granule sizes. Based on the variable importance obtained from the Cubist model, true density followed by compaction force has the most significant effect on d50. Correlation analysis revealed that the most significant correlation exists between FA and TA speed and between compaction force and d50. The methods used in this study are purely data driven; therefore, most of the statements are confined to the local design space and cannot be considered as general rules.
Acknowledgment
This work was supported by the IPROCOM Marie Curie initial training network and funded through the People Programme (Marie Curie Actions) of the European Union’s Seventh Framework Programme FP7/2007-2013/under REA grant agreement number 316555.
Disclosure
The authors report no conflicts of interest in this work.
References
Pérez Gago A, Kleinebudde P. MCC–mannitol mixtures after roll compaction/dry granulation: percolation thresholds for ribbon microhardness and granule size distribution. Pharm Dev Technol. Epub 2016 Apr 7. | ||
Yu S, Wu C-Y, Adams MJ, et al. The use of positron emission particle tracking (PEPT) to study milling of roll-compacted microcrystalline cellulose ribbons. Powder Technol. 2015;285:74–79. | ||
Samanta AK, Wang L, Ng KY, Heng PWS. Energy-based analysis of cone milling process for the comminution of roller compacted flakes. Int J Pharm. 2014;462(1–2):108–114. | ||
Kazemi P, Khalid MH, Szlek J, et al. Computational intelligence modeling of granule size distribution for oscillating milling. Powder Technol. 2016;301:1252–1258. | ||
Landin M, Rowe RC. Artificial neural networks technology to model, understand, and optimize drug formulations. In: Aguilar J, editor. Formulation Tools for Pharmaceutical Development. Oxford: Woodhead Publishing Ltd; 2013:7–37. | ||
Souihi N, Josefson M, Tajarobi P, Gururajan B, Trygg J. Design space estimation of the roller compaction process. Ind Eng Chem Res. 2013;52(35):12408–12419. | ||
Aksu B, Paradkar A, de Matas M, Özer Ö, Güneri T, York P. A quality by design approach using artificial intelligence techniques to control the critical quality attributes of ramipril tablets manufactured by wet granulation. Pharm Dev Technol. 2013;18(1):236–245. | ||
Takayama K, Takahara J, Fujikawa M, Ichikawa H, Nagai T. Formula optimization based on artificial neural networks in transdermal drug delivery. J Control Release. 1999;62(1–2):161–170. | ||
Aksu B, Paradkar A, de Matas M, Özer Ö, Güneri T, York P. Quality by design approach: application of artificial intelligence techniques of tablets manufactured by direct compression. AAPS PharmSciTech. 2012;13(4):1138–1146. | ||
Khalid MH, Tuszyński PK, Kazemi P, et al. Transparent computational intelligence models for pharmaceutical tableting process. Complex Adapt Syst Model. 2016;4(1):7. | ||
Ibrić S, Djuriš J, Parojčić J, Djurić Z. Artificial neural networks in evaluation and optimization of modified release solid dosage forms. Pharmaceutics. 2012;4(4):531–550. | ||
Rambali B, Baert L, Jans E, Massart D. Influence of the roll compactor parameter settings and the compression pressure on the buccal bio-adhesive tablet properties. Int J Pharm. 2001;220(1–2):129–140. | ||
Weyenberg W, Vermeire A, Vandervoort J, Remon JP, Ludwig A. Effects of roller compaction settings on the preparation of bioadhesive granules and ocular minitablets. Eur J Pharm Biopharm. 2005;59(3):527–536. | ||
Augsburger LL, Hoag SW. Pharmaceutical Dosage Forms: Tablets. Volume 1, Unit Operations and Mechanical Properties. New York, NY: Informa Healthcare USA; 2008. | ||
R Core Team [homepage on the Internet]. R: A Language and Environment for Statistical Computing.Vienna, Austria: The R Foundation for Statistical Computing. Available from: http://www.R-project.org/. Accessed August 10, 2016. | ||
Joo S, Yoon J, Kim J, Lee M, Yoon Y. NOx emissions characteristics of the partially premixed combustion of H2/CO/CH4 syngas using artificial neural networks. Appl Therm Eng. 2015;80:436–444. | ||
Shabanzadeh P, Yusof R, Shameli K. Artificial neural network for modeling the size of silver nanoparticles’ prepared in montmorillonite/starch bionanocomposites. J Ind Eng Chem. 2015;24:42–50. | ||
Cannon AJ [webpage on the Internet]. Monmlp: Monotone Multi-Layer Perceptron Neural Network. Available from: http://cran.r-project.org/web/packages/monmlp/index.html. Accessed August 10, 2016. | ||
Wiśniowska B, Mendyk A, Szlęk J, Kołaczkowski M, Polak S. Enhanced QSAR models for drug-triggered inhibition of the main cardiac ion currents. J Appl Toxicol. 2015;35(9):1030–1039. | ||
Quinlan JR. Learning with continuous classes. Mach Learn. 1992;22:343–348. | ||
Singh G, Sachdeva SN, Pal M. M5 model tree based predictive modeling of road accidents on non-urban sections of highways in India. Accid Anal Prev. 2016;96:108–117. | ||
Witten HI, Frank E. Data Mining : Practical Machine Learning Tools and Techniques with Java Implementations. Burlington, MA: Morgan Kaufmann; 2000. | ||
Kuhn M, Weston S, Keefer C, Coulter N [webpage on the Internet]. C code for Cubist by Ross Quinlan.Cubist: Rule- and Instance-Based Regression Modeling.R Package Version 0.0.18. Available from: http://CRAN.R-project.org/package=Cubist. Accessed August 10, 2016. | ||
Breiman L. Random forests. Mach Learn. 2001;45(1):5–32. | ||
Ghaedi M, Ghaedi AM, Negintaji E, Ansari A, Vafaei A, Rajabi M. Random forest model for removal of bromophenol blue using activated carbon obtained from Astragalus bisulcatus tree. J Ind Eng Chem. 2014;20(4):1793–1803. | ||
Miraboutalebi SM, Kazemi P, Bahrami P. Fatty acid methyl ester (FAME) composition used for estimation of biodiesel cetane number employing random forest and artificial neural networks: a new approach. Fuel. 2016;166:143–151. | ||
Liaw A, Wiener M. Classification and regression by randomForest. R News. 2002;2(3):18–22. | ||
Mendyk A, Szlęk J, Pacławski A, Lau R, Jachowicz R. Empirical modeling of the fine particle fraction for carrier-based pulmonary delivery formulations. Int J Nanomedicine. 2015;10(1):801. | ||
Yang L, Liu S, Tsoka S, Papageorgiou LG. Mathematical programming for piecewise linear regression analysis. Expert Syst Appl. 2016;44:156–167. | ||
Shen L, Cao D, Xu Q, Huang X, Xiao N, Liang Y. A novel local manifold-ranking based K-NN for modeling the regression between bioactivity and molecular descriptors. Chemom Intell Lab Syst. 2016;151:71–77. | ||
Kuhn M [webpage on the Internet]. Caret: Classification and Regression Training. Available from: https://cran.r-project.org/web/packages/caret/index.html. Accessed August 10, 2016. | ||
Boersen N, Carvajal MT, Morris KR, Peck GE, Pinal R. The influence of API concentration on the roller compaction process: modeling and prediction of the post compacted ribbon, granule and tablet properties using multivariate data analysis. Drug Dev Ind Pharm. 2015;41(9):1470–1478. | ||
Samanta AK, Ng KY, Heng PWS. Cone milling of compacted flakes: process parameter selection by adopting the minimal fines approach. Int J Pharm. 2012;422(1–2):17–23. | ||
Freeman T, Vom Bey H, Hanish M, Brockbank K, Armstrong B. The influence of roller compaction processing variables on the rheological properties of granules. Asian J Pharm Sci. 2016;11(4):516–527. |
 © 2017 The Author(s). This work is published and licensed by Dove Medical Press Limited. The
full terms of this license are available at https://www.dovepress.com/terms
and incorporate the Creative Commons Attribution
- Non Commercial (unported, 3.0) License.
By accessing the work you hereby accept the Terms. Non-commercial uses of the work are permitted
without any further permission from Dove Medical Press Limited, provided the work is properly
attributed. For permission for commercial use of this work, please see paragraphs 4.2 and 5 of our Terms.
© 2017 The Author(s). This work is published and licensed by Dove Medical Press Limited. The
full terms of this license are available at https://www.dovepress.com/terms
and incorporate the Creative Commons Attribution
- Non Commercial (unported, 3.0) License.
By accessing the work you hereby accept the Terms. Non-commercial uses of the work are permitted
without any further permission from Dove Medical Press Limited, provided the work is properly
attributed. For permission for commercial use of this work, please see paragraphs 4.2 and 5 of our Terms.