")
Back to Journals » ClinicoEconomics and Outcomes Research » Volume 14
Effect of Primary Health Care Expenditure on Universal Health Coverage: Evidence from Sub-Saharan Africa
Authors Arhin K , Frimpong AO, Acheampong K
Received 2 July 2022
Accepted for publication 18 September 2022
Published 6 October 2022 Volume 2022:14 Pages 643—652
DOI https://doi.org/10.2147/CEOR.S380900
Checked for plagiarism Yes
Review by Single anonymous peer review
Peer reviewer comments 3
Editor who approved publication: Dr Samer Hamidi
Kwadwo Arhin,1 Albert Opoku Frimpong,2 Kwame Acheampong3
1Department of Economics, Ghana Institute of Management and Public Administration, Accra, Ghana; 2Department of Banking and Finance, University of Professional Studies, Accra, Ghana; 3Department of Accounting Studies Education, Akenten Appiah-Menkah University of Skills Training and Entrepreneurial Development, Kumasi, Ghana
Correspondence: Kwadwo Arhin, Department of Economics, Ghana Institute of Management and Public Administration, Accra, Ghana, Tel +233 246767908, Email [email protected]
Background: Investment in primary health care (PHC) to achieve universal health coverage (UHC) and better health outcomes remains a key global health agenda. This study aimed to assess the effects of PHC spending on UHC and health outcomes.
Methods: The study used the Grossman Health Production Model and conducted econometric analyses using panel data from 2016 to 2019 covering 34 countries in SSA. Fixed and random effects panel regression models were used for the analyses. All the analyses in this study were carried out using the statistical software package STATA Version 15.
Results: We found that PHC expenditure has a positive significant but inelastic effect on UHC and life expectancy at birth and a negative effect on infant mortality. Both the fixed and random effects models provided a robust relationship between PHC expenditure and UHC and health outcomes. Education, access to an improved water source, and the age structure of the population were found to be strongly associated with health outcomes.
Conclusion: The inelastic nature of the PHC expenditure means that the UHC goal might only be achieved at high levels of PHC expenditure. This implies that policymakers must make conscious effort to increase PHC expenditure to ensure the attainment of the UHC goal.
Keywords: primary health care expenditure, universal health coverage, health outcomes, fixed effects, random effects, sub-Saharan Africa
Background
Health is a major determinant of workers’ productivity, human economic welfare, economic growth, and development of every nation.1,2 According to the neoclassical endogenous growth model, good health improves human capital which has a positive effect on workforce productivity in the long run.3 In addition, individuals derive utility from good health.4 Good health increases their returns from investments in productive activities.5 The need to ensure health for all is duly recognized by the Sustainable Development Goal 3.8: universal health coverage (UHC) which assures all persons to have access to quality essential health care services without suffering from financial hardship. World leaders have demonstrated their commitment at several fora to invest in primary health care (PHC) towards achieving UHC, healthier populations, and health security to ensure that all people, rich or poor, would have equitable access to quality health care services without suffering financial hardship.6–8
PHC is defined in the Alma-Ata Declaration as “essential health care based on practical, scientifically sound and socially acceptable methods and technology made universally accessible to individuals and families in the community through their full participation and at a cost that the community and country can afford”.9 PHC remains the core of any well-functioning health system that strives to achieve the goals of better health, equitable access to health services, financial protection, and responsiveness.10,11
Health spending in most countries is geared towards secondary and tertiary care, with large amounts of money spent on expensive medical equipment and medicines that often deliver modest health gains.12 However, it is estimated that up to 90% of all essential health care services can be delivered through PHC, and that investing in PHC could increase global life expectancy by as much as 6.7 years by 2030.13 There is a plethora of evidence that shows that health systems that are built around PHC report lower hospital admissions, better health outcomes at a lower cost, and are more resilient in mitigating the negative impact of economic and health shocks.9,14–16 For instance, Starfield et al noted that a strong PHC system has a positive effect on health service coverage and health outcomes by preventing diseases, advancing equity, and enhancing health security.16 Many developed and developing countries have undertaken health reforms in their quest to achieve the UHC goal.17 Although the pathways to achieving a healthier population, health security, and UHC may vary from country to country, the consensus is that investment intended to establish a strong PHC is the starting point for all.15,18–20
Current improvements in national health accounts, data sources, and methodology have made it possible to extract PHC expenditure from total health expenditure.27 The System Health Account defines PHC expenditure as the summation of three categories of healthcare expenditure: “all expenditures by PHC service providers, expenditures on PHC preventive services, and a proportion of administrative expenditures based on the ratio of PHC services expenditure to non-PHC service expenditure”.12,28 In most SSA countries, PHC expenditures are financed through various forms of taxation, insurance premiums, and direct out-of-pocket payments for PHC services by uninsured persons.
Given the support for PHC and the benefits of PHC in improving UHC and health outcomes, it is imperative to be guided by evidence-informed PHC policies. However, there is limited empirical evidence on the effects of PHC expenditures on UHC and health outcomes. Previous empirical studies have examined the effects of total health expenditures, public health expenditures, and private health expenditures on health outcomes.21–24 However, there is no empirical evidence linking PHC expenditures to UHC and health outcomes. This study seeks to fill this gap.
Methods
The Framework
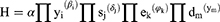
The two main approaches used to study the effect of health expenditure on health outcomes are Grossman’s health production function and human capital models.4,29 The classical production function shows the maximum output that can be produced with a given input(s). The health production function model posits an individual’s health depends on several factors, some of which can be influenced by the individual himself. The model asserts that individuals engage in health-producing activities (such as visits to the physician, COVID-19 shots, x-rays, blood tests, physical exercises, and nutrient intakes) using their own time and other inputs. Therefore, health can be “produced”. According to the model, an individual’s health is influenced by their initial health stock, the level of health care service utilization, and other factors as expressed in Equation [1]:

Where α represents the individual’s initial health stock which is influenced by such factors as genetic makeup and community endowments such as access to clean water; D denotes the individual’s demand for health care services; and X is the vector of other factors which include economic and social variables such as income and education.
Though this theoretical model is designed for the analysis of health production at the micro-level, it can be used at the macro level without losing its theoretical foundation.22,30 At the macro-level analysis, the health production inputs are grouped into economic, social, environmental, and health service utilization variables, which are mostly represented at their per capita levels as given in Equation [2].

where H is a vector of health outcomes per capita; Y is a vector of economic variables per capita; S is vector of social variables per capita; E is vector of environmental variables; and D is a vector of health service utilization variables. The scalar form of Equation [2] can be given as in Equation [3].

where  ;
;  ;
;  ; and
; and  represent the variables in each sub-group, respectively. With the application of calculus, Equation [3] can be transformed in an explicit form by formulating probability density for the y, s, e and d variables as given in Equation [4].
Where β, δ, φ, and γ are elasticities; π is the probability density function; and α denotes the initial health stock in the Grossman (1972) model. Taking the logarithm of Equation [4] yields Equation [5].

where ln is the natural logarithm operator;  denotes the summation of all the variables in each sub-category. In an empirical analysis, the number of variables to be included in each sub-category is determined by the availability of reliable and sufficient data. Based on this principle, we chose PHC expenditure per capita
  and gross domestic product (GDP) per capita
  to represent economic factors; education
  , the proportion of the population aged 65 years and above
 , and proportion of the population aged between 14 and 64 years
  were chosen to represent social factors; environmental variables used were the proportion of the population with access to clean water
  and access to proper sanitation
  , and health care service utilization variable was measles immunization rate among children aged between 12 and 23 months
  .
.
Data and Variables
The study used panel data from 2016 to 2019 on 34 SSA countries. The selection of these 34 countries was based on data availability. The data were obtained from three main sources: World Bank’s World Development Indicators,31 World Health Organization’s Global Health Expenditure Database,32 and United Nations Development Programme.33
We employed three health outcomes – universal health coverage (UHC) index, life expectancy at birth (LEB), and infant mortality rate (IMR). Since the direct measurement of health status has proved to be difficult,34 many researchers use the UHC index, life expectancy at birth, and mortality rates to represent the health status of the population.22,25,30,35,36
The UHC index was computed as a geometric average of two indices, the health service coverage (SC) index and the financial risk protection (FP) index, as recommended by the joint WHO and World Bank monitoring framework.37 The SC index, extracted from the WHO database, combines 14 comparable tracer indicators of health service into a single summary index. These indicators relate to reproductive, maternal, and child health; non-communicable diseases; communicable diseases; and service capacity and access.38 Due to data limitations on catastrophic and impoverishing health expenditures to measure the financial risk protection (FP) index as recommended in the UHC monitoring framework, we followed Jordi et al35 and used the complement of out-of-pocket payment [(1-OOP)/CHE] measured as a share of current health expenditure (CHE) as a proxy for FP index. Thus, the UHC index was constructed in one simple step: a simple geometric average of the SC index extracted from World Health Organization’s database and the FP index generated from out-of-pocket health spending [ie  ].
].
Life expectancy at birth is measured as the average number of years a newborn is expected to live if prevailing patterns of mortality remain the same throughout its life. The infant mortality rate indicates the number of infant (younger than one year) deaths for every 1000 live births. Though the UHC index is considered a preferred measure of population health relative to life expectancy and mortality rates since it is seen to better reflect the population health,39,40 life expectancy at birth and infant mortality rate were also used in the analyses for robustness checks of the results.
We used PHC expenditure per capita at a constant 2000 US$ to measure the level of investment in PHC. The data was sourced from WHO’s Global Health Expenditure Database which provides a comparable health expenditure for all member countries using the System of Health Accounts standards,12 which were jointly developed by WHO, the Organization for Economic Co-operation and Development (OECD), and the United States Agency for International Development.12 Higher PHC per capita is expected to relate to higher UHC index and life expectancy at birth and lower infant mortality. The data sources of all the control variables are reported in Table 1.
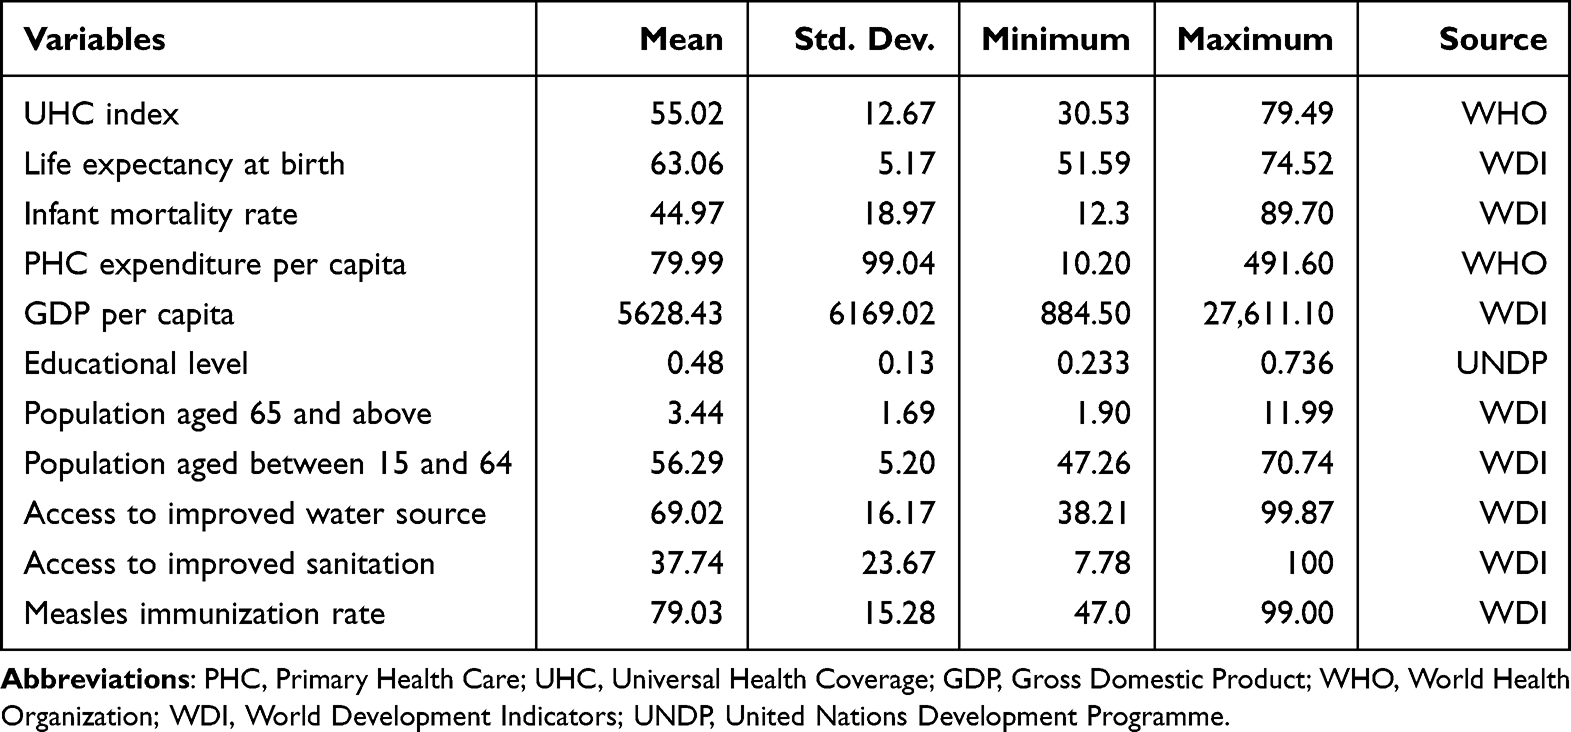 |
Table 1 Descriptive Statistics of the Variables (2016–2019) |
Estimation Techniques
For the econometric estimation of this study, we re-specify Equation [5] in a panel form as follows:

Where  represents the three health outcome variables in the country i at time t and
  is the error term.
We estimated Equation [6] using the pooled least squares (OLS), the generalized least squares (GLS) random effect, and GLS-fixed-effect models. We carried out the Breusch and Pagan Lagrange Multiplier (LM) test to choose between pooled least square (OLS) versus GLS-random/GLS-fixed-effects models.41 Further, we conducted the Hausman test to choose between GLS-random effects and GLS-fixed effects estimators.42 Again, we conducted a White test to identify potential heteroscedasticity problems.43 All the tests and analyses in this study were carried out using the statistical software package of STATA Version 15.
Results of the Study
Descriptive Statistics
The descriptive statistics of the selected health outcome and explanatory variables are presented in Table 1. The average PHC expenditure per capita in SSA was estimated at $80. Seychelles recorded the maximum PHC expenditure per capita ($491.6) and the minimum ($10.2) was recorded in the Democratic Republic of Congo in 2018 (see Figure 1 for the distribution).
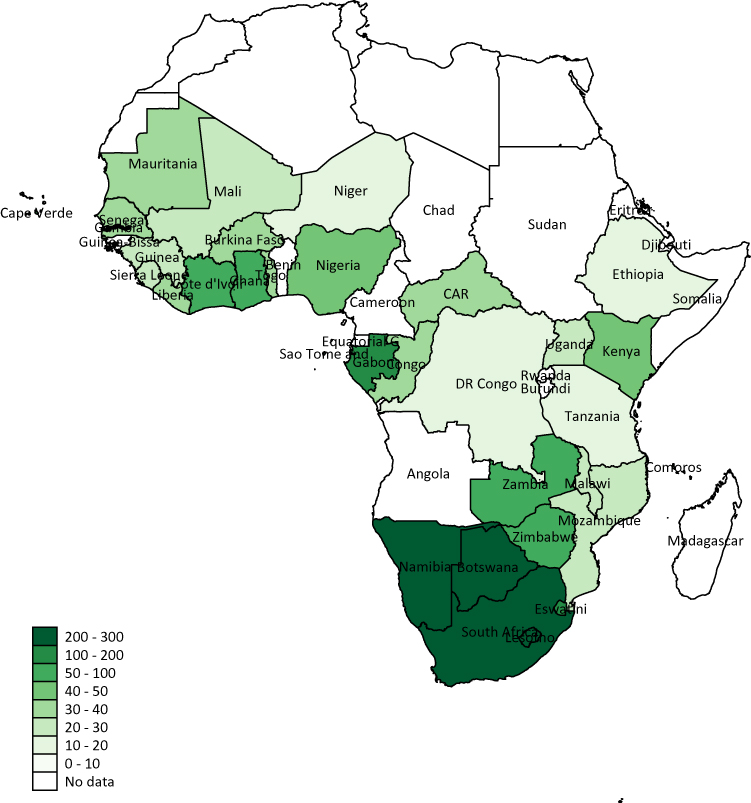 |
Figure 1 Primary Health Care (PHC) expenditure per capita (US$) in SSA – 2016–2019. |
The UHC index ranges from a minimum of 30.53 (in Nigeria) to a maximum of 79.49 (in South Africa) with an average index of 55.02. Life expectancy at birth ranges from a minimum of 51.59 years in the Central Africa Republic to a maximum of 74.52 in Mauritius. However, infant mortality per 1000 live births is the smallest in Seychelles (12.3) and the highest in Sierra Leone (89.7) over the period of the study. The wide distribution of most of these variables suggests that health systems in the SSA region are quite heterogeneous (see Appendix 1 for a detailed descriptive statistics of the outcome variables and PHC expenditure per capita across countries and time).
Further, Table 1 shows that the educational level which is calculated as an index of mean years of schooling and expected years of schooling in each country ranges from a minimum of 0.233 (Niger in 2016) to a maximum of 0.736 (Mauritius in 2019), with an average value of 0.48. Population aged 65 plus and those within the age bracket of 15–65 averaged 3% and 56%, respectively. Approximately 69% and 38% of the population had access to improved water sources and improved sanitation facilities, respectively. On average, measles immunization rate among children between the ages of 12 to 23 months was 79±15%.
Model Estimates
The Breusch and Pagan Lagrange Multiplier (LM) test favored the GLS specifications for all the three models. Though the Hausman test results favored the GLS-fixed effects, we reported both the GLS-fixed (Table 2) and GLS-random effect (Table 3) models for comparison and robustness checks purposes. Nonetheless, the interpretation and discussion of the results focus on the results of the fixed effect model. The robust standard errors were used for both fixed and random effect models to correct for any potential heteroscedasticity problem.43 From Table 2, the results of the R-squared indicate that approximately 51%, 78%, and 75% of the variations in the UHC index, life expectancy at birth, and infant mortality rate, respectively, were due to variations in the explanatory variables used in the study. Further, the significance of the F-statistics suggests that the models better fit the dataset used in the empirical analyses in this study. Since the models are log-log models, the coefficients represent the elasticities of the health outcome (dependent) variables with respect to the explanatory variables.
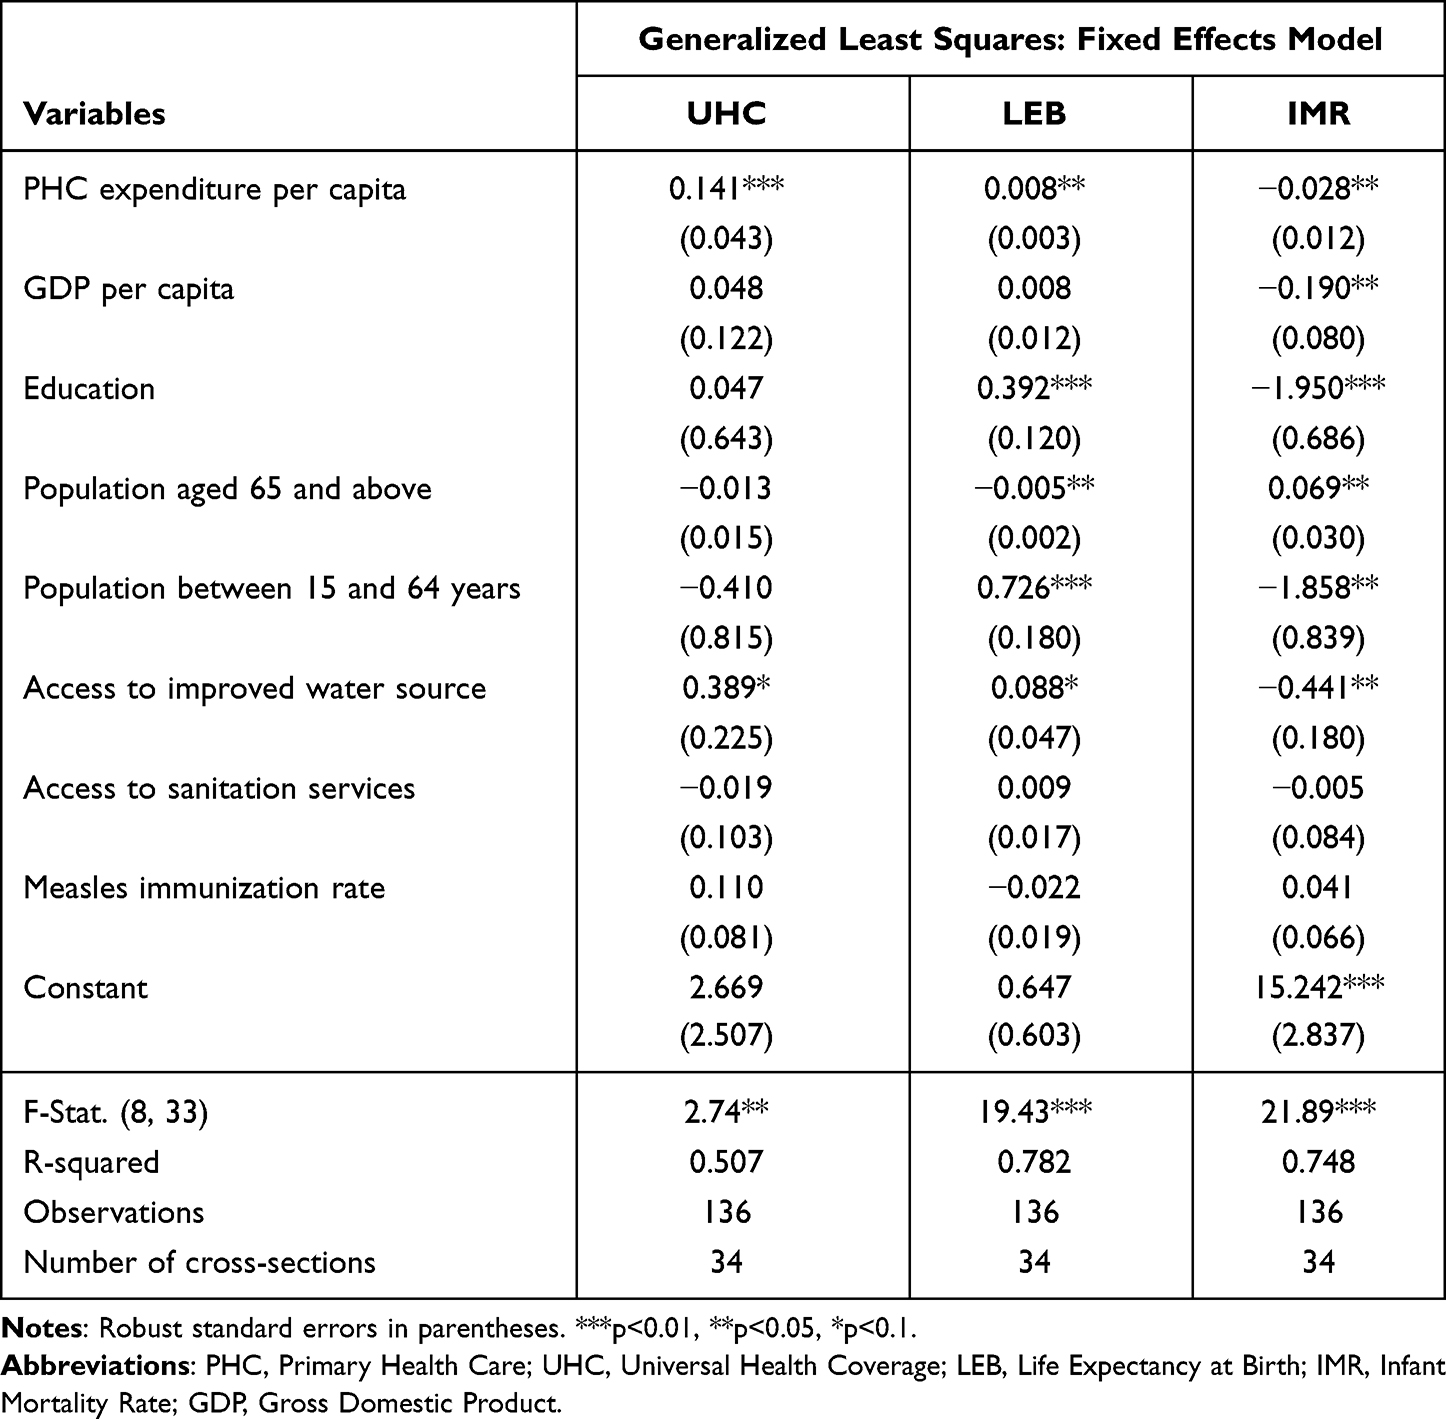 |
Table 2 The Effect of Primary Health Expenditure on UHC and Health Outcomes (Fixed Effect) |
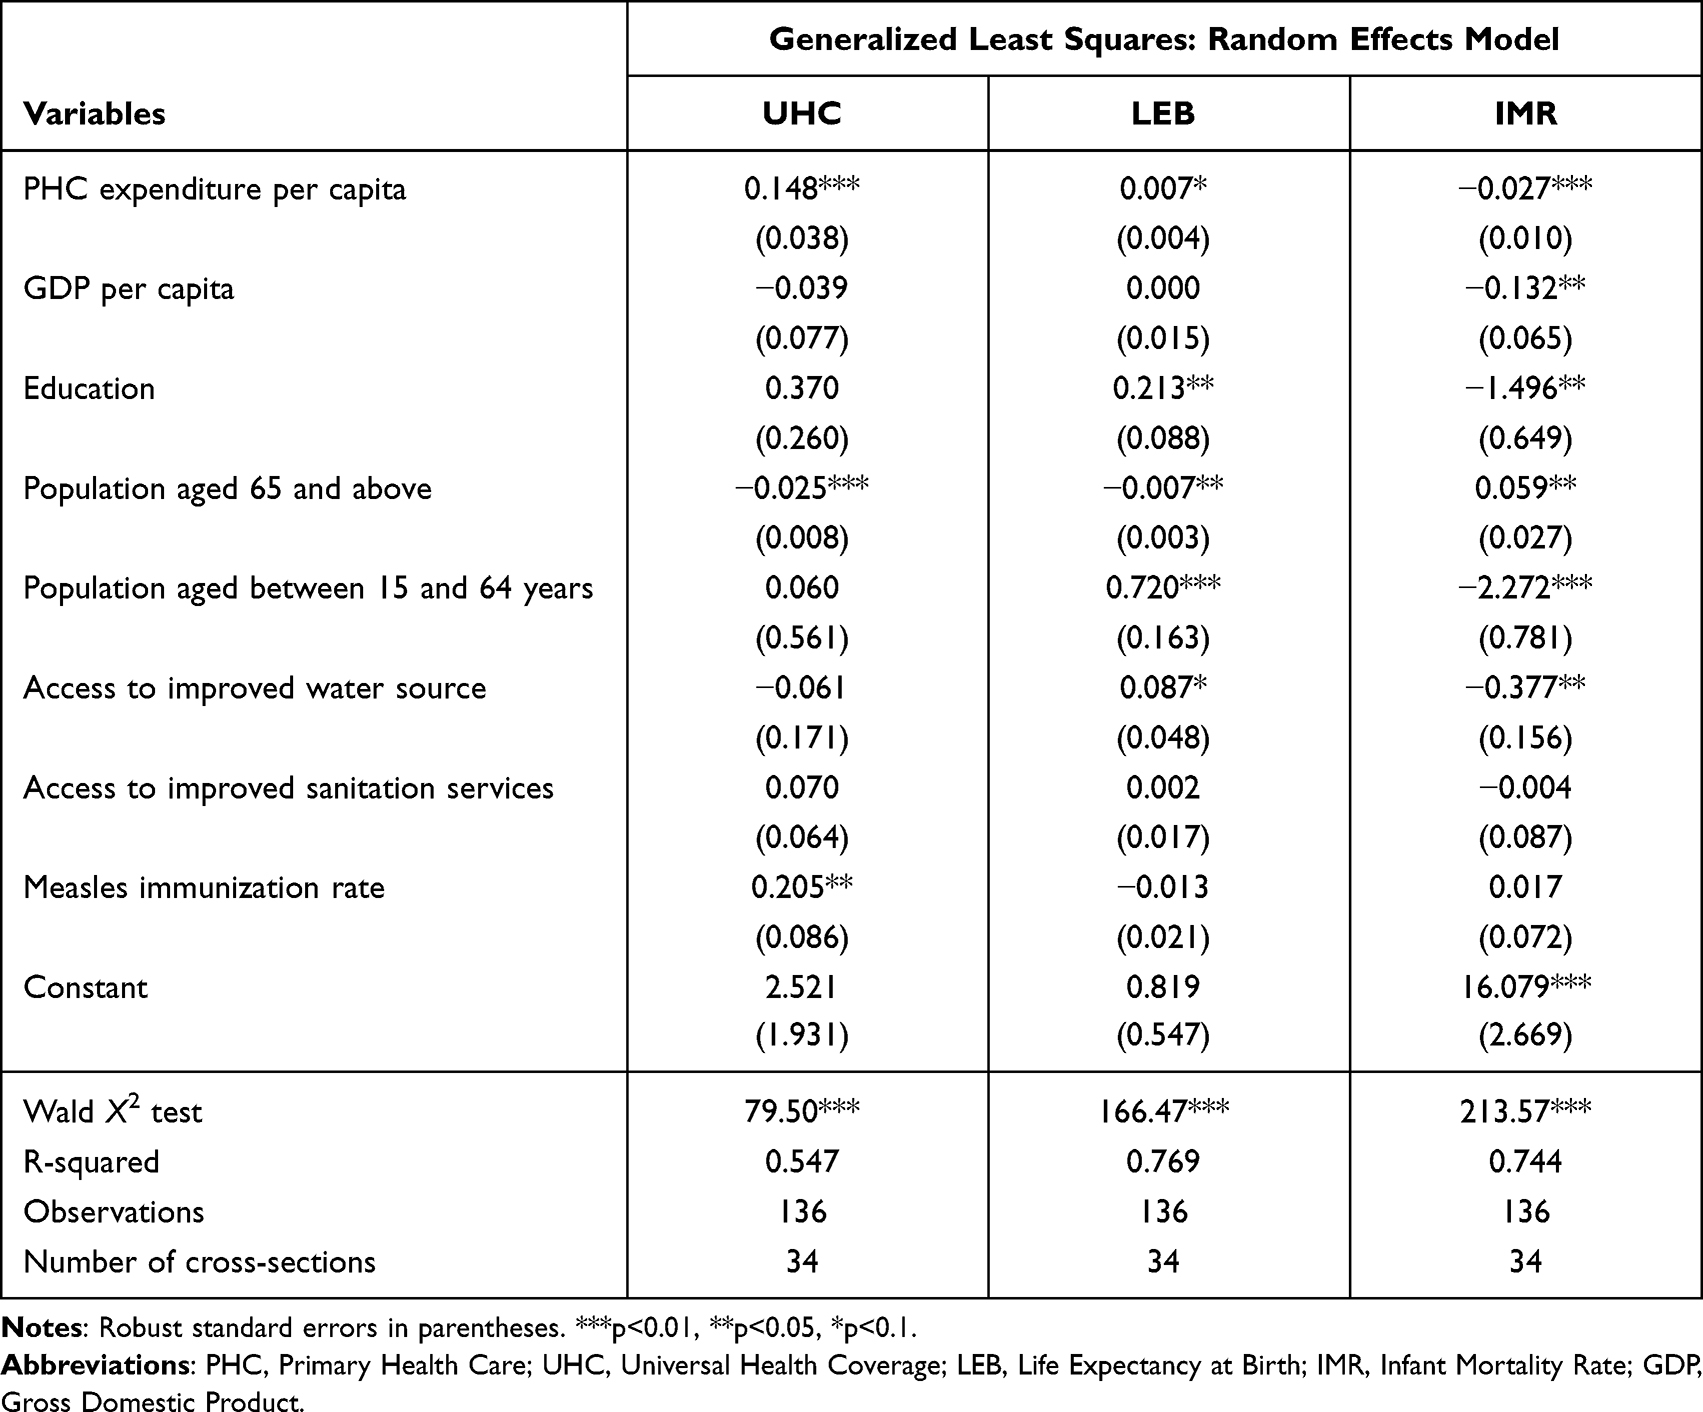 |
Table 3 The Effect of Primary Health Expenditure on UHC and Health Outcomes (Random Effects) |
Primary Health Care (PHC) Expenditure and Universal Health Coverage (UHC)
Tables 2 and 3 report the results of the fixed effects and random effects models, respectively, for all the three health outcomes. The results show that an increase in PHC expenditure improves the UHC index at a 1% significance level. Specifically, a 1% increase in PHC expenditure per capita leads to an improvement in the UHC index by approximately 0.14. The findings of the study suggest that increasing investment in the primary health care sector remains an important step towards achieving the UHC in SSA.
Primary Health Care Expenditure and Life Expectancy at Birth
Again, Tables 2 and 3 show that an increase in PHC expenditure was more likely to increase life expectancy at birth, albeit marginally and at a significance level of 5% in the fixed effects model and 10% in the random effects model. This implies that the elasticity of PHC spending with respect to life expectancy at birth over the period covered by the study was 0.008. Though this value in absolute terms is lower, it conforms to the findings of previous studies that health care expenditure is a major determinant of life expectancy at birth.21–23,25 For example, Arthur and Oaikhenan found the elasticity of total health expenditure with respect to life expectancy at birth to be 0.015 with a similar level of statistical significance.22
Primary Health Care Expenditure and Infant Mortality Rate
The findings suggest that primary health expenditure was more likely to reduce infant mortality rate with a 1% level of significance (Table 2). Specifically, an increase in PHC expenditure by 1% reduced the infant mortality rate by approximately 0.03% for both fixed effects and random effects models. In other words, the elasticity of PHC expenditure with respect to infant mortality rate was estimated at 0.03 in sub-Saharan Africa (SSA).
This result was expected as PHC expenditures are more geared towards reproductive, maternal, and child health services. These results are also consistent with the findings of previous studies which also found health expenditure to be a major determinant of infant mortality rate.21–24 For instance, Bein et al found a significant negative relationship between health spending and infant mortality in SSA.24 However, Filmer and Pritchett found no statistically significant relationship between these two variables.26
In addition, the results from both the random and fixed effects models show a significant negative effect of GDP per capita on the infant mortality rate, suggesting the importance of income in improving the health outcomes of infants. Specifically, a 1% increase in GDP per capita reduces infant mortality rate by 0.19%. Education and access to improved water also play significant role in reducing infant mortality in SSA. From Table 2, a 1% increase in educational level and access to improved water source leads to a 1.95% and a 0.44%, respectively, reductions in infant mortality rates.
Discussions of the Results
Evidence shows that investments in PHC systems have the potential to improve health service coverage and health outcomes by preventing diseases, advancing equity, and enhancing health security. The aim of this study was to examine the effect of PHC expenditure on UHC, life expectancy at birth, and infant mortality rate in SSA using the Grossman’s (2000) health production theoretical model. The empirical model was estimated using fixed and random effects models.
The results indicate that PHC expenditure has a significant, but inelastic, effect on improving UHC and life expectancy at birth and reduction in infant mortality rate. These findings from the results conform to both a priori expectations and the findings of previous studies.4,21,22,44 The inelastic effect of health spending on all the health outcome indicators used in this study may be an indication of the existence of categories of health spending which creates a different magnitude of impact on different health outcomes.21 This calls for more studies to illuminate our understanding. Another possible reason is that different health outcomes are influenced by different factors that are external to the healthcare system such as education and income, particularly in low-income settings.44 This study confirms this assertion. For instance, the elasticity of education with respect to life expectancy at birth and infant mortality rate are 0.392 and −1.95, respectively, at a 1% significance level but shows no such statistically significant association with UHC (see Table 2). Besides education, access to improved water, and proportion of the population between ages of 15 and 64, and those aged above 65 years have significant effects on life expectancy at birth. While access to improved water source and proportion of the population between ages 15 and 64 positively influence life expectancy at birth, proportion of the population aged above 65 exert negative impact on same.
One limitation in this study is that there are not enough time series observations for PHC expenditure per capita for SSA countries, which otherwise would have improved the panel data analyses. The proxies used to measure the health outcomes, particularly life expectancy at birth and infant mortality rate were not able to capture information on morbidity and disability. However, the inclusion of the three different health outcome variables was enough to allow for robustness results. Though these limitations may serve as the bases for future research, they do not in any way render the results of this study invalid.
Conclusion and Policy Implications
The policy implications from the findings of the study include the need for governments in SSA to increase investment in PHC sector since it is an essential component in improving UHC and health outcomes. The inelastic nature of PHC expenditure means that the UHC goal might only be achieved at high levels of PHC expenditure. This implies that policy makers must make conscious effort to increase PHC expenditure to ensure the attainment of the UHC goal.
Again, the results suggest that PHC expenditure is but one component in the larger health care system. The findings suggest that socioeconomic and environmental factors such as education, access to improved water source, and income are important determinants of health outcomes. Thus, if the health system policy goals are to achieve UHC in 2030 and improve the health status of the population, then the socioeconomic and environmental factors such as education and income levels must attract the attention of policy makers. Policies that strengthen the quality of education systems and improve access to basic social amenities such as clean water need to engage the attention of governments and other stakeholders of the health sector.
Data Sharing Statement
The dataset used in this study was extracted from WHO’s Global Health Expenditure Database (GHED) and World Bank’s World Development Indicators (WDI). All are publicly available.
Consent for Publication
All the authors have given their consent for the publication of this paper.
Funding
No external funding was received. It was funded by the authors themselves.
Disclosure
None of the authors of this paper has any competing interest. We, therefore report no conflicts of interest in relation to this work.
References
1. Eggoh J, Sossou GA, Houeninvo H. Education, health AND economic growth in African Countries. J Econ Dev. 2015;40(1):93–111. doi:10.35866/caujed.2015.40.1.004
2. Acheampong K. The interaction effect of foreign capital inflows and financial development on economic welfare in sub-Saharan Africa. Financ Innov. 2019;5:1. doi:10.1186/s40854-019-0139-z
3. Romer D. Advanced Macroeconomics. New York Mcgraw Hill: Irwin; 2019.
4. Grossman M. On the concept of health capital and the demand for health. J Polit Econ. 1972;80(2):223–255. doi:10.1086/259880
5. Alam K, Mahal A. Economic impacts of health shocks on households in low and middle income countries: a review of the literature. Global Health. 2014;10(1):21. doi:10.1186/1744-8603-10-21
6. Philimon G. Primary health care investment is the 3-for-1 investment that can help us get there. PHCPI; 2022. Available from: https://improvingphc.org/blog/2022/05/23/primary-health-care-investment-3-1-investment-can-help-us-get-there.
7. World Health Organization. Declaration of Astana; 2018. Available from: https://www.who.int/docs/default-source/primary-health/declaration/gcphc-declaration.pdf.
8. United Nations Development Programme. Sustainable Development Goals (SDGs); 2015. Available from: http://www.undp.org/content/undp/en/home/mdgoverview/post-2015-development-agenda.
9. World Health Organization. Alma-Ata Declaration; 1978. Available from: https://cdn.who.int/media/docs/default-source/documents/almaata-declaration-en.pdf?sfvrsn=7b3c2167_2.
10. Kruk ME, Porignon D, Rockers PC, Van Lerberghe W. The contribution of primary care to health and health systems in low- and middle-income countries: a critical review of major primary care initiatives. Soc Sci Med. 2010;70(6):904–911. doi:10.1016/j.socscimed.2009.11.025
11. van Weel C, De Maeseneer J. Now more than ever: world health assembly revisits primary health care. Prim Health Care Res Dev. 2009;11(01):1. doi:10.1017/s1463423609990260
12. Organization of Economic Cooperation and Development. A System of Health Accounts. OECD; 2011.
13. World Health Organization. Seventy-Fifth World Health Assembly: Resolutions and Decisions, Annexes. Published May 13, 2022. Available from: https://apps.who.int/gb/ebwha/pdf_files/WHA75/A75_9-en.pdf.
14. Ghebreyesus TA, Fore H, Birtanov Y, Jakab Z. Primary health care for the 21st century, universal health coverage, and the sustainable development goals. Lancet. 2018;392(10156):1371–1372. doi:10.1016/s0140-6736(18)32556-x
15. Balabanova D, Mills A, Conteh L, et al. Good health at low cost 25 years on: lessons for the future of health systems strengthening. Lancet. 2013;381(9883):2118–2133. doi:10.1016/s0140-6736(12)62000-5
16. Starfield B, Shi L, Macinko J. Contribution of primary care to health systems and health. Milbank Q. 2005;83(3):457–502. doi:10.1111/j.1468-0009.2005.00409.x
17. Atim C, Koduah A, Kwon S. How and why do countries make universal health care policies? Interplay of country and global factors. J Glob Health. 2021;11. doi:10.7189/jogh.11.16003
18. Tumusiime P, Kwamie A, Akogun OB, Elongo T, Nabyonga-Orem J. Towards universal health coverage: reforming the neglected district health system in Africa. BMJ Global Health. 2019;4(Suppl 9):e001498. doi:10.1136/bmjgh-2019-001498
19. Lagomarsino G, Garabrant A, Adyas A, Muga R, Otoo N. Moving towards universal health coverage: health insurance reforms in nine developing countries in Africa and Asia. Lancet. 2012;380(9845):933–943. doi:10.1016/s0140-6736(12)61147-7
20. Chen LC. Good health at low cost: from slogan to wicked problem. Lancet. 2012;379(9815):509–510. doi:10.1016/s0140-6736(12)60218-9
21. Houeninvo HG. Effects of health expenditures on infant and child mortality rates: a dynamic panel data analysis of 37 African countries. Afr Dev Rev. 2022;34:255–267. doi:10.1111/1467-8268.12634
22. Arthur E, Oaikhenan HE. The effects of health expenditure on health outcomes in Sub-Saharan Africa (SSA). Afr Dev Rev. 2017;29(3):524–536. doi:10.1111/1467-8268.12287
23. Nketiah-Amponsah E. The Impact of health expenditures on health outcomes in Sub-Saharan Africa. J Dev Soc. 2019;35(1):134–152. doi:10.1177/0169796x19826759
24. Bein MA, Unlucan D, Olowu G, Kalifa W. Healthcare spending and health outcomes: evidence from selected East African countries. Afr Health Sci. 2017;17(1):247. doi:10.4314/ahs.v17i1.30
25. Novignon J, Olakojo SA, Nonvignon J. The effects of public and private health care expenditure on health status in sub-Saharan Africa: new evidence from panel data analysis. Health Econ Rev. 2012;2:1. doi:10.1186/2191-1991-2-22
26. Filmer D, Pritchett L. The impact of public spending on health: does money matter? Soc Sci Med. 1999;49(10):1309–1323. doi:10.1016/s0277-9536(99)00150-1
27. Poullier JP, Hernandez P, Kawabata K, Savedoff WD. Patterns of Global Health Expenditures: Results for 191 Countries. World Health Organization; 2002.
28. Primary Health Care Performance Initiative. Primary health care expenditure per capita ($USD). PHCPI; 2015. Available from: https://improvingphc.org/indicator/primary-health-care-expenditure-capita-usd#?loc=&viz=0ˆfalse.
29. Grossman M. The Human Capital Model of the Demand for Health. National Bureau Of Economic Research; 1999.
30. Fayissa B, Gutema P. Estimating a health production function for Sub-Saharan Africa (SSA). Appl Econ. 2005;37(2):155–164. doi:10.1080/00036840412331313521
31. The World Bank. World development indicators dataBank. World bank; 2022. Available from: https://databank.worldbank.org/source/world-development-indicators.
32. World Health Organization. Global health expenditure database; 2022. Available from: https://apps.who.int/nha/database.
33. United Nations. Human development index; 2022. Available from: https://hdr.undp.org/data-center/human-development-index#/indicies/HDI.
34. Burgard SA, Chen PV. Challenges of health measurement in studies of health disparities. Soc Sci Med. 2014;106:143–150. doi:10.1016/j.socscimed.2014.01.045
35. Jordi E, Pley C, Jowett M, Abou Jaoude GJ, Haghparast-Bidgoli H. Assessing the efficiency of countries in making progress towards universal health coverage: a data envelopment analysis of 172 countries. BMJ Global Health. 2020;5(10):e002992. doi:10.1136/bmjgh-2020-002992
36. Ranabhat CL, Jakovljevic M, Dhimal M, Kim CB. Structural factors responsible for universal health coverage in low- and middle-income countries: results from 118 countries. Public Health Front. 2020;7. doi:10.3389/fpubh.2019.00414
37. Boerma T, AbouZahr C, Evans D, Evans T. Monitoring intervention coverage in the context of universal health coverage. PLoS Med. 2014;11(9):e1001728. doi:10.1371/journal.pmed.1001728
38. Hogan DR, Stevens GA, Hosseinpoor AR, Boerma T. Monitoring universal health coverage within the sustainable development goals: development and baseline data for an index of essential health services. Lancet Global Health. 2018;6(2):e152–e168. doi:10.1016/s2214-109x(17)30472-2
39. Cylus J, Papanicolas I, Smith PC. Using data envelopment analysis to address the challenges of comparing health system efficiency. Global Policy. 2015;8:60–68. doi:10.1111/1758-5899.12212
40. Hadad S, Hadad Y, Simon-Tuval T. Determinants of healthcare system’s efficiency in OECD countries. Eur J Health Econ. 2011;14(2):253–265. doi:10.1007/s10198-011-0366-3
41. Breusch TS, Pagan AR. The lagrange multiplier test and its applications to model specification in econometrics. Rev Econ Stud. 1980;47(1):239. doi:10.2307/2297111
42. Hausman JA. Specification tests in econometrics. Econometrica. 1978;46(6):1251–1271. doi:10.2307/1913827
43. White H. A heteroskedasticity-consistent covariance matrix estimator and a direct test for heteroskedasticity. Econometrica. 1980;48(4):817. doi:10.2307/1912934
44. Musgrove P. Public and private roles in health: theory and financing patterns. Worldbankorg; 2017. Available from: doi:http://documents.worldbank.org/curated/en/1996/07/4100317/public-private-roles-health-theory-financing-patterns.
 © 2022 The Author(s). This work is published and licensed by Dove Medical Press Limited. The full terms of this license are available at https://www.dovepress.com/terms.php and incorporate the Creative Commons Attribution - Non Commercial (unported, v3.0) License.
By accessing the work you hereby accept the Terms. Non-commercial uses of the work are permitted without any further permission from Dove Medical Press Limited, provided the work is properly attributed. For permission for commercial use of this work, please see paragraphs 4.2 and 5 of our Terms.
© 2022 The Author(s). This work is published and licensed by Dove Medical Press Limited. The full terms of this license are available at https://www.dovepress.com/terms.php and incorporate the Creative Commons Attribution - Non Commercial (unported, v3.0) License.
By accessing the work you hereby accept the Terms. Non-commercial uses of the work are permitted without any further permission from Dove Medical Press Limited, provided the work is properly attributed. For permission for commercial use of this work, please see paragraphs 4.2 and 5 of our Terms.