Back to Journals » Diabetes, Metabolic Syndrome and Obesity » Volume 10
Effect of different doses of statins on the development of type 2 diabetes mellitus in patients with myocardial infarction
Authors Gruzdeva O, Uchasova E ![]() , Dyleva Y
, Dyleva Y ![]() , Akbasheva O
, Akbasheva O ![]() , Karetnikova V, Shilov A, Barbarash O
, Karetnikova V, Shilov A, Barbarash O
Received 18 August 2017
Accepted for publication 3 October 2017
Published 5 December 2017 Volume 2017:10 Pages 481—489
DOI https://doi.org/10.2147/DMSO.S149463
Checked for plagiarism Yes
Review by Single anonymous peer review
Peer reviewer comments 3
Editor who approved publication: Professor Ming-Hui Zou
Olga Gruzdeva,1 Evgenya Uchasova,1 Yulia Dyleva,1 Olga Akbasheva,2 Victoria Karetnikova,1 Aleksandr Shilov,1 Olga Barbarash1
1Federal State Budgetary Institution, Research Institute for Complex Issues of Cardiovascular Diseases, Kemerovo, Russia; 2State Budget Educational Institution of Higher Professional Education, Siberian State Medical University, Russian Federation Ministry of Health, Tomsk, Russia
Background: Cardiovascular diseases and type 2 diabetes mellitus (T2DM) may have common developmental mechanisms associated with lipid metabolism disorders. Dyslipidemia and progression of atherosclerosis in people with T2DM are accompanied by an increase in cardiovascular mortality. This study examined the dose-dependent action of atorvastatin on carbohydrate metabolism and adipokine status in patients within 12 months after myocardial infarction (MI).
Methods: A total of 156 male MI patients who had received atorvastatin 20 mg/day (78 patients) or 40 mg/day (78 patients) starting from day 1 of onset were enrolled. Glucose, insulin, C-peptide, resistin, adiponectin, and ghrelin levels were measured at baseline, day 12, and months 3 and 12. Patients were monitored for new incidences of T2DM for 12 months after MI.
Results: For acute phase MI, patients had moderate insulin resistance, hyperglycemia, and hyperinsulinemia, high leptin and resistin levels, and low ghrelin and adiponectin levels. Atorvastatin 20 mg/day was more effective at correcting the imbalances. Patients taking atorvastatin 40 mg/day (group 2) following MI showed increases in levels of glucose, insulin, and C-peptide and insulin resistance progression after 12 months of therapy, as evidenced by increased quantitative insulin sensitivity check index scores and detection of new T2DM cases.
Conclusion: Atorvastatin improved adipokine profiles and ghrelin levels, with low doses showing more significant effects. Atorvastatin dose prescribed for MI patients should take into account the degree of insulin resistance and adipokine status.
Keywords: statin, myocardial infarction, inflammation, adipokine, resistin
A Letter to the Editor has been received and published for this article.
Introduction
Pathological processes underlying cardiovascular diseases and type 2 diabetes mellitus (T2DM) may have common developmental mechanisms associated with lipid metabolism disorders. Dyslipidemia and progression of atherosclerosis in people with T2DM are accompanied by an increase in cardiovascular mortality.1 In acute coronary syndrome, lipid and carbohydrate metabolism changes and insulin resistance develops, which can often lead to T2DM over time.1
For primary and secondary prevention of atherosclerotic complications, the effectiveness of statins (inhibitors of a key enzyme in cholesterol synthesis of 3-hydroxy-3-methylglutaryl-CoA-reductase) has been reported.2,3 A range of therapeutic benefits of statins is attributed to their hypolipidemic, anti-inflammatory, and antithrombotic properties.2 However, data from a large-scale meta-analyses suggest that statin therapy in coronary artery disease is associated with a risk for the development of T2DM.4–6
Among the most discussed mechanisms of the diabetogenic action of statins is their ability to have a negative impact on insulin sensitivity and its secretion by pancreatic β cells.7 The relationship between statin therapy and the incidence of new-onset T2DM, as well as the mechanisms of this phenomenon, are poorly studied.
Regulators of lipid metabolism, among which there are substances that both normalize tissue sensitivity to insulin (adiponectin, ghrelin) and promote insulin resistance occurrence (leptin, resistin), may be significant in the formation of insulin resistance and T2DM.8,9
This study examined the dose-dependent action of atorvastatin on parameters of carbohydrate metabolism and adipokine status of patients within 12 months after myocardial infarction (MI).
Methods
Ethical considerations
The study protocol was approved by the local ethics committee of the Federal State Budgetary Institution Research Institute for Complex Issues of Cardiovascular Diseases and was developed according to WMA Declaration of Helsinki – Ethical Principles for Medical Research Involving Human Subjects, 2000 edition, and the “GCP Principles in the Russian Federation” approved by the Russian Ministry of Health (2003). All patients provided written informed consent.
Study design
Between 2009 and 2010, an open, retrospective, randomized, comparative, controlled three-stage study was conducted by the Municipal Budgetary Healthcare Institution Kemerovo Cardiology Dispensary and Federal State Budgetary Institution Research Institute for Complex Issues of Cardiovascular Diseases. Inclusion criterion was the presence of acute MI with ST-segment elevation, verified according to the Society of Cardiology of Russian Federation (VNOK) criteria (2007) and with patients being hospitalized within the first 24 h after the onset of symptoms. Exclusion criteria were as follows: female gender, presence of T2DM previously diagnosed or newly diagnosed within hospitalization, statin therapy for 1 month before MI, severe diseases affecting prognosis (anemia, kidney and liver failure, cancer, autoimmune diseases, and exacerbation of infectious inflammatory diseases), and long-term treatment with corticosteroids.
The study included 156 men who took atorvastatin beginning on the first day of MI symptoms onset. Among them, 78 took atorvastatin at a dose of 20 mg/day (group 1) and 78 took atorvastatin at a dose of 40 mg/day (group 2). The dose was not increased during the year. The mean age of group 1 was 58 (interquartile range [IQR] 54–63) years. The mean age of group 2 was 59 (IQR 55–65) years. Patients were comparable in terms of the presence of coronary artery disease risk factors such as arterial hypertension and smoking. More than 30% of patients in both groups had a family history of coronary artery disease (Table 1).
 | Table 1 Baseline clinical characteristics of patients Notes: Group 1: atorvastatin at a dose of 20 mg/day. Group 2: atorvastatin at a dose of 40 mg/day. Abbreviations: NS, no statistically significant difference; T2DM, type 2 diabetes mellitus. |
Body mass index (BMI) was calculated using the Quetelet formula as a measure of body mass (kg) to height (m) squared. Group 1 mean BMI was 26.8 (IQR 24.9–27.1) kg/m2 and group 2 mean BMI was 25.3 (IQR 23.9–26.3) kg/m2 (P=0.117).
More than 70% of patients in both groups were diagnosed with Q-wave MI, with posterior localization being dominant. Most patients did not have clinical manifestations of acute heart failure, estimated using the Killip and Kimball (1967)10 classification, on admission and during the hospital period.
In 33% of patients in both groups, rhythm disturbances and cardiac conduction disorders were observed. The groups were not statistically different with regard to frequency of complications from MI during the hospital period. Throughout the observation period and in-hospital treatment (12 days on average), patients in both groups were taking coronary active, antihypertensive, and antithrombotic agents (Table 1).
The control group included 30 participants without cardiovascular diseases, and the members were comparable in age and gender ratio to the enrolled patients.
A structured mathematical model was used to assess insulin resistance levels at days 1 and 12 based on fasting plasma insulin and glucose values and by calculating the quantitative insulin sensitivity check index (QUICKI) score (10) according to the following formula: QUICKI =1/[log(I0) + log(G0)], where I0 is the basal insulinemia (mMU/mL) and G0 is the basal glycemia (mg/dL). Katz et al11 reported that an average QUICKI score of 0.382 (0.378–0.387) corresponds to normal tissue sensitivity to insulin and QUICKI scores of 0.331 (0.328–0.338) and 0.304 (0.299–0.309) correspond to moderate and severe tissue insulin resistance, respectively.
Glucose tolerance test
All patients had their blood glucose levels assessed upon admission. At days 8–14, the patients with fasting or postprandial glucose levels of <11.1 mmol/L were subjected to an oral glucose tolerance test (OGTT) (The WHO recommendation is for a 75 grams of glucose oral dose in all adults. The dose should be drunk within 5 minutes).
New-onset T2DM was diagnosed during the hospital stay based on the repeat glucose test results and OGTT findings; a diagnosis of DM was documented if it was present in the patients’ medical records.12
The diagnosis of diabetes if you put two or more independent determinations (on different days of the glucose level was 7.0≥ mmol/L [126 mg/dL]). In doubtful cases, such as the characteristic clinical picture of diabetes and fasting plasma glucose within 6.6–7.7 mmol/L, OGTT was performed. Diagnosis of T2DM is established as OGTT ≥11.1 mmol/L and glycated hemoglobin ≥6.5% (according to the recommendations of the American Diabetes Association).
Blood sampling and biochemical assays
The serum of each patient was separated from venous blood by centrifugation at 3000× g for 20 min and stored at -70°C. On days 1 and 12 after MI onset, serum glucose levels were measured at the same study time points using standard Thermo Fisher Scientific test systems (Thermo Fisher Scientific, Waltham, MA, USA) in a Konelab 30i biochemistry analyzer (Thermo Fisher Scientific). C-peptide was measured by enzyme-linked immunosorbent assay (ELISA) using a BioMedica laboratory kit (Sydney, NSW, Australia) and insulin levels were measured using a Diagnostic Systems Laboratories laboratory kit (Webster, TX, USA). Intra-assay coefficients of variation (CV) for insulin and C-peptide ELISA were 3.8% and 4.1%, respectively, and inter-assay CV for insulin and C-peptide ELISA were 6.9% and 7.9%, respectively. Adipokine levels for leptin (CV: 7.03–8.99%), adiponectin (CV: 3.3–5.0%), and resistin (CV: 2.3–4.0%) and ghrelin levels (CV: 2.3–4.1%) were measured using BioVendor assay kits (Brno, Czech Republic).
Statistical analysis
Statistical analysis was performed using Statistica 6.1 software (InstallShield Software Corp., Chicago, IL, USA). Results are presented as median (Me) and 25% and 75% quartiles, Me (Q1;Q3). Statistical analyses were performed using the nonparametric Mann–Whitney test for unpaired samples and the Wilcoxon test for paired samples.
Results
Patients with MI on day 1 of the disease showed a moderate degree of insulin resistance, with the QUICKI score being lower on average by 19.07% and glucose, insulin, and C-peptide levels being correspondingly higher by 23, 34, and 22%, respectively, compared to indicators of healthy individuals (Table 2).
 | Table 2 Dynamics of insulin resistance markers in patients with myocardial infarction during therapy with atorvastatin Notes: Group 1: atorvastatin at a dose of 20 mg/day. Group 2: atorvastatin at a dose of 40 mg/day. Results are presented as median (Me) and 25% and 75% quartiles: Me (Q1;Q3). Numbers 1–9 shown in parentheses in the column headings correspond with the subscript numbers 1–9 shown next to the P-values. Abbreviation: QUICKI, quantitative insulin sensitivity check index. |
Application of atorvastatin at a dose of 20 mg/day within 12 months after MI was observed to be consistently associated with a reduction in insulin resistance degree, with the QUICKI score at month 12 of therapy having increased by 21% compared to day 1, and corresponding to the normal value.
Decreases in levels of glucose (by 16.1%), insulin (by 9.3%), and C-peptide (by 2.3%) also indicated a reduction in insulin resistance degree at day 12 after onset in patients taking 20 mg/day of atorvastatin.
By month 3 of treatment, patients in group 1 showed statistically substantial decreases in insulin concentration (by 21.23%) and C-peptide (by 10.648%) compared with day 1. After 12 months of treatment, insulin and C-peptide levels did not statistically differ from parameters of healthy individuals, though values did not change compared to month 3 (Table 2).
When compared with group 1 (20 mg/day atorvastatin), group 2 (40 mg/day) showed a reduction in QUICKI score of up to 0.301 at month 12, indicating the development of severe insulin resistance. Glucose, insulin, and C-peptide levels had increased at the same time point. At month 12 after MI, glucose, insulin, and C-peptide levels had exceeded reference values by 1.16-, 1.32-, and 1.31-fold, respectively. It should be noted that, at the same time point, the glucose level was 16% higher and the insulin level was 32% higher in group 2 compared with group 1 (Table 2). Long-term treatment with atorvastatin (20 mg/day) did not significantly affect postprandial glucose, insulin, and C-peptide levels, with changes being within reference ranges.
At month 12, patients on 40 mg/day atorvastatin showed postprandial hyperglycemia with a 1.53-fold increase in glucose levels compared to baseline and a 1.66-fold increase compared to the control group. Hyperglycemia was accompanied by an increase in insulin levels, with levels being lowest after 12 months of treatment (Table 2).
Changes in basal and postprandial levels of glucose, insulin, and C-peptide observed in group 2 corresponded to changes observed in insulin resistance and T2DM. During the 12-month study, the incidence of T2DM onset in patients taking 40 mg/day atorvastatin (group 2) was observed in eight patients (20.5%). The incidence of T2DM in patients taking 20 mg/day atorvastatin (group 1) was observed in one patient (2.6%).
At day 1 after MI, patients in both group 1 and group 2 showed low levels of adiponectin and ghrelin (on average 1.5- and 3.34-fold below normal values, respectively) and high levels of leptin and resistin (on average 2.23- and 1.37-fold higher than the control group, respectively).
In group 1 (20 mg/day) at month 12, leptin decreased by 60.18% compared with day 1, with the value being not substantially different from the control group (Table 3). This group also showed a 1.58-fold increase in adiponectin at month 12 (Table 3), with the value being not substantially different from the control group. Ghrelin showed a 2.32-fold increase at month 12 compared with baseline in group 1, but did not reach the same level as the control group (on average it was lower by 30.97%).
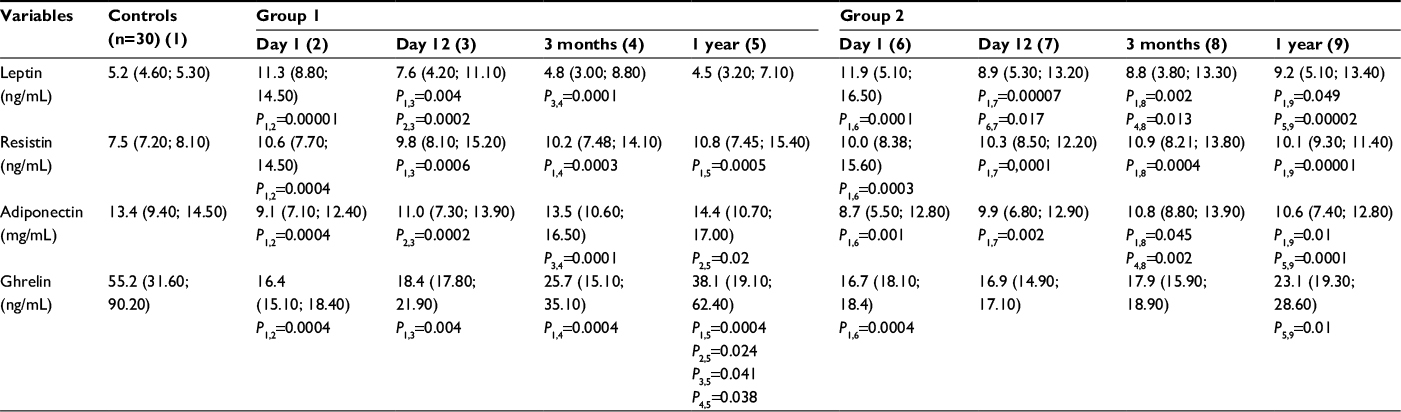 | Table 3 Dynamics of indicators of adipokine status in patients with myocardial infarction during treatment with atorvastatin Notes: Group 1: atorvastatin at a dose of 20 mg/day. Group 2: atorvastatin at a dose of 40 mg/day. Results are presented as median (Me) and 25% and 75% quartiles: Me (Q1;Q3). Numbers 1–9 shown in parentheses in the column headings correspond with the subscript numbers 1–9 shown next to the P-values. |
The effect of 40 mg/day atorvastatin on adipokine status and ghrelin level was less pronounced. At month 12 after treatment, leptin content in group 2 decreased by only 23% compared with baseline and remained higher than the control group and group 1 (on average 1.8- and 2-fold, respectively). There were no substantial increases in adiponectin and ghrelin in group 2 (Table 3). At month 12, adiponectin increased by 21.8% and ghrelin increased by 38.3%.
Group 2 indicators were lower than group 1, with adiponectin being 1.36-fold lower and ghrelin being 1.65-fold lower.
Atorvastatin at the studied dosages had no substantial impact on resistin level over the follow-up period. Concentrations remained high both during in-hospital and during posthospital periods.
Patients taking atorvastatin 40 mg/day (group 2) following MI showed increases in levels of glucose, insulin, and C-peptide and insulin resistance progression after 12 months of therapy, as evidenced by increased QUICKI scores and detection of new T2DM cases.
Discussion
Statins have been widely used in cardiology practice for >20 years. Initially, statins were used solely as hypercholesterolemic agents. With their mode of action being the inhibition of a key enzyme in cholesterol synthesis, statins eliminate the main cause of atherosclerosis progression and effectively reduce the incidence of cardiovascular complications.13,14
In recent years, there has been an increase in reports in the literature on cases of people taking statins who develop T2DM.5,15,16 In one of the largest meta-analyses, which included 91,140 participants and 13 clinical trials, the authors concluded that statin therapy was accompanied by a significant increase in the incidence of new-onset T2DM (odds ratio: 1.09, 95% confidence interval: 1.02–1.17).17 The results of some large controlled clinical trials suggest that the risk for T2DM while on statins may be dose dependent.15 In the current study, we observed that T2DM onset occurred more in patients taking 40 mg/day atorvastatin (eight of 39 patients), while only one case of T2DM was identified among the 39 patients taking 20 mg/day atorvastatin. After 12 months of treatment, patients in group 2 (40 mg/day) showed increases in basal levels of glucose and insulin in blood serum and decreases in QUICKI scores, which are typical of severe insulin resistance (Table 2).
Insulin resistance development can be associated with suppression of insulin signaling while taking atorvastatin. This medication, because of its hydrophobicity, can easily penetrate cells and inhibit synthesis of geranyl-pyrophosphate via competition with 3-hydroxy-3-methyl-glutaryl-coenzyme A reductase. This leads to dysfunction of transport proteins Ras homolog gene family, member A, and RAB4 and impairment of overall insulin signaling, including insulin resistance S-1 and protein kinase B; as a result, glucose transporter type 4 translocation is weakened.15 Statins are also able to inhibit the activity of regulatory subunit p85 of phosphoinositol-3-kinase (which is a part of the signal pathway), which stimulates glucose transporter type 4 translocation from the cytosol to the plasma membrane and transmembrane transport of glucose into muscle and adipose cells.15
At 12 months after MI, patients on long-term 40 mg/day atorvastatin showed impaired functioning of the pancreas, assessed using the OGTT. Carbohydrate loading of these patients was accompanied by an abnormal reduction in insulin content (Figure 1) compared to apparently healthy individuals, in whom the insulin concentration should increase.18 Low insulin content can be associated with a decrease in its secretion.19 Statins are able to cause apoptosis induction of β cells through cytokine-induced hyperproduction of nitric oxide.
 | Figure 1 Dynamic postprandial levels of insulin resistance markers in patients with myocardial infarction during treatment with atorvastatin (as a percentage of basal level). Note: Statistically significant differences between groups are shown with P-values. |
Abnormal insulin secretion, which is associated with low concentrations of the hormone after carbohydrate loading, in patients taking 40 mg/day atorvastatin appeared to result in the appearance of postprandial hyperglycemia at 12 months after MI (Figure 1). Decreased and delayed postprandial insulin secretion can be a predictor of T2DM development. In a study by Polonsky et al,20 insulin secretion during the 4 h period following each meal in participants with T2DM had a statistically significant lower increase than in the control group (P<0.005).
In contrast, atorvastatin at a dose of 20 mg/day did not result in the changes observed in the 40 mg/day group. Interestingly, this dosage appeared to have beneficial effects on carbohydrate metabolism. At 12 months after MI, patients in group 1 (20 mg/day) showed normal basal and postprandial glycemia and insulinemia and QUICKI scores corresponded to reference ranges, which indicate full functioning of the pancreas and normal tissue sensitivity to insulin.15 The obtained results are consistent with data from other studies that report a positive effect of low doses of atorvastatin on the sensitivity of peripheral tissues to insulin and carbohydrate metabolism.5,17
The dose-dependent effect of atorvastatin may be associated with peculiarities affecting adipokine status, characterized by leptin, resistin, and adiponectin. Recently, increased attention has focused on the link between adipokines and the development of insulin resistance. Excess leptin and resistin lead to insulin epistasis, inhibit the impact of insulin on liver cells, and contribute to the development of insulin resistance in insulin-dependent tissues. Adiponectin, however, has antidiabetic properties, with a decrease in its concentration being an independent risk factor for the development of T2DM.21
In the current study, at baseline, during the acute period of MI, patients had an imbalance in adipokines, characterized by increased leptin and resistin and low adiponectin. A peculiarity of atorvastatin was its ability (at 20 mg/day throughout the treatment period) to modulate the adipokine content through reduction of leptin and the increase of adiponectin (Table 3). The observed effect is apparently caused by the inhibitory effect of atorvastatin on leptin mRNA.
Statins reduce the prenylation of phosphatidylinositol 3-kinase, resulting in deactivation, which leads to accumulation of cyclic adenosine monophosphate, and activation of protein kinase A, which inhibits the transcription of leptin genes in adipocytes.8
In the current study, with an increased dose of 40 mg/day atorvastatin, leptin levels remained high and adiponectin remained low, which is consistent with data in the literature. It is reported that incubation of adipocytes of mice in an environment with a high concentration of atorvastatin was accompanied by suppression of anti-inflammatory and insulin-mimetic adipokine expression (adiponectin and visfatin), while increased expression of anti-inflammatory cytokine IL-6 was observed.22
Ghrelin plays a leading role in insulin resistance and T2DM pathogenesis.8 Ghrelin modulates insulin secretion and is therefore regarded as a perspective molecular marker of insulin resistance. It also promotes expression of α- and β-subunits of the insulin receptor. Insulin at a concentration of 1–10 nm/L inhibits basal and noradrenaline-stimulated secretion of ghrelin but has no effect on mRNA hormone expression.8 Ghrelin, along with its endocrine properties, has a cardioprotective effect, slows down apoptosis of cardiomyocytes, reduces inflammation in endothelial cells, and inhibits expression of the transcription factor nuclear factor-κB.7
During the acute period of MI, we observed a deficiency in ghrelin. After 12 months of treatment with 20 mg/day atorvastatin, levels had increased, which can be regarded as a favorable effect, suggestive of normalization of carbohydrate metabolism, energy homeostasis, and functioning of the cardiovascular system as a whole. The effect of atorvastatin on ghrelin was not immediate, only becoming evident at month 12 of therapy.
It has been previously reported that short-term treatment (6 weeks) with atorvastatin at a dose of 10 mg/day in patients with T2DM and mixed hyperlipoproteinemia did not significantly affect ghrelin levels.11 In the current study, the higher dose of atorvastatin (40 mg/day) over the 12-month treatment period did not have a significant effect on ghrelin levels. A similar result was obtained in the study by Kadoglou et al,22 in which patients with T2DM and hyperlipidemia who were treated with atorvastatin at 80 mg/day showed no change in ghrelin levels.
Conclusion
Atorvastatin is an effective modifier of lipid and carbohydrate metabolism but shows its most beneficial effects at low doses. At 20 mg/day, atorvastatin was observed to improve tissue sensitivity to insulin and eliminate adipokine imbalance and ghrelin deficiency. At a dose of 40 mg/day, atorvastatin showed increased negative effects, such as a reduction in insulin secretion, hyperglycemia, impaired glucose tolerance, high levels of leptin, ghrelin deficiency, and manifestation of T2DM.
The efficacy of statin therapy should be evaluated individually for each patient. The clinical use of statins for primary and secondary prevention of cardiovascular disease requires a balanced approach and risk–benefit assessment of the treatment. Careful monitoring of carbohydrate and lipid metabolism is recommended, especially in patients with risk factors for T2DM.
Acknowledgment
The authors wish to thank Elena Semibratova for assistance in writing this article.
Disclosure
The authors report no conflicts of interest in this work.
References
Hsueh WA, Law RE. Cardiovascular risk continuum: implications of insulin resistance and diabetes. Am J Med. 1998;105(1A):4–14. | ||
Rodriguez-Calvo R, Barroso E, Serrano L, et al. Atorvastatin prevents carbohydrate response element binding protein activation in the fructose-fed rat by activating protein kinase A. Hepatology. 2009;49(1):106–105. | ||
Nissen SE, Nicholls SJ, Sipahi I, et al. Effect of very high intensity statin therapy on regression of coronary atherosclerosis: the ASTEROID trial. JAMA. 2006;295(13):1556–1565. | ||
Ridker PM, Danielson E, Fonseca FA, et al. Rosuvastatin to prevent vascular events in men and women with elevated C-reactive protein. N Engl J Med. 2008;359(21):2195–2197. | ||
Rajpathak SN, Kumbhani DJ, Crandall J, Barzilai N, Alderman M, Ridker PM. Statin therapy and risk of developing type 2 diabetes: a meta-analysis. Diabetes Care. 2009;32(10):1924–1929. | ||
Vlachopoulos C, Ioakeimidis N, Aznaouridis K, Lazaros G, Tousoulis D. Statins in diabetes mellitus. Curr Pharm Des. Epub 2017 Aug 15.. | ||
Shetty GK, Conomides PA, Horton ES, Mantzoros CS, Veves A. Circulating adiponectin and resistin levels in relation to metabolic factors, inflammatory markers, and vascular reactivity in diabetic patients and subjects at risk for diabetes. Diabetes Care. 2004;27(10):2450–2457. | ||
Blom WA, Stafleu A, de Graaf C, Kok FJ, Schaafsma G, Hendriks HF. Ghrelin response to carbohydrate-enriched breakfast is related to insulin. Am J Clin Nutr. 2005;81(2):367–375. | ||
Gruzdeva O, Uchasova E, Belik E, Dyleva Y, Shurygina E, Barbarash O. Lipid, adipokine and ghrelin levels in myocardial infarction patients with insulin resistance. BMC Cardiovasc Disord. 2014;14:7. | ||
Killip T 3rd, Kimball JT. Treatment of myocardial infarction in a coronary care unit. A two year experience with 250 patients. Am J Cardiol. 1967;20(4):457–464. | ||
Katz A, Nambi SS, Mather K, et al. Quantitative insulin sensitivity check index: a simple, accurate method for assessing insulin sensitivity in humans. J Clin Endocrinol Metab. 2000;85(7):2402–2410. | ||
Mitsuhashi T, Hibi K, Kosuge M, et al. Relation between hyperinsulinemia and nonculprit plaque characteristics in nondiabetic patients with acute coronary syndromes. JACC Cardiovasc Imaging. 2011;4(4):392–401. | ||
Jukema JW, van der Hoorn JW. Amlodipine and atorvastatin in atherosclerosis: a review of the potential of combination therapy. Expert Opin Pharmacother. 2004;5(2):459–468. | ||
Teraoka N, Mutoh M, Takasu S, et al. Inhibition of intestinal polyp formation by pitavastatin, a HMG-CoA reductase inhibitor. Cancer Prev Res (Phila). 2011;4(3):445–453. | ||
Barylski M, Nikolic D, Banach M, Toth PP, Montalto G, Rizzo M. Statins and new-onset diabetes. Curr Pharm Des. 2014;20(22):3657–3664. | ||
Sehra D, Sehra S, Sehra ST. Cardiovascular pleiotropic effects of statins and new onset diabetes: is there a common link: do we need to evaluate the role of KATP channels? Expert Opin Drug Saf. 2017;16(7):823–831. | ||
Sattar N, Preiss D, Murray HM, et al. Statins and risk of incident diabetes: a collaborative meta-analysis of randomised statin trials. Lancet. 2010;375(9716):735–742. | ||
Zaharan NL, Williams D, Bennett K. Statins and risk of treated incident diabetes in a primary care population. Br J Clin Pharmacol. 2013;75(4):1118–1124. | ||
Sampson UK, Linton MF, Fazio S. Are statins diabetogenic? Curr Opin Cardiol. 2011;26(4):342–347. | ||
Polonsky KS, Gumbiner B, Ostrega D, Griver K, Tager H, Henry RR. Alterations in immunoreactive proinsulin and insulin clearance induced by weight loss in NIDDM. Diabetes. 1994;43(7):871–877. | ||
Miyagishima K, Hiramitsu S, Kato S, et al. Efficacy of atorvastatin therapy in ischaemic heart disease – effects on oxidized low-density lipoprotein and adiponectin. J Int Med Res. 2007;35(4):534–539. | ||
Kadoglou NP, Sailer N, Kapelouzou A, et al. Effects of atorvastatin on apelin, visfatin (nampt), ghrelin and early carotid atherosclerosis in patients with type 2 diabetes. Acta Diabetol. 2012;49(4):269–276. |
 © 2017 The Author(s). This work is published and licensed by Dove Medical Press Limited. The
full terms of this license are available at https://www.dovepress.com/terms
and incorporate the Creative Commons Attribution
- Non Commercial (unported, 3.0) License.
By accessing the work you hereby accept the Terms. Non-commercial uses of the work are permitted
without any further permission from Dove Medical Press Limited, provided the work is properly
attributed. For permission for commercial use of this work, please see paragraphs 4.2 and 5 of our Terms.
© 2017 The Author(s). This work is published and licensed by Dove Medical Press Limited. The
full terms of this license are available at https://www.dovepress.com/terms
and incorporate the Creative Commons Attribution
- Non Commercial (unported, 3.0) License.
By accessing the work you hereby accept the Terms. Non-commercial uses of the work are permitted
without any further permission from Dove Medical Press Limited, provided the work is properly
attributed. For permission for commercial use of this work, please see paragraphs 4.2 and 5 of our Terms.