")
Back to Journals » International Journal of Nanomedicine » Volume 12
Effect of dacarbazine on CD44 in live melanoma cells as measured by atomic force microscopy-based nanoscopy
Authors Huang X, He JX, Zhang HT, Sun K, Yang J, Wang HJ, Zhang HX, Guo ZZ, Zha ZG, Zhou CR
Received 14 August 2017
Accepted for publication 10 November 2017
Published 18 December 2017 Volume 2017:12 Pages 8867—8886
DOI https://doi.org/10.2147/IJN.S149107
Checked for plagiarism Yes
Review by Single anonymous peer review
Peer reviewer comments 2
Editor who approved publication: Dr Linlin Sun
Xun Huang,1,2 Jiexiang He,2,3 Huan-tian Zhang,1 Kai Sun,2,3 Jie Yang,1 Huajun Wang,1 Hongxin Zhang,2,3 Zhenzhao Guo,2,3 Zhen-gang Zha,1 Changren Zhou2,3
1Department of Bone and Joint Surgery, The First Affiliated Hospital of Jinan University, 2Department of Materials Science and Engineering, Jinan University, 3Engineering Research Center of Artificial Organs and Materials, Ministry of Education, Guangzhou, China
Abstract: CD44 ligand–receptor interactions are known to be involved in regulating cell migration and tumor cell metastasis. High expression levels of CD44 correlate with a poor prognosis of melanoma patients. In order to understand not only the mechanistic basis for dacarbazine (DTIC)-based melanoma treatment but also the reason for the poor prognosis of melanoma patients treated with DTIC, dynamic force spectroscopy was used to structurally map single native CD44-coupled receptors on the surface of melanoma cells. The effect of DTIC treatment was quantified by the dynamic binding strength and the ligand-binding free-energy landscape. The results demonstrated no obvious effect of DTIC on the unbinding force between CD44 ligand and its receptor, even when the CD44 nanodomains were reduced significantly. However, DTIC did perturb the kinetic and thermodynamic interactions of the CD44 ligand–receptor, with a resultant greater dissociation rate, lower affinity, lower binding free energy, and a narrower energy valley for the free-energy landscape. For cells treated with 25 and 75 µg/mL DTIC for 24 hours, the dissociation constant for CD44 increased 9- and 70-fold, respectively. The CD44 ligand binding free energy decreased from 9.94 for untreated cells to 8.65 and 7.39 kcal/mol for DTIC-treated cells, which indicated that the CD44 ligand–receptor complexes on DTIC-treated melanoma cells were less stable than on untreated cells. However, affinity remained in the micromolar range, rather than the millimolar range associated with nonaffinity ligands. Hence, the CD44 receptor could still be activated, resulting in intracellular signaling that could trigger a cellular response. These results demonstrate DTIC perturbs, but not completely inhibits, the binding of CD44 ligand to membrane receptors, suggesting a basis for the poor prognosis associated with DTIC treatment of melanoma. Overall, atomic force microscopy-based nanoscopic methods offer thermodynamic and kinetic insight into the effect of DTIC on the CD44 ligand-binding process.
Keywords: atomic force microscopy, tumor, dynamic force spectroscopy, kinetic and thermodynamic interactions, affinity, nanoindentation
Introduction
The receptor interaction of CD44 with ligand (herein denoted CD44 ligand–receptor) is important for cellular processes such as migration, adhesion, proliferation, and signal transduction.1–4 Tumor cells with CD44 receptor proteins (CD44+) are more proliferative, clonogenic, tumorigenic, and metastatic than isogenic CD44− cells.5 Melanoma cell proliferation, tumor progression, and metastasis are mediated by the interactions of CD44 ligand–receptor.6 Furthermore, interactions of membrane CD44 and extracellular ligands have been postulated to promote melanoma growth,7 with the high rates of recurrence and metastasis critical bottlenecks in chemotherapeutic treatment of melanoma.8–10 Increased levels of soluble CD44s (the standard isoform, comprising exons 1–5 and 16–20) and soluble CD44v (splice variants containing variable exons) in the circulation of cancer patients have been considered prognostic markers for disease progression.7 As such, there are a number of issues regarding CD44 that require investigation, one of which is a better understanding of the effect of chemotherapeutic drugs on CD44 expression. Another, which is more important, is a better understanding of how CD44 ligand–receptor interactions are hampered, impaired, or perturbed. The kinetic and thermodynamic interaction of ligand–receptors is correlated to binding affinity and signal transduction.11–13 Even if CD44 expression is reduced, the appropriate binding affinity of ligand for CD44 can trigger CD44 signal transduction via activation of the CD44 receptor, which results in cellular proliferation and tumor metastasis. Furthermore, a detailed understanding of the effect of chemotherapeutic drugs on the kinetic and thermodynamic interaction of CD44 ligand–receptor at the single molecule level is still lacking. Apart from CD44 receptor expression, the influence of chemotherapeutic drugs on the distribution of CD44 binding sites on native cell membranes under physiological conditions have not been precisely mapped. The alkylating agent dacarbazine (DTIC) is the major chemotherapeutic drug for the treatment of malignant melanoma, but its efficacy is very disappointing.14–16 Melanoma patients treated with DTIC have a poor prognosis in that the tumor readily becomes resistant to the drug, and they have a 1-year survival rate of 36%.10 Thus, quantitative investigation of how and to what extent DTIC influences the binding strength of CD44 ligand–receptor may improve drug treatment efficacy. Such an investigation may increase drug efficacy by decreasing metastasis and melanoma cell proliferation, improve prognosis, and serve as a means by which to develop new targets for anti-melanoma treatment.
Here, we introduce high-resolution and high-sensitivity force distance curves-based atomic force microscopy (AFM) to topographically map the CD44 ligand-binding sites on native membrane of melanoma cells before and after DTIC treatment. This was accomplished at the single-molecule level and was used to quantify kinetic and thermodynamic parameters of the ligand-binding free energy landscape in the absence and presence of DTIC under physiologically relevant conditions. Modulation of the membrane receptor’s ability to bind a ligand depends not only on ligand-binding sites, the chance of receptor clustering, and changes in receptor conformation and structure, but also on alterations in the composition and structure of the membrane or intracellular interactions with the cytoskeleton.17–20 Furthermore, changes in cellular nanostructure and nanomechanical properties are useful markers to evaluate curative effects and drug action mechanisms.21–25 In this investigation, high-resolution AFM imaging and nanoindentation-based soft colloidal force spectroscopy were used to detect real-time changes in melanoma cell morphology, nanostructure, and nanomechanical properties after DTIC treatment, in the context of CD44 modulation.
Materials and methods
CCK-8 assay to analyze cell viability
B16-F10 melanoma cells were purchased from ATCC (Manassas, VA, USA) and maintained in Dulbecco’s Modified Eagle’s Medium (DMEM) with high glucose, containing 10% fetal bovine serum (FBS). Before cells were seeded into 96-well plates, we determined cell viability primarily by trypan blue staining and determined the number of cells by cell counting. The percentage of viable cells was about 99% and the cell number was about 3×10⁴ cells/mL. Cells in exponential growth were placed in 96-well plates at a final concentration of 3×10⁴ cells/mL and then treated with differing concentrations of DTIC for differing periods of time. Cell viability was assessed using the Cell Counting Kit (CCK-8) assay (Beyotime Biotechnology, Shanghai, China) according to the manufacturer’s instructions. The absorbance of each well was read at 490 nm with MK3 Absorbance Microplate Reader (Thermo Electron Corporation, Beverly, MA, USA). All data were derived from three independent experiments. Cell inhibition rates (%) were determined as follows: 1− [ODtreatment − ODblank/ODcontrol − ODblank] × 100%.
CD44 analysis by flow cytometry (FCM)
B16-F10 cells were placed in 24-well plates at a density of 2×10⁶ cells per well in 200 mL of DMEM with 10% FBS. After 6 hours, DTIC was added to the cells at differing concentrations (0, 0.1, 1.0, 10, 25, 50, 75, and 100 μg/mL). After incubation for 24 hours, fluorochrome-conjugated anti-CD44 antibody (eBioscience, San Diego, CA, USA) was added to each well. Then, the cells were analyzed using FCM (FACS Calibur; Becton Dickinson, San Jose, CA, USA). FCM results were analyzed using Cell Quest software (Win MDI; Becton Dickinson).
Antibody-conjugated quantum dot (QD) fluorescence staining
The staining procedure for the CD44 antibody and QD conjugates was as follows: control cells and the cells treated with 25, 50, and 75 μg/mL DTIC for 24 hours were washed with phosphate-buffered saline (PBS), then fixed with 2% formaldehyde at 4°C for 30 minutes, and then washed three times with PBS before staining. The cells were then blocked for 30 minutes with 1% bovine serum albumin (BSA) and incubated with 20 mg/mL biotinylated anti-mouse CD44 antibody for 60 minutes; next, the cells were incubated with 1 μg/mL QD-streptavidin for 60 minutes in the dark. CD44 molecules were viewed using a LCM 510 Meta Duo laser scanning confocal microscope (LSCM) (Carl Zeiss Meditec AG, Jena, Germany).
Immunofluorescence imaging of the cytoskeletal proteins, F-actin and tubulin
The cytoskeletal structures of B16-F10 cells treated with differing concentrations of DTIC were visualized by staining with phalloidin-fluorescein isothiocyanate (FITC) and Tubulin-Tracker. Cells were fixed with 4% paraformaldehyde and permeabilized with 0.1% Triton X-100 and incubated in phalloidin-FITC or Tubulin-Tracker solution (Beyotime Biotechnology) at a dilution of 1:40 for 60 minutes in the dark at room temperature. After being washed three times with PBS, the cells were incubated with a 4′,6-diamidino-2-phenylindole (Beyotime Biotechnology) solution at a dilution of 1:200 for 15 minutes at room temperature and then washed three times with PBS. The cytoskeleton organization and cell nucleus were imaged using LSCM. The images were processed using Zeiss LSCM software.
Functionalization of AFM tips
Immobilization of anti-CD44 antibody on AFM cone tips with a spring constant of 0.059 N/m (DNP-10, Bruker Corp.) was as follows:17,18 1) The Si3N4 tips were immersed in acetone for 5 minutes and then irradiated with ultraviolet light (mercury grille lamp, λ=253.7 nm, 250 W) for 30 minutes. 2) Tips were cleaned with piranha solution (H2SO4:H2O2=3:1, v/v) for 10 minutes, washed three times with ultrapure water, and then incubated in a 1% (v/v) solution of (3-aminopropyl)triethoxysilane (Sigma-Aldrich Co., St Louis, MO, USA) in ethanol for 30 minutes. 3) After thorough rinsing with ultrapure water, the amine-terminated AFM probes were placed in a glutaraldehyde solution (2.5%, v/v) for 1 hour and then washed 3 times with PBS pH 7.4. 4) Finally, the tips were incubated with an anti-CD44 (1 mg/mL) solution overnight at 4°C. The modified probes were again thoroughly rinsed with PBS and stored in PBS at 4°C until use. The immobilization of anti-CD34 and BSA on AFM spherical probes was carried out using the same procedure.
AFM measurements
All morphology images were obtained using AFM (AutoProbe CP Research; Thermo Microscopes, Sunnyvale, CA, USA) in contact mode. AFM force spectroscopy data were obtained from individual live cells in Hank’s Balanced Salt Solution, using Bio-AFM in ScanAsyst mode (BioScope Catalyst Bruker Instruments, Karlsruhe, Germany).
For specific CD44 molecule recognition maps, CD44 antibody-modified tips were used to detect CD44− live cell unbinding events with retraction velocities of 500 nm/s. CD44 blocking cells and BSA-modified tips were designed as controls to verify specific interactions between CD44 antibody-modified tips and B16-F10 cells.
For quantification of the thermodynamic and kinetic parameters of CD44 ligand–receptor binding, all specific interaction force curves obtained using CD44 antibody-modified tips under different loading rates ranging from 60 to 10,000 pN/s were analyzed. More than 1,000 force curves in a single experiment were measured for each loading rate. Origin9 was used to create the dynamic force spectroscopy plot from specific adhesion forces detected in the average adhesion maps. Similarly, dynamic force spectroscopy was obtained by changing the surface delay time from 0.05 to 4 s. More than 1,000 force curves were measured for each surface delay time in order to plot time-dependent dynamic force spectroscopy. The thermodynamic and kinetic parameters were then calculated by theoretical model-fitting and thermodynamic laws.
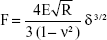
The accurate monitoring of mechanical properties of individual live cells was conducted using unmodified AFM spherical probes (CP-CONT-SiO-ADNP-10; NanoSensors, Neuchâtel, Switzerland), based on nanoindentation with a maximum loading force of 2 nN. To determine the elastic modulus of the cells, the experimental force–indentation curves were fitted as follows in a Hertz model:
|
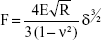
where F, E, δ, R, and ν are the loading force, elastic modulus, indentation depth, the reduced radius of curvature, and Poisson ratio 0.5, respectively. The spring constant was 0.077 N/m, which was determined using the thermal noise method.26,27 For any given experiment, ~1,000 force–distance curves were collected. To exclude a possible coincidental correlation, each experiment was performed at least three times, with different samples.
Statistical analysis
All the data were expressed as the mean ± standard deviation (SD). All statistical analyses were performed using OriginPro 9.0 (OriginLab, Northampton, MA, USA). Comparison between the two groups was conducted by using Student’s t-test. Significant analysis was assessed by one-way analysis of variance, followed by Tukey’s test and accepted as statistically significant at p<0.05. The data obtained for the unbinding force and elastic modulus were used to generate a frequency distribution. These were then analyzed by fitting multi-Gaussian distributions. If not otherwise stated, experiments were performed at least triplicates.
Results and discussion
Effect of DTIC on cell viability as determined by CCK-8 assay
The cytotoxicity of DTIC to the melanoma cell line B16-F10 was determined by CCK-8 assay (Figure S1). After treatment with differing concentrations of DTIC (0.1, 1.0, 10, 25, 50, 75, 100, 125, and 150 μg/mL) for 24 and 48 hours, a dose-dependent inhibition of B16-F10 cells growth was observed. The IC5024h value was 133.75 μg/mL.
Characterization of CD44 expression by B16-F10 cells
To quantitatively investigate the effect of DTIC on CD44 expression, FCM was used to measure the levels of CD44 by B16-F10 cells with and without DTIC treatment at the DTIC concentrations identified above. Figure 1A shows that cells treated with DTIC at concentrations of 25, 50, and 75 μg/mL for 24 hours down-regulated the expression of CD44. When the concentration of DTIC was increased to 100 μg/mL, CD44 was not significantly down-regulated when compared with the expression of CD44 by cells treated with 75 μg/mL DTIC for 24 hours. In addition, LSCM images were used to visualize the expression of CD44 on cell surfaces with or without DTIC treatment (Figure 1B). For the control group, fluorescence was observed over the cell surface and was generally concentrated in the lamellipodia and the intercellular junction zone (Figure 1B). This distribution could enhance the binding to the extracellular matrix (ECM) and to other cells and may be related to cell migration and adhesion. In contrast, with DTIC treatment at concentrations of 25, 50, and 75 μg/mL for 24 hours, the lamellipodia disappeared, the cells shrank, and the fluorescence intensity was significantly reduced (Figure 1B). These data collectively suggest that DTIC inhibits the expression of CD44 in a dose-dependent manner, with correspondence to changes in cell morphology.
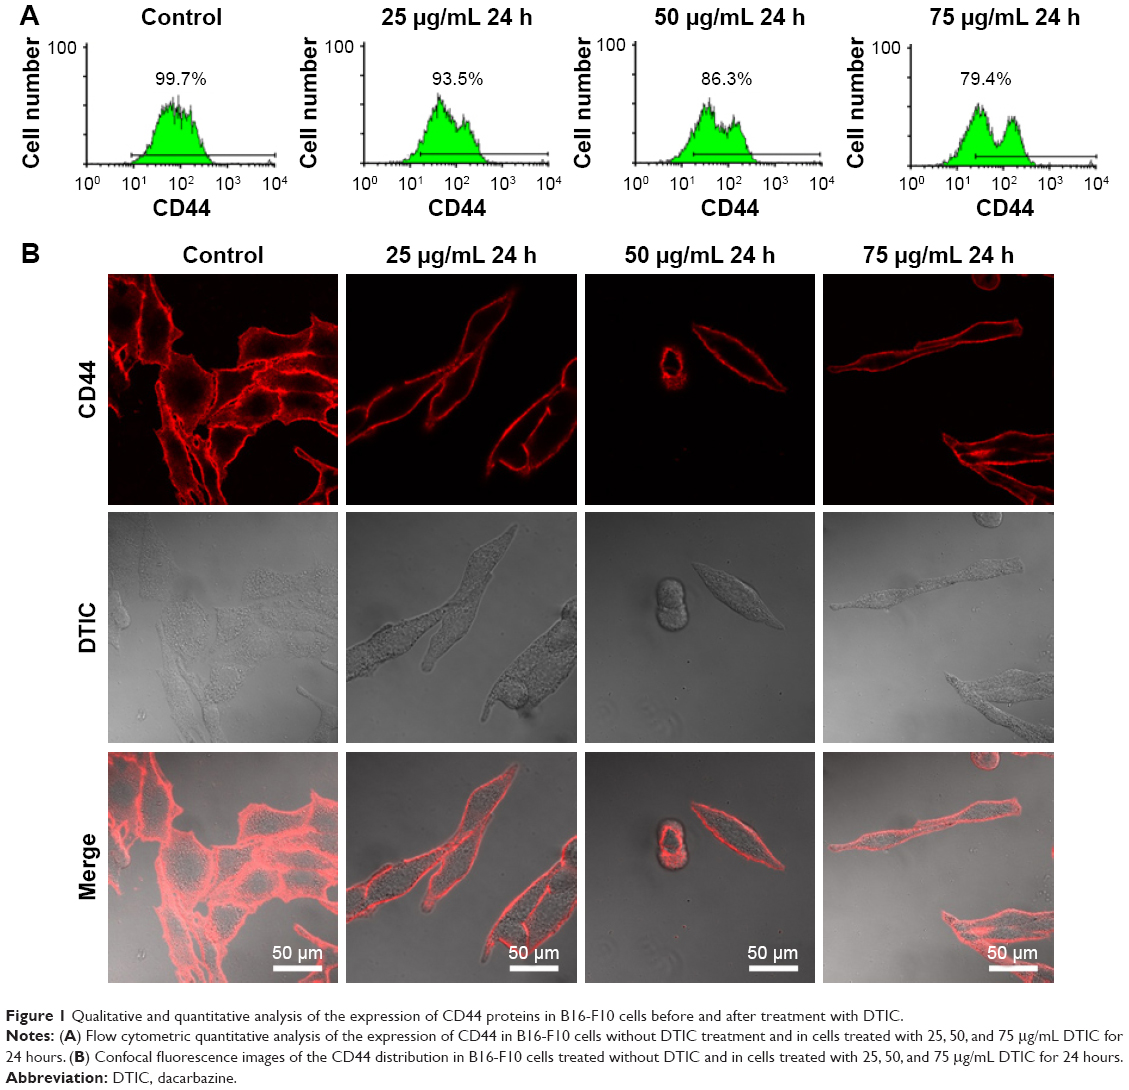 | Figure 1 Qualitative and quantitative analysis of the expression of CD44 proteins in B16-F10 cells before and after treatment with DTIC. |
Alterations in the cytoskeletal proteins F-actin and α-tubulin
CD44 is an organizer of the cortical actin skeleton that extracellularly binds to ligands in the ECM and, intracellularly, is mechanically linked to the actin cytoskeleton through ezrin/radixin/moesin proteins.28,29 Signal transduction requires the cytoplasmic tail region of CD44 to interact with actin to link to the local cytoskeletal organization.1 Thus, an investigation of the interaction of CD44 and B16-F10 cytoskeleton before and after cell treatment with DTIC may contribute to an understanding of the treatment effect of DTIC on melanoma.
As shown in Figure 2, F-actin was evenly distributed and organized in a parallel manner throughout the cell body, with α-tubulin cross-linked to form a dense, nest-like cell scaffold around the nucleus (Figure 2A and B). Following DTIC exposure for 24 hours, F-actin and α-tubulin fibers were gradually lost (Figure 2A and B). The fluorescence intensity of the DTIC-treated cells decreased significantly when compared with that of the control cells. Interestingly, when B16-F10 cells were pretreated with 20 μg/mL anti-CD44 for 12 hours before exposure to 50 μg/mL DTIC for 24 hours (Figure 2C), more F-actin and α-tubulin staining fibers were observed compared with cells treated with DTIC alone (Figure 2A and B). The capacity of CD44 to bind to a ligand can depend on intracellular interactions with the cytoskeleton.1 Cells contain cytoskeletal networks that not only regulate cell morphology but also define the cellular mechanical properties of the cell and participate in the transduction of signals from various surface receptors to the cell nucleus.22,30–32 Thus, these results indicate that DTIC disrupts the local linkage of CD44 to the cytoskeleton, which may influence the interactions of the CD44 ligand–receptor.
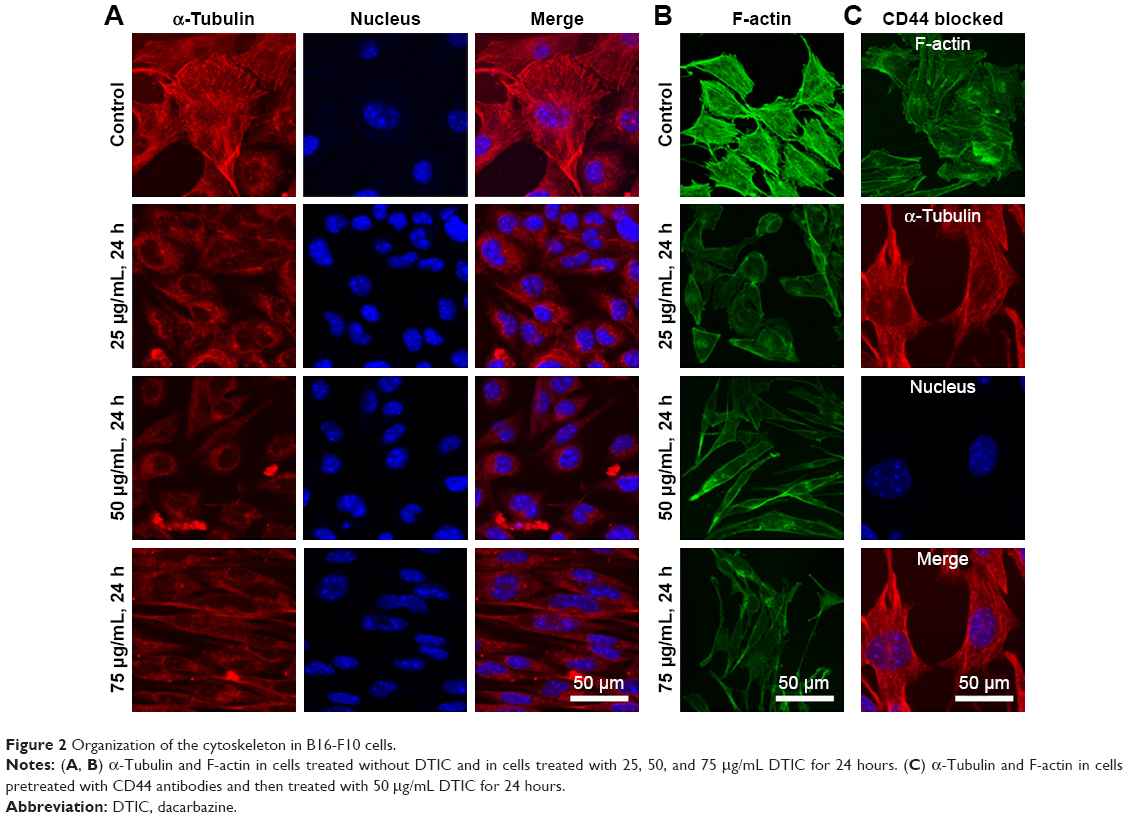 | Figure 2 Organization of the cytoskeleton in B16-F10 cells. |
Changes in the morphological ultrastructure of a single B16-F10 cell following DTIC treatment
CD44 is a transmembrane receptor, and the modulation of CD44 ligand–receptor interactions can depend upon the dynamic supramolecular assembly of the receptor with other proteins,17,19 the composition and structure of the membrane,18,20 or intracellular interactions with the cytoskeleton.1,33 Furthermore, morphological changes in drug-treated tumor cells are commonly used as a basis for the evaluation of drug effects.34,35 The cell membrane is an important regulator of cell function.36,37 Changes in the cell membrane can therefore directly influence the normal functions of cells.38,39 From the CD44 and cytoskeleton imaging (Figures 1 and 2), we have found changes in cellular morphology after DTIC treatment. Therefore, the in situ effect of DTIC on cellular morphology and ultrastructure was assessed.
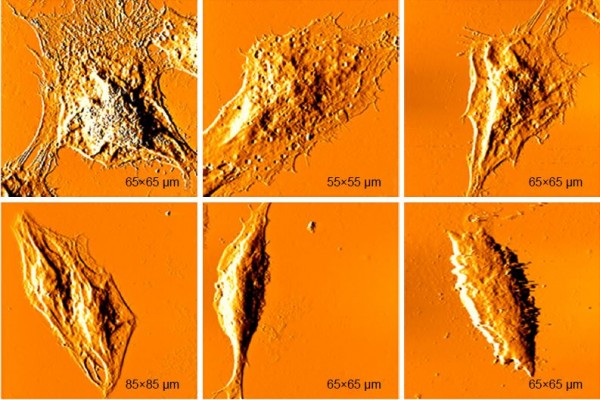
Real-time changes were investigated in the surface morphology and ultrafine structure of B16-F10 cells treated with differing concentrations of DTIC for differing times using AFM (Figures 3 and 4). The AFM images of the B16-F10 cells revealed remarkable differences in cell morphology and surface architecture in the presence and absence of DTIC (Figures 3 and 4). In the control group, the cells had a regular shape and obvious pseudopodia connecting them. The cell surface was relatively smooth and intact. The cell membrane architecture was homogeneous and granular. Following treatment with 25, 50, and 75 μg/mL DTIC for 24, 48, and 72 hours, significant changes in cell morphology were observed. The lamellipodia disappeared, and most of the cells gradually shrank into slender spindles (Figure 3A). Previous reports have shown the cytoplasmic tail region and the intracellular protein partners of CD44 to be important for its subcellular localization (eg, to the leading edge and lamellipodia of migrating cells).40,41 Hence, the disappearance of lamellipodia may be correlated with a decrease in CD44 expression. Figure 3B shows that the average cell height increased with DTIC concentration but was not significantly correlated with the DTIC treatment time. In addition, the length/width ratio increased with both DTIC concentration and treatment time (Figure 3B and C). When passing through the cell cycle from G2 into mitosis (M), a cell from a flat or elongated shape changed into a round shape.42 DTIC is a cell cycle nonspecific antineoplastic alkylating agent.43 As shown in Figure S2, in B16-F10 cells, DTIC led to increased cell arrest in the G1 phase when cells were treated with 25 μg/mL DTIC for 24 hours, whereas DTIC also induced notable cell arrest in the G2 phase when the concentration of DTIC was increased to 75 μg/mL. Therefore, the cell shrinkage and cell elongation induced by DTIC may be correlated with cell cycle block and inhibition of cell division and proliferation.
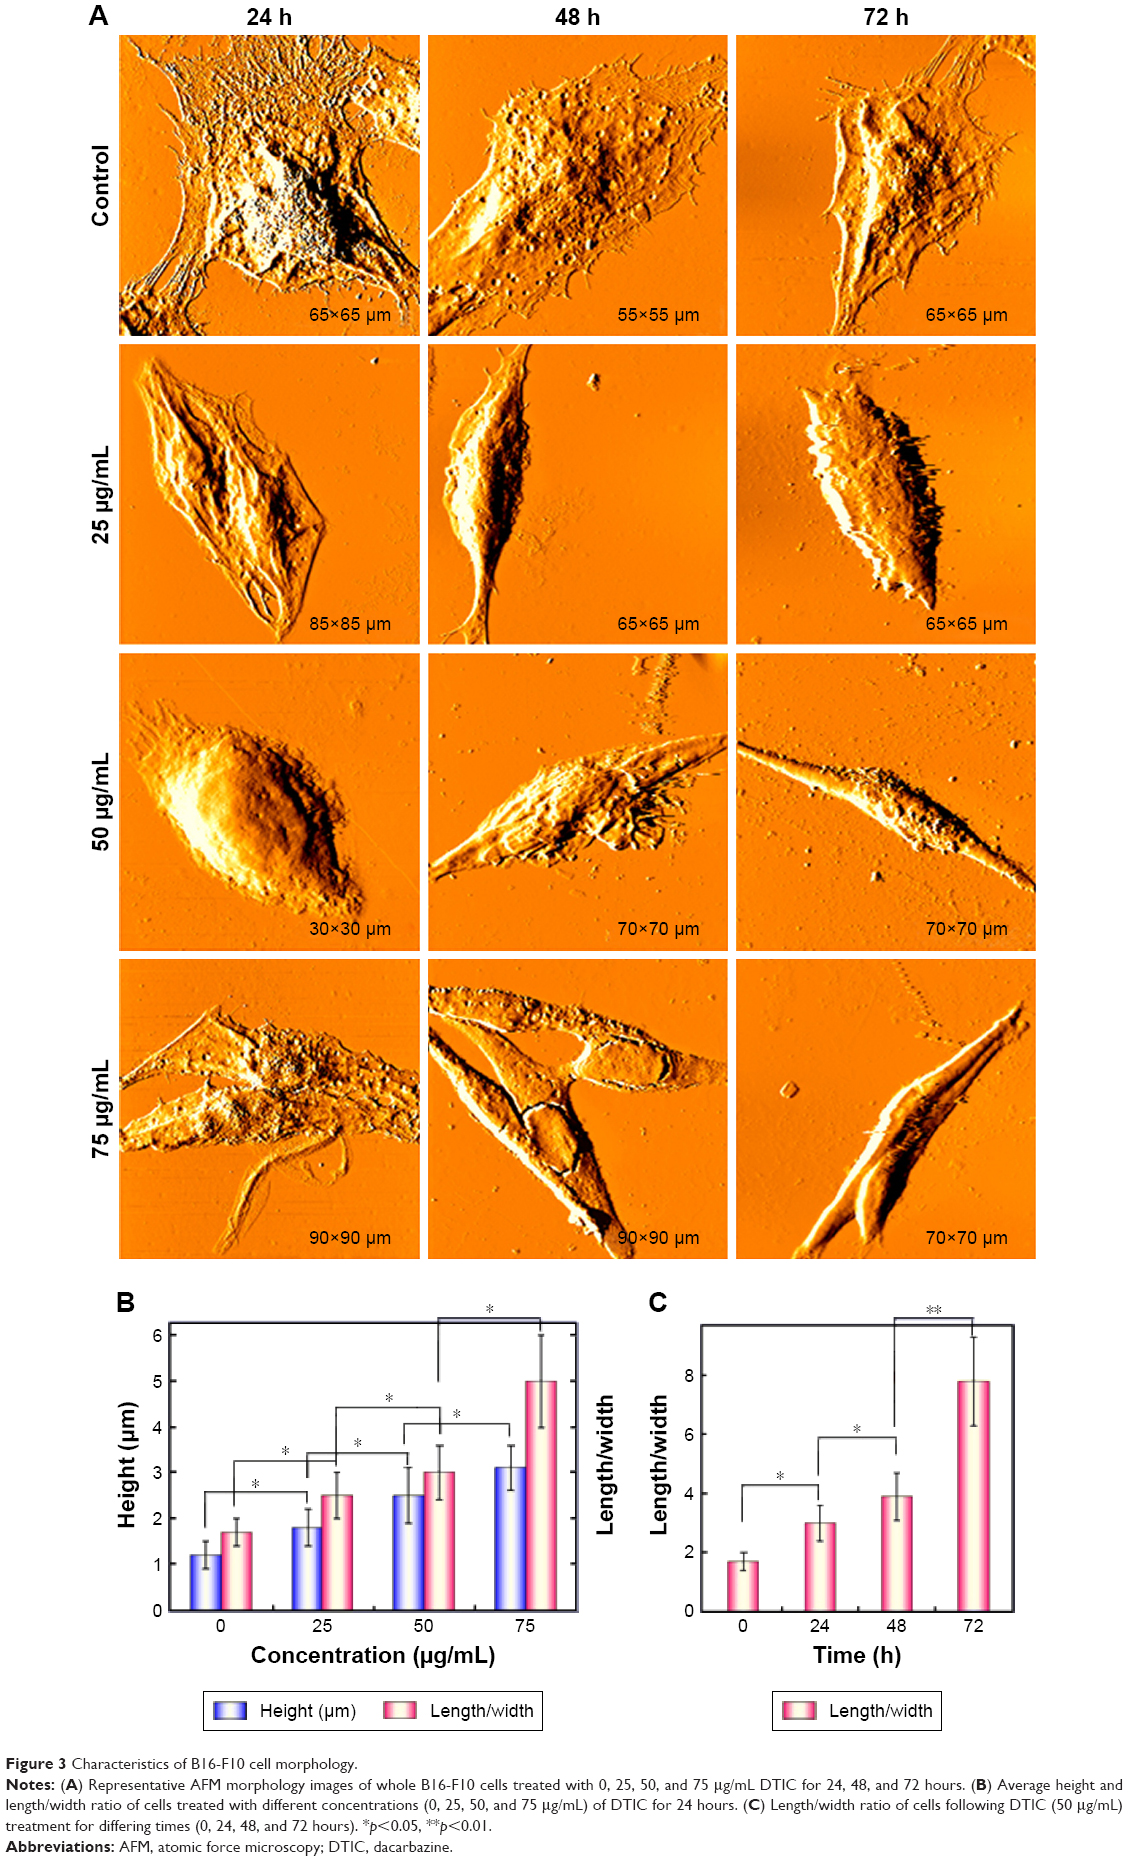 | Figure 3 Characteristics of B16-F10 cell morphology. |
 | Figure 4 Characteristics of B16-F10 cell membrane ultrastructure. |
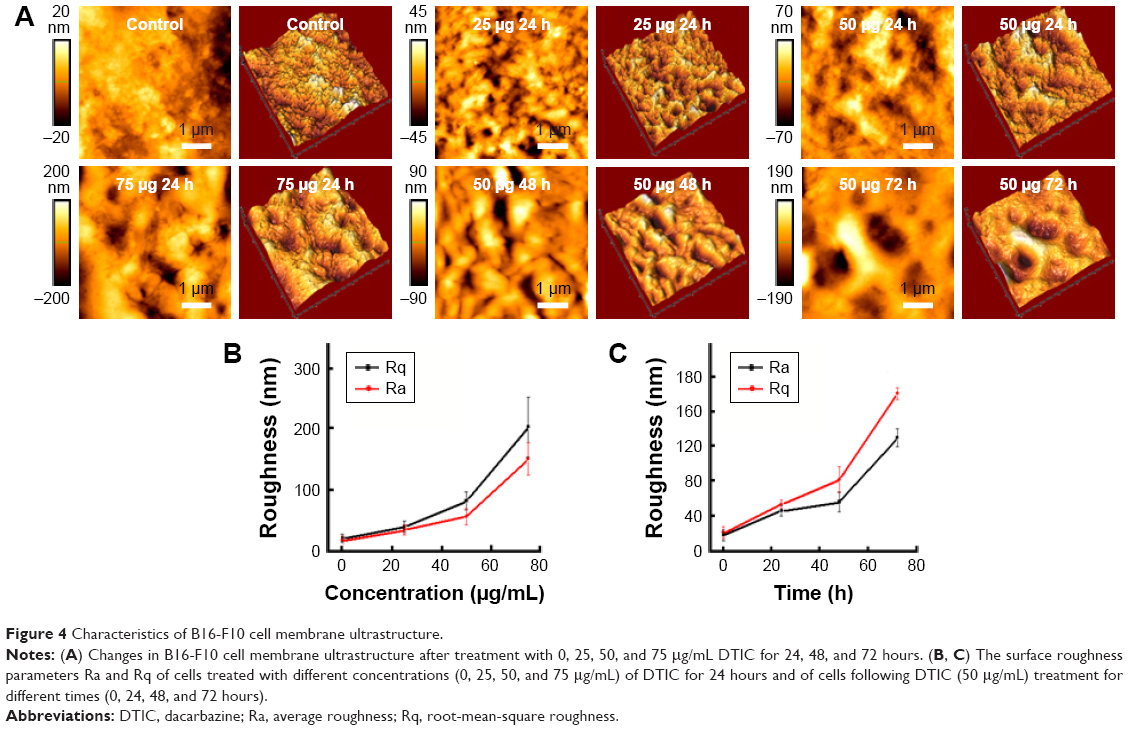
As shown in Figure 4A, cell membranes were damaged and showed some umbilications; particles enlarged and were heterogeneous (Figure 4A). In order to quantify the fraction of cell membrane damaging induced by DTIC, release of lactate dehydrogenase (LDH) into the culture medium was measured (Figure S3). Figure S3 showed the release of LDH induced by DTIC in a dose- and time-dependent manner. On the other hand, previous studies demonstrated roughness values, average roughness (Ra) and root-mean-square roughness (Rq), to be markers of the degree of change to cell membranes.44–46 As shown in Figure 4B and C, both the Ra and Rq of two different areas increased in a dose- and time-dependent manner. The Ra and Rq values of the cells in the control group were low, indicating a smooth surface (Figure 4A). In the treated cells, they increased with treatment time and concentration, indicating greater heterogeneity and rougher surfaces (Figure 4A). Combined with the changes of whole cell morphology and cell height (Figure 3A and B), we speculated that the damaging of cell membranes and the changes of osmotic pressure could cause cell morphology and cell height deformation. When exposed to 50 μg/mL DTIC for 72 hours, the edges of B16-F10 cells became irregular and fragmented (Figure 3A), which resulted in the emergence of larger and deeper depressions (Figure 4A). DTIC at 75 μg/mL and 48 hours of treatment resulted in deep cracks near nuclei (Figure 3A), indicating a relationship between the toxicity of DTIC and the ultrastructure of the cell membrane. All these data demonstrated that DTIC may also exert a direct cytotoxic effect on the cell membrane.
Changes in nanomechanical properties following drug treatment
Cell morphology, membrane structure, and nanomechanical properties are interdependent.47 Previous studies demonstrated that changes in cell morphology and ultrastructure were affected by the nanomechanical properties of cells.48–50 The nanomechanical properties of cells are also modulated by the cytoskeleton.51,52 CD44 is an organizer of the cortical actin skeleton,53 and CD44 expression level may mediate the nanomechanical properties of cells. On the other hand, cytoskeleton recombination may cause changes in CD44 protein structure and conformation, affecting the binding strength and stability of CD44 ligand–receptor complexes, as well as the mechanical properties of cells. Cell mechanical properties are a new and reliable indicator of cell state.21,22,54,55 Changes in biophysical and mechanical properties of plasma membrane are related to various different cellular processes, such as adhesion to ECM, cell-to-cell interaction, cellular migration, and tumor metastasis.56,57 Thus, analysis of the effects of DTIC on the nanomechanical properties of melanoma cells and whether CD44 mediates the nanomechanical properties of cells may provide information regarding the kinetic and thermodynamic interaction of CD44 ligand binding, which may impact the effect of DTIC on melanoma metastasis.
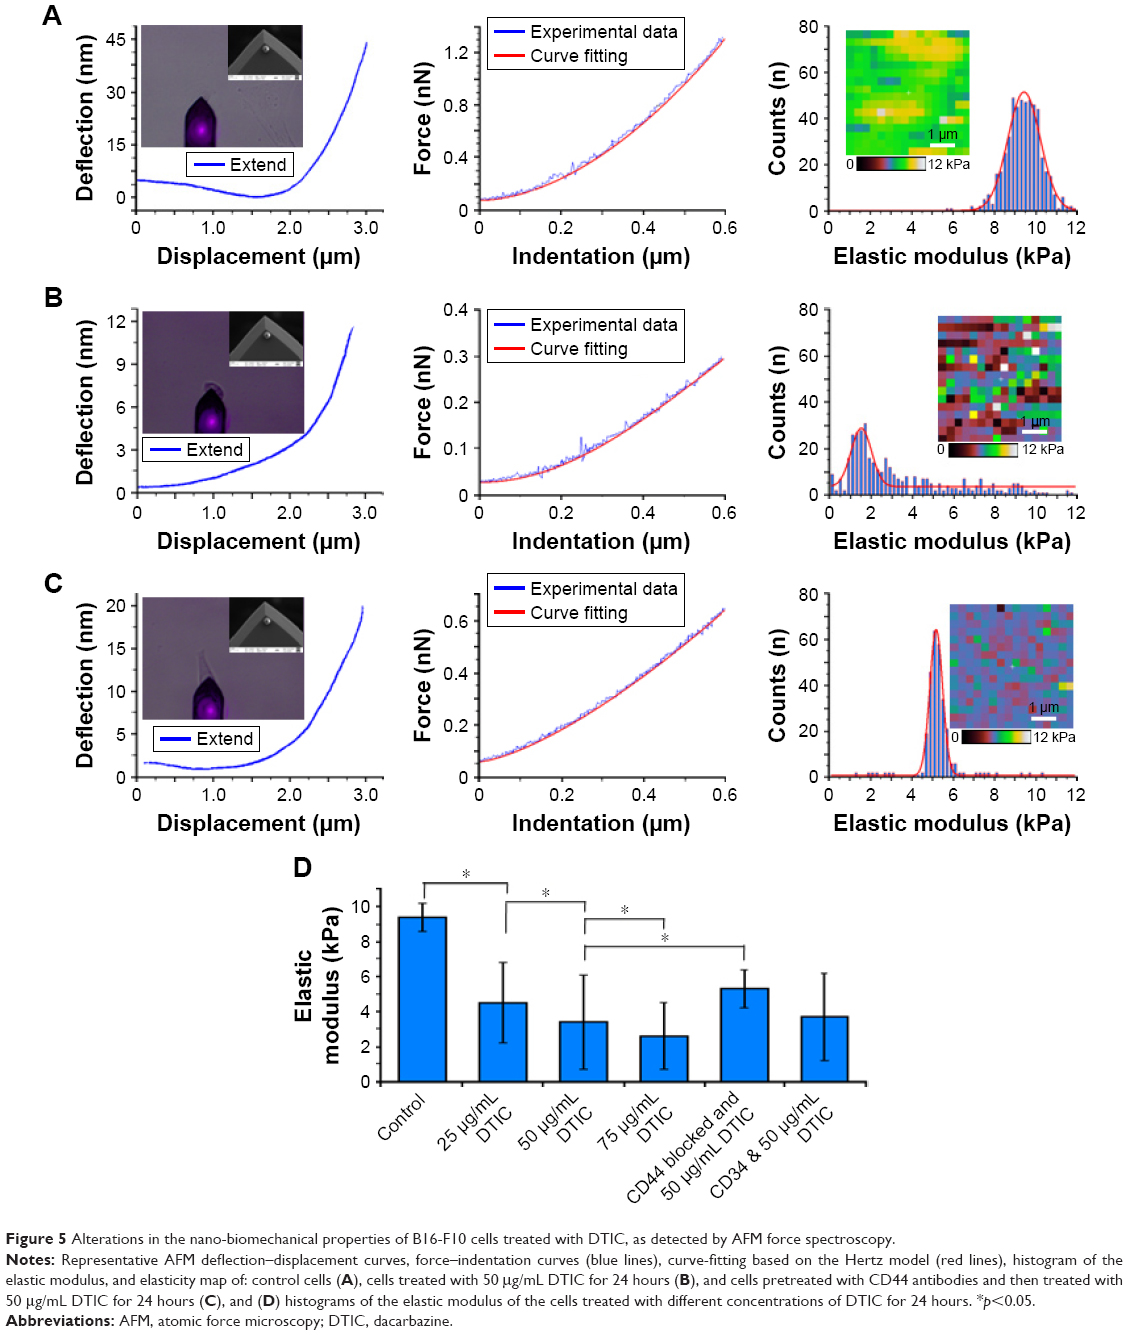
The nanomechanical properties of a single cell were measured by nanoindentation-based soft colloidal force spectroscopy. Figure 5A shows an AFM deflection–displacement curve and force–indentation curve (blue line). By fitting the modified Hertz model to the force–indentation curve (red line) (Figure 5A), the elastic modulus of untreated cells was then determined (Figure 5A). The average elastic modulus value of untreated B16-F10 cells was 9.4±0.8 kPa (Figure 5A). The average elastic modulus was reduced to 3.4±2.7 kPa in the presence of 50 μg/mL DTIC (Figure 5B). Notably, the dramatic reduction in elastic modulus frequency and the broadening of the distribution are in accord with a change in elasticity maps (Figure 5A and B, inset). The elastic modulus values obtained from the B16-F10 cells after DTIC treatments at various concentrations for 24 hours are shown in Figure 5D. The elastic modulus of the B16-F10 cells gradually decreased with increasing DTIC concentration.
 | Figure 5 Alterations in the nano-biomechanical properties of B16-F10 cells treated with DTIC, as detected by AFM force spectroscopy. |
Elasticity changes were evaluated in cells pretreated with CD44 antibodies and then treated with 50 μg/mL DTIC for 24 hours (Figure 5C). For the B16-F10 cells pretreated with 20 μg/mL of anti-CD44 for 12 hours before exposure to DTIC, the elastic modulus was 5.3±1.1 kPa, with a simultaneous narrowing of the elasticity distribution (Figure 5C). To exclude a possible coincidental correlation, the B16-F10 cells that were pretreated with another antibody, anti-CD34, before exposure to 50 μg/mL DTIC for 24 hours, showed no increase in elastic modulus compared with anti-CD44 pretreated cells (Figure 5D). DTIC treatment resulted in a decrease in cell elasticity of ~64%, but when the CD44 binding sites of cells were blocked, the cell elasticity decreased to ~44% of that of untreated cells. Combined with the CD44 expression and cytoskeleton results shown in Figures 1 and 2, these data indicate that DTIC inhibited the expression of CD44 and disrupted the local linkage of CD44 to the cytoskeleton, triggering a decrease in cellular elasticity. The decrease in cellular elasticity was correlated with changes in cell morphology and membrane structure induced by DTIC.
AFM nanoscale imaging of CD44 molecules using single-molecule force spectroscopy (SMFS)
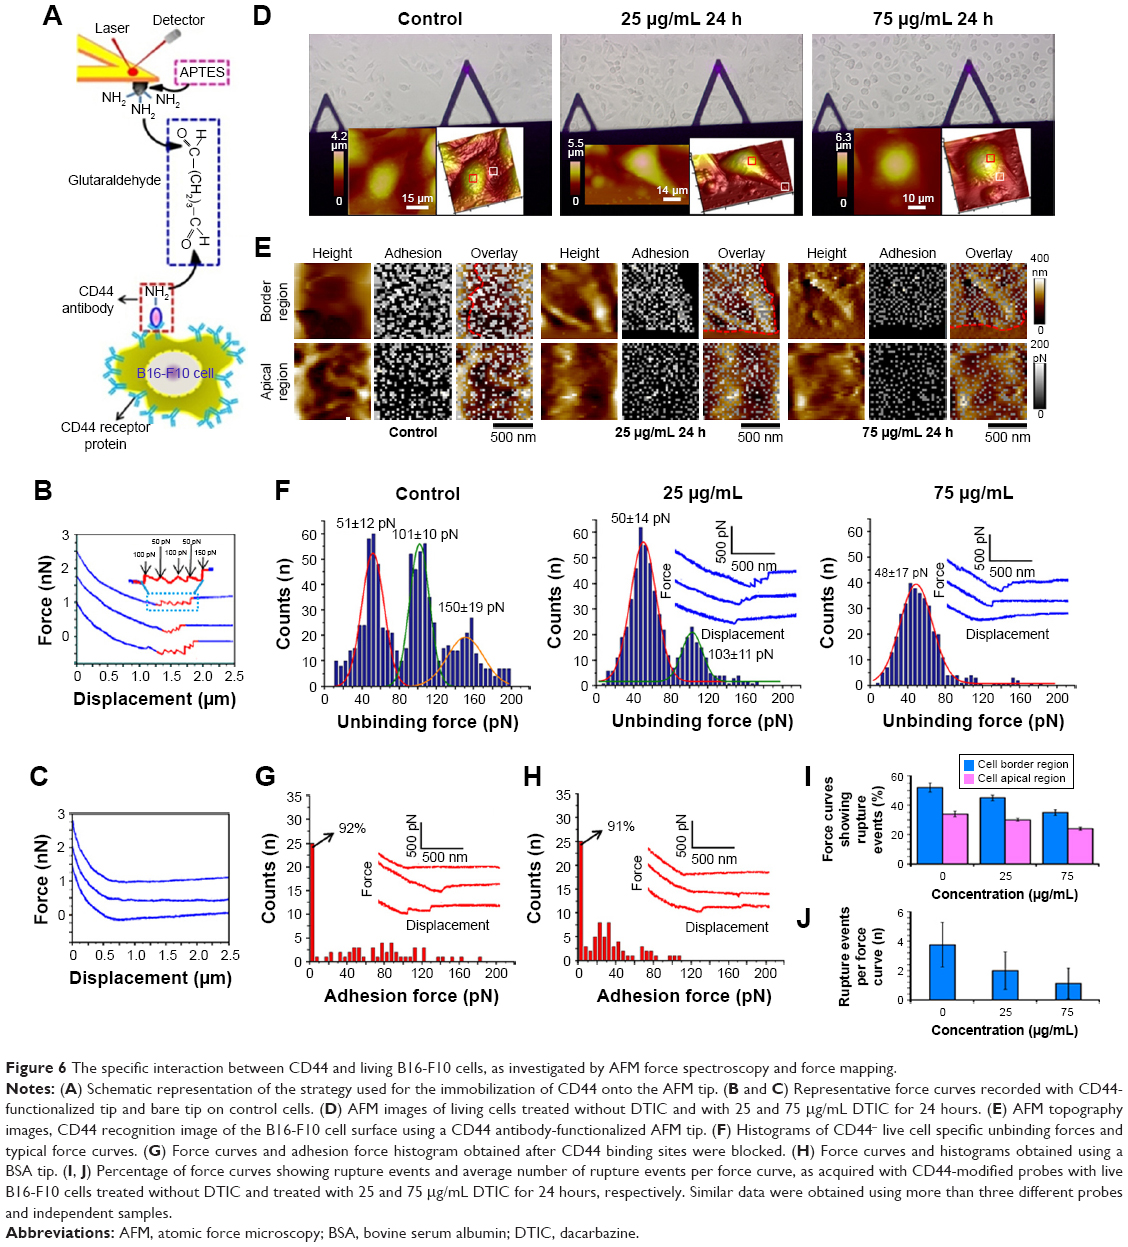
Immunofluorescence images presented in Figure 1 showed that in B16-F10 cells CD44 was largely distributed over the cell surface with an apparent increase in its surface density at border regions. Upon exposure to DTIC, a significant decrease in CD44 expression level was observed in a dose-dependent manner and within a particular range of DTIC concentration. Most importantly, the above results indicate the link between CD44 proteins, the cytoskeleton, cellular adhesion, and cell metastasis. In order to relate changes in CD44 surface expression to functional cell-to-cell and cell–ECM adhesion, detection of the unbinding force of the CD44 ligand–receptor on living cells and the distribution of CD44 receptors on an individual living B16-F10 cell are necessary. Detecting the effect of DTIC on the unbinding force of CD44 ligand–receptor and CD44 distribution on native melanoma cells at the single-molecule level will open an avenue to directly image and characterize the anti-tumor effect of DTIC for prognosis assessment. In Figure 1, fluorescence imaging probed the entire cell membrane, but the CD44 binding sites on native cells were not mapped precisely. The binding force of the CD44 ligand–receptor on live cells is an important parameter in the CD44 ligand–receptor binding process. Therefore, we used SMFS, with tips functionalized with CD44 antibody, to determine the anti-CD44/living cell unbinding force, in order to achieve a detailed assessment of CD44 distribution within localized regions of an individual living B16-F10 cell at the single-molecule level (Figure 6A).
Retraction curves recorded between the anti-CD44 functionalized tips and cell surfaces displayed multiple adhesion peaks (Figure 6B). Unbinding forces were detected on the border and apical regions of the cells treated without DTIC and of those treated with 25 and 75 μg/mL DTIC for 24 hours (Figure 6D and E). Rupture events were observed in 52.3%±3.4% and 34%±2.2%, respectively, for border and apical regions of the control cells. A total of 1,024 curves were recorded (Figure 6E and I). Interestingly, most of the CD44 proteins were concentrated at nanodomains (Figure 6E). Force mapping confirmed more and larger CD44 nanodomains, ranging from 50 to 300 nm in diameter, at cell borders versus the apical regions of cells. The unbinding force histogram revealed a trimodal distribution, with average rupture forces of 51±12, 101±10, and 150±19 pN (Figure 6F). To determine the specificity of the measured interactions, control experiments were also carried out to record force curves between 1) bare AFM tips and cells (Figure 6C), 2) anti-CD44-modified tips, and cells blocked by anti-CD44 (Figure 6G), 3) BSA-modified tips and cells (Figure 6H). Both the blocking experiments and the use of a BSA tip dramatically reduced the number of curves showing adhesion events, as well as the measured adhesion force, with very few curves showing multiple adhesion peaks (Figure 6C, G, and H). These results demonstrate the adhesion force measured using the anti-CD44 tip to be specific to the CD44 ligand–receptor interaction. The 51 pN rupture force reflected the detection of a single CD44 receptor in cells. When force curves were acquired for cells treated with 25 μg/mL DTIC for 24 hours, rupture events were observed in 45.2%±2.3% and 30.5%±1.1%, respectively, for border and apical regions of the control cells (Figure 6E and I). These unbinding forces had a bimodal distribution, with mean values of 50±14 and 103±11 pN (Figure 6F). The reduction in adhesion frequency (Figure 6F) and the number of rupture events per force curve (Figure 6J) matched well with the force mapping, which indicates CD44 nanodomains to be decreased and smaller (Figure 6E). Increasing the DTIC concentration to 75 μg/mL, the percentage of force curves showing rupture events decreased to 35.3%±2.1% and 24.2%±1.3%, respectively, for the border and apical regions of cells (Figure 6E and I). The unbinding force histogram revealed a unimodal distribution, with average rupture forces of 48±17 pN (Figure 6F). The adhesion frequency and the number of rupture events per force curve further decreased (Figure 6F and J). Simultaneously, the CD44 nanodomains reduced significantly and became smaller (Figure 6E). The unbinding force for the CD44 ligand–receptor decreased slightly after treatment with DTIC. The results of the AFM recognition experiment were consistent with the results of the LSCM and FCM assays. The distribution of CD44 is not uniform but shows area-specific differences on the cell membrane. The increased number and the larger CD44 nanodomains on the border regions of melanoma cells may permit the binding of multiple CD44 ligands on ECM and cells, which may contribute to the invasion and metastasis of melanoma. Treatment with different DTIC concentrations showed no significant decrease in CD44 unbinding force between CD44 ligand and receptor, while the CD44 nanodomains were reduced and became smaller. Previous studies have shown that the chance of CD44 receptor clustering affects its binding affinity.1 Hence, the reduced and smaller CD44 nanodomains after exposure to DTIC may affect binding strength and free-energy landscapes of the CD44 ligand–receptor on living melanoma cells.
 | Figure 6 The specific interaction between CD44 and living B16-F10 cells, as investigated by AFM force spectroscopy and force mapping. |
Extracting CD44 ligand–receptor binding parameters and the free-energy landscape
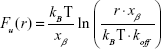
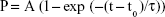
The ultimate mechanism of antitumor drug action is usually a change in, or blocking of, signaling pathways.58,59 Cellular response to micro-environmental signals is initiated by the specific binding of ligands to cognate cell membrane receptors.60 Once CD44 transmembrane receptors bind to ligands in ECM, the intracellular signaling pathways are initiated, thereby regulating cell–cell and cell–matrix adhesion, which controls cell proliferation, differentiation, migration, survival, and tumor metastasis.1 The binding ability of CD44 for ECM components correlates with changes in receptor conformation, binding site, the composition and structure of the plasma membrane, and the intracellular cytoskeleton.41,61,62 Although understanding the influence of DTIC on CD44 receptor expression, CD44 ligand binding sites, and CD44 ligand–receptor unbinding force is important, it is more important to quantitatively investigate how these factors influence the kinetic and thermodynamic interactions of the CD44 ligand–receptor. It is vital to understand the anti-melanoma mechanism of DTIC in order to predict melanoma prognosis. It is not clear whether modifications induced by DTIC directly affect the binding affinity of CD44 and/or the stability of CD44 ligand–receptor complexes. Therefore, force curves were analyzed for specific adhesion events to extract the kinetic and thermodynamic parameters describing the free energy landscape of the specific CD44 ligand–receptor bonds (Figure 7).
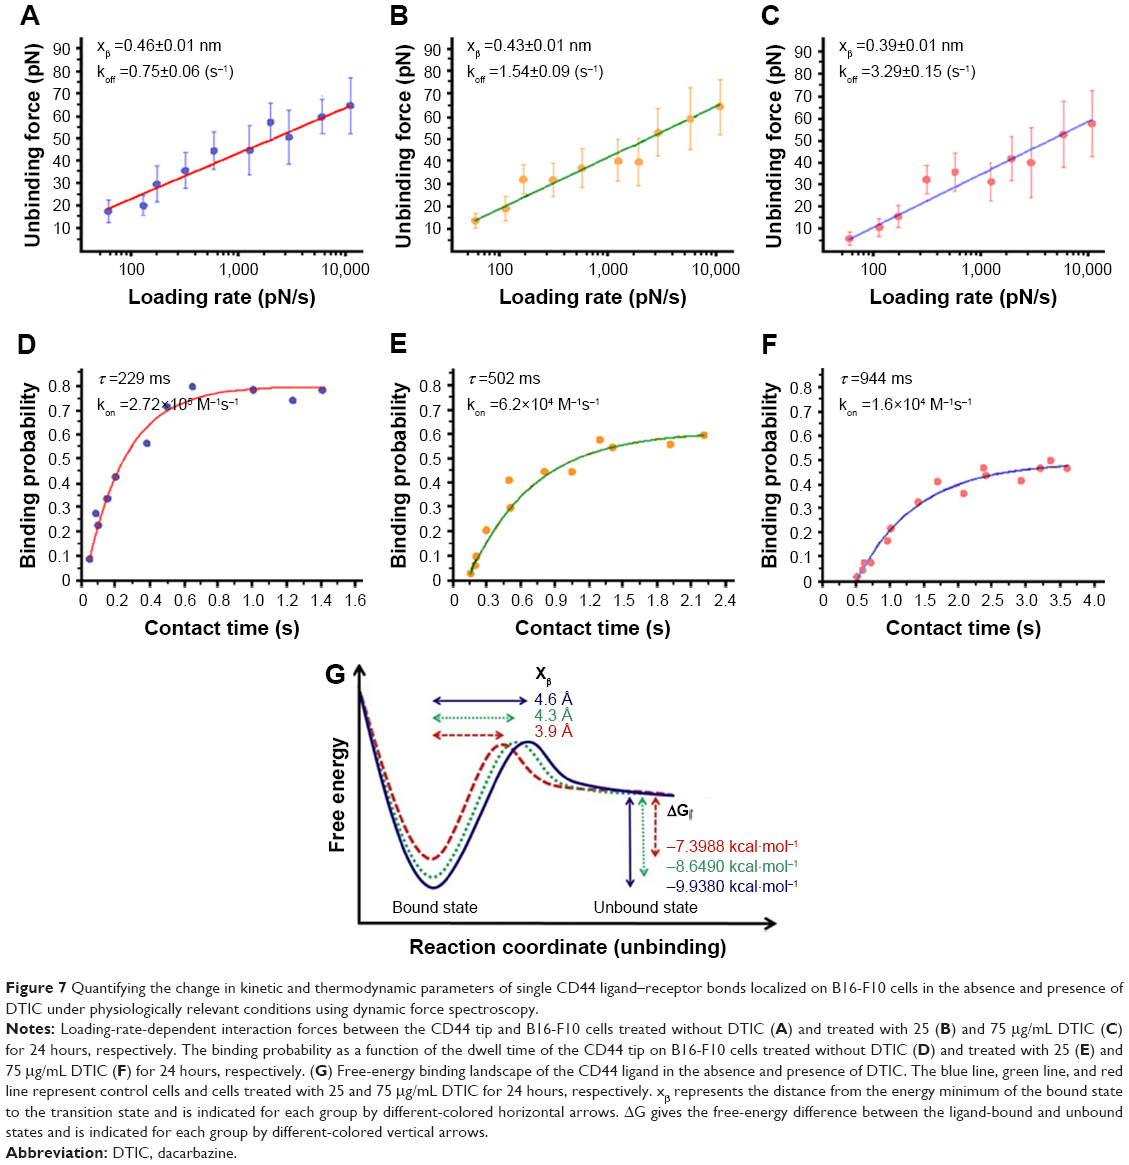 | Figure 7 Quantifying the change in kinetic and thermodynamic parameters of single CD44 ligand–receptor bonds localized on B16-F10 cells in the absence and presence of DTIC under physiologically relevant conditions using dynamic force spectroscopy. |
The rupture force of the CD44 ligand–receptor bond at different AFM loading rates was analyzed in melanoma cells either untreated or treated with DTIC at 25 and 75 μg/mL for 24 hours. The loading-rate-dependent rupture forces are plotted in Figure 7 and show a linear dependency of the most probable unbinding force (Fu) on the natural logarithm of loading rate (r). These collected data were fitted to Bell’s, Evan’s, and Ritchie’s models in equation (1) below:
| (1) |
where kB is the Boltzmann constant, T is temperature, koff is the kinetic off rate constant, and xβ is the distance from the energy minimum of the bound state to the transition state.63,64 This fit allowed extracting the CD44 ligand–receptor kinetic bond rupture parameters, such as the dissociation rate koff and the energy barrier width xβ (nm), both in control and DTIC-treated groups. As shown in Figure 7A–C, the calculated dissociation rate under zero force without applied force (k0off) was 0.75±0.06 s−1 for untreated cells, 1.54±0.09 s−1, and 3.29±0.15 s−1 for cells treated with DTIC at 25 and 75 μg/mL, respectively, for 24 hours. The larger dissociation rate of CD44 ligand–receptor complexes of DTIC-treated melanoma cells can be attributed to complex instability after DTIC treatment, suggesting that DTIC treatment lowers the stability of CD44 ligand–receptor complexes. Furthermore, when the concentration of DTIC was increased, stability was further lowered.
The change in kinetic on-rate, kon, was evaluated for control cells and DTIC-treated cells by varying the dwell time of the CD44 antibody-functionalized tip on cell surfaces, thereby determining binding probability (Figure 7D–F). The binding probability is determined as the percentage of force spectra exhibiting specific rupture events. The experimental results in Figure 7D–F indicate that longer dwell time results in a higher binding probability until a saturation plateau is reached. The binding probability in DTIC-treated groups reduced gradually when compared to control groups, even though the contact time was adequate (Figure 7D–F). The characteristic interaction time τ was obtained from a single exponential fit equation (2):
| (2) |
where t0 is the lag time, t is the dwell time, P is the binding probability, and A is the maximum observed binding probability.65 The association rate kon was then derived from τ using equation (3):
| (3) |

where ceff is the effective concentration of CD44 antibody on the AFM tip, which describes the number of binding partners within the effective volume Veff with radius reff.66 The effective radius in this measurement is estimated as the sum of the linker length and the CD44 antibody length (about 20 amino acids) in equilibrium, 8.5 nm. The measured kon values were 2.72×10⁵ M−1s−1 for the CD44 ligand–receptor on control melanoma cells and 6.2×10⁴ M−1s−1, 1.6×10⁴ M−1s−1 for 25 and 75 μg/mL DTIC-treated cells, respectively (Figure 7D–F). Treatment with different concentrations of DTIC reduced the rate to four- to seventeenfold. The lower on rate of CD44 ligand for membrane receptor on DTIC treated cells suggests that longer incubations are required to reach equilibrium. With the dissociation rate determined above, dissociation constant for CD44 ligand–receptor was calculated (Kd = koff/kon) at 2.8 μM for control cells and 24.79 and 205 μM for cells treated with 25 and 75 μg/mL DTIC, respectively, for 24 hours. These data demonstrate that lower-affinity interactions of CD44 ligand–receptor complexes on DTIC-treated cells are comparable to that of control cells. DTIC causes a surprising decrease in CD44 ligand–receptor stability.
The unbinding, or the dissociation of the bound pair, can be regarded as a thermally assisted barrier-crossing event, in which the external force tilts the dissociation energy barrier and thus facilitates the unbinding. The energy barrier width xβ showed variations between the control group and the 75 μg/mL DTIC-treated group (Figure 7G). ΔG, the free-energy difference between the bound and unbound state, is a significant thermodynamic parameter for the study of ligand–receptor interaction. The change in CD44 ligand-binding free energy on melanoma cells before and after DTIC treatment can be estimated by the relation between ΔG and Kd in equation (4):
| (4) |
where 0.018 L/mol is the partial molar volume of water.67 The dissociation constant Kd of 2.8 μM for CD44 ligand–receptor complex on native control cells corresponds to the binding free energy ΔG of −9.94 kcal/mol (Figure 7G). As expected, treatment of cells with DTIC at 25 μg/mL dropped the free energy of CD44 ligand binding to −8.65 kcal/mol and reduced affinity to 24.79 μM (Figure 7G). The lower affinity of Kd =205 μM for CD44 ligand binding on cells treated with 75 μg/mL DTIC further reduced binding free energy to −7.39 kcal/mol (Figure 7G). By use of the parameters determined for CD44 binding to the native membrane receptor, a free-energy landscape was reconstructed for each of the groups. The free-energy barrier separating the CD44 receptor-bound state from the unbound state was much larger for the control cells, forming a wider free-energy valley. For the DTIC-treated groups, smaller free energy (or affinity) stabilized the CD44 ligand–receptor bond, reducing distance to the transition state, and narrowing the energy valley. These results demonstrate the CD44 ligand–receptor complexes on the surface of DTIC-treated melanoma cells to be less stable than those on the surface of untreated melanoma cells.
Taken together, the SMFS results (Figure 6) demonstrate no obvious influence of DTIC on the unbinding force between CD44 ligand and receptors on the surface of melanoma cells. This was the case even when CD44 nanodomains were significantly altered after DTIC treatment. However, DTIC did perturb the kinetic and thermodynamic interactions of the CD44 ligand–receptor, which manifested as a larger dissociation rate, lower affinity, lower binding free energy, and narrower energy valley of the free-energy landscape compared to the control group (Figure 7). The affinity of the CD44 ligand for membrane receptors seems to be modulated by: CD44 receptor clustering, post-translational modifications (eg, alterations in glycosylation of the extracellular domains and the phosphorylation of specific serine residues in the cytoplasmic tail of CD44), changes in the structure and conformation of membrane receptors, the heterogeneous lipid composition of the membrane, and intracellular interactions with, for example, the cytoskeleton.1,2,18,61,62 AFM-based analysis demonstrated the cell membrane to become heterogeneous, with some umbilications and surface damage, lamellipodia to be contracted, and the cytoskeleton and biomechanics to become disrupted (64% decrease in elasticity and 48% decrease in specific adhesion) (Figures 2–5). However, when the cellular CD44 binding sites were blocked, the cytoskeleton was partly protected, with cell elasticity and specific adhesion force decreased by ~44% and 35%, respectively (Figure 5). Immunofluorescence, FCM, and in situ single-molecule recognition experiments demonstrated that DTIC inhibited CD44 expression and altered the CD44 nanocluster distribution and size (Figures 1 and 6). Decreased CD44 nanoclusters, the cytoskeleton alterations, the modifications of cell membrane ultrastructure, and nanomechanical properties induced by DTIC correlated with the lower affinity of the CD44 ligand for membrane receptors on melanoma cells treated with DTIC, which may in turn limit the amount of free energy that can be generated by the interaction. Modulation of the binding affinity of CD44 is important for cellular adhesion, proliferation, apoptosis, migration, tumor metastasis, and signal transduction.1–4 Previously, serial-triggering and kinetic proofreading models of cell activation suggested that very high affinity (less than or equal to a few nanomolar) would be detrimental to the signaling process.68 On the other hand, very low affinity, in the millimolar range for nonaffinity ligands, leads to antagonist activity.68 High expression levels of CD44 correlate with poor prognosis for melanoma patients, and increased levels of soluble CD44s and soluble CD44v in the circulation of cancer patients have been considered as prognostic markers of disease progression.7 The Kd of 2.8 μM for CD44 in the control group is a moderate affinity, which can fully activate the CD44 receptor, resulting in intracellular signaling, triggering cellular responses (eg, proliferation and tumor metastasis), or passive adhesive function. Although the dissociation constant for CD44 increased approximately ninefold (Kd =24.79 μM) and seventyfold (Kd =205 μM) when melanoma cells were treated with 25 r 75 μg/mL DTIC, respectively, for 24 hours, the affinity remained in the micromolar range, rather than in the millimolar range of nonaffinity ligands. In addition, after cells were treated with 25 and 75 μg/mL DTIC for 24 hours, the reconstructed CD44 ligand-binding free-energy landscape exhibited changes and the CD44 ligand-binding free energy decreased from 9.94 for untreated cells to 8.65 and 7.39 kcal/mol, respectively (Figure 7G). These results indicate that the CD44 ligand–receptor complexes in DTIC-treated melanoma cells were less stable than those in control cells. Taken together, these results suggest that DTIC perturbs but does not completely inhibit the binding of the CD44 ligand for its membrane receptor; this behavior may therefore be associated with poor prognosis, as these cells are highly tumorigenic, often causing tumor relapse, metastases, and therapeutic resistance due to the moderate affinity of the CD44 ligand–receptor.
Conclusion
In the present study, dynamic force spectroscopy-based AFM was developed to investigate the effect of DTIC on binding strength and the free-energy landscape of CD44 ligand–receptors on native melanoma cells. In situ analysis structurally mapped the specific CD44 ligand-receptor binding events under physiological conditions. By using DTIC, an alkylating chemotherapeutic drug well known for its anti-metabolic activity, new insights at the single-molecule level were obtained for critical issues such as the visual changes in CD44 nanodomain distribution and size, as well as the CD44 ligand-binding process. This single-molecule study offers two important results. First, CD44 receptor proteins were demonstrated visually to concentrate in nanodomains, which were increased in number and were larger (50–300 nm in diameter) at cell borders versus the apical regions of cells. After DTIC treatment, the CD44 nanodomains decreased and became smaller. Second, we measured kinetic and thermodynamic parameters for individual CD44 receptor molecules in the absence and presence of DTIC, by means of SMFS combined with a theoretical approach that improved data analysis. As such, the CD44 ligand-binding free-energy landscape was reconstructed with high accuracy. As expected, cells treated with DTIC 25 μg/mL showed a drop in the free energy of CD44 ligand binding from −9.94 to −8.65 kcal/mol, reducing affinity from 2.8 to 24.79 μM. The lower affinity of Kd =205 μM for CD44 ligand-binding on cells treated with 75 μg/mL DTIC revealed a further reduction in binding free energy of −7.39 kcal/mol. These results indicate that the CD44 ligand–receptor complexes on DTIC-treated cells were less stable than those on control cells. The area-specific differences in CD44 receptor distribution and a moderate affinity correlated with enhanced cellular adhesion, proliferation, migration, tumor metastasis, and signal transduction. Although the dissociation constant for CD44 increased and the CD44 ligand-binding free energy decreased when melanoma cells were treated with different concentrations of DTIC for 24 hours, the affinity remained in the moderate micromolar range rather than the low millimolar range characteristic of nonaffinity ligands. This suggests that DTIC perturbs the kinetic and thermodynamic interaction of CD44 ligand binding and reduces the stability of the CD44 ligand–receptor complexes in DTIC-treated cell membranes, but does not completely inhibit the binding of the CD44 ligand to its membrane receptor. As such, CD44 receptor activation can occur, resulting in intracellular signaling and the triggering of cellular responses, which confer the potential for cell proliferation and metastasis. AFM-based nanoscopy from the perspective of biophysics demonstrate that DTIC shows only modest inhibitory activity for B16-F10 cells, and consequently this drug is not able to kill this sort of cancer cells in the concentration range investigated. Taken together, these results and the methodology established in this study not only offer thermodynamic and kinetic insight into the effect of DTIC on the CD44 ligand-binding process, at the single-molecule level, but also contribute to a better understanding of DTIC’s antitumor effects and, ultimately, to an improved prognosis for melanoma patients. This understanding can be used to guide targeted therapy and the construction of drug screening models that use visual trace analysis as a means by which to screen candidate chemotherapeutic drugs that may inhibit tumor invasion and metastasis.
Acknowledgments
We thank Dr Zhihong Liang at Jinan University (Guangzhou, China) for her technical help in AFM data acquisition. This work was supported by the National Natural Science Foundation of China (numbers 81171459, 31571030, 81602360, and 81672224).
Disclosure
The authors report no conflicts of interest in this work.
References
Ponta H, Sherman L, Herrlich PA. CD44: from adhesion molecules to signalling regulators. Nat Rev Mol Cell Bio. 2003;4(1):33. | ||
Iczkowski KA. Cell adhesion molecule CD44: its functional roles in prostate cancer. Am J Transl Res. 2010;3(1):1–7. | ||
Liu C, Kelnar K, Liu B, et al. The microRNA miR-34a inhibits prostate cancer stem cells and metastasis by directly repressing CD44. J Urology. 2011;186(4):211. | ||
Chu JE, Xia Y, Chinyee B, Goodale D, Croker AK, Allan AL. Lung-derived factors mediate breast cancer cell migration through CD44 receptor-ligand interactions in a novel ex vivo system for analysis of organ-specific soluble proteins. Neoplasia. 2014;16(2):180–191. | ||
Patrawala L, Calhoun T, Schneider-Broussard R, et al. Highly purified CD44(+) prostate cancer cells from xenograft human tumors are enriched in tumorigenic and metastatic progenitor cells. Oncogene. 2006;25(12):1696–1708. | ||
Ahrens T, Assmann V, Fieber C, et al. CD44 is the principal mediator of hyaluronic-acid-induced melanoma cell proliferation. J Invest Dermatol. 2001;116(1):93–101. | ||
Ahrens T, Sleeman JP, Schempp CM, et al. Soluble CD44 inhibits melanoma tumor growth by blocking cell surface CD44 binding to hyaluronic acid. Oncogene. 2001;20(26):3399–3408. | ||
Quintana E, Shackleton M, Sabel MS, Fullen DR, Johnson TM, Morrison SJ. Efficient tumour formation by single human melanoma cells. Nature. 2008;456(7222):593–598. | ||
Bald T, Quast T, Landsberg J, et al. Ultraviolet-radiation-induced inflammation promotes angiotropism and metastasis in melanoma. Nature. 2014;507(7490):109–113. | ||
Hao MZ, Song FJ, Du XL, et al. Advances in targeted therapy for unresectable melanoma: new drugs and combinations. Cancer Lett. 2015;359(1):1–8. | ||
Krall JA, Beyer EM, MacBeath G. High- and low-affinity epidermal growth factor receptor-ligand interactions activate distinct signaling pathways. PLoS One. 2011;6(1):e15945. | ||
Rudolph MG, Luz JG, Wilson IA. Structural and thermodynamic correlates of T cell signaling. Annu Rev Biophys Biomol Struct. 2002;31:121–149. | ||
Townson SA, Martinez-Hackert E, Greppi C, et al. Specificity and structure of a high affinity activin receptor-like kinase 1 (ALK1) signaling complex. J Biol Chem. 2012;287(33):27313–27325. | ||
Serrone L, Zeuli M, Sega FM, Cognetti F. Dacarbazine-based chemotherapy for metastatic melanoma: thirty-year experience overview. J Exp Clin Cancer Res. 2000;19(1):21–34. | ||
Davey RJ, van der Westhuizen A, Bowden NA. Metastatic melanoma treatment: combining old and new therapies. Crit Rev Oncol Hematol. 2016;98:242–253. | ||
Eggermont AMM, Kirkwood JM. Re-evaluating the role of dacarbazine in metastatic melanoma: what have we learned in 30 years? Eur J Cancer. 2004;40(12):1825–1836. | ||
Sachs JN, Engelman DM. Introduction to the membrane protein reviews: the interplay of structure, dynamics, and environment in membrane protein function. Annu Rev Biochem. 2006;75:707–712. | ||
Coskun U, Simons K. Cell membranes: the lipid perspective. Structure. 2011;19(11):1543–1548. | ||
Dawaliby R, Trubbia C, Delporte C, et al. Allosteric regulation of G protein-coupled receptor activity by phospholipids. Nat Chem Biol. 2016;12(1):35–39. | ||
Zhang L, Pi J, Shi Q, Cai J, Yang P, Liang Z. In situ single molecule detection of insulin receptors on erythrocytes from a type 1 diabetes ketoacidosis patient by atomic force microscopy. Analyst. 2015;140(21):7407–7416. | ||
Yue T, Park KH, Reese BE, et al. Quantifying drug-induced nanomechanics and mechanical effects to single cardiomyocytes for optimal drug administration to minimize cardiotoxicity. Langmuir. 2016;32(7):1909–1919. | ||
Raman A, Trigueros S, Cartagena A, et al. Mapping nanomechanical properties of live cells using multi-harmonic atomic force microscopy. Nat Nanotechnol. 2011;6(12):809–814. | ||
Cross SE, Jin YS, Lu QY, Rao JY, Gimzewski JK. Green tea extract selectively targets nanomechanics of live metastatic cancer cells. Nanotechnology. 2011;22(21):215101. | ||
Kwon HK, Lee JH, Shin HJ, Kim JH, Choi S. Structural and functional analysis of cell adhesion and nuclear envelope nano-topography in cell death. Sci Rep. 2015;5:15623. | ||
Strobl JS, Nikkhah M, Agah M. Actions of the anti-cancer drug suberoylanilide hydroxamic acid (SAHA) on human breast cancer cytoarchitecture in silicon microstructures. Biomaterials. 2010;31(27):7043–7050. | ||
Launspach M, Gries KI, Heinemann F, Huebner A, Fritz M, Radmacher M. Mapping nanomechanical properties of freshly grown, native, interlamellar organic sheets on flat pearl nacre. Acta Biomater. 2014;10(9):3986–3996. | ||
Bacharouche J, Degardin M, Jierry L, et al. Multivalency: influence of the residence time and the retraction rate on rupture forces measured by AFM. J Mater Chem B. 2015;3(9):1801–1812. | ||
Tsukita S, Oishi K, Sato N, Sagara J, Kawai A, Tsukita S. ERM family members as molecular linkers between the cell surface glycoprotein CD44 and actin-based cytoskeletons. J Cell Biol. 1994;126(2):391–401. | ||
Legg JW, Lewis CA, Parsons M, Ng T, Isacke CM. A novel PKC-regulated mechanism controls CD44-ezrin association and directional cell motility. Nat Cell Biol. 2002;4(6):399–407. | ||
Au NPB, Fang Y, Xi N, Lai KWC, Ma CHE. Probing for chemotherapy-induced peripheral neuropathy in live dorsal root ganglion neurons with atomic force microscopy. Nanomedicine. 2014;10(6):1323–1333. | ||
Khatibzadeh N, Gupta S, Farrell B, Brownell WE, Anvari B. Effects of cholesterol on nano-mechanical properties of the living cell plasma membrane. Soft Matter. 2012;8(32):8350–8360. | ||
Xiong Y, Lee AC, Suter DM, Lee GU. Topography and nanomechanics of live neuronal growth cones analyzed by atomic force microscopy. Biophys J. 2009;96(12):5060–5072. | ||
Wang SJ, Bourguignon LYW. Role of hyaluronan-mediated CD44 signaling in head and neck squamous cell carcinoma progression and chemoresistance. Am J Pathol. 2011;178(3):956–963. | ||
Schempp CM, Kirkin V, Simon-Haarhaus B, et al. Inhibition of tumour cell growth by hyperforin, a novel anticancer drug from St. John’s wort that acts by induction of apoptosis. Oncogene. 2002;21(8):1242–1250. | ||
Kepp O, Galluzzi L, Lipinski M, Yuan JY, Kroemer G. Cell death assays for drug discovery. Nat Rev Drug Discov. 2011;10(3):221–237. | ||
McMahon HT, Gallop JL. Membrane curvature and mechanisms of dynamic cell membrane remodelling. Nature. 2005;438(7068):590–596. | ||
Parssinen J, Alarmo EL, Khan S, Karhu R, Vihinen M, Kallionlemi A. Identification of differentially expressed genes after PPM1D silencing in breast cancer. Cancer Lett. 2008;259(1):61–70. | ||
Voitchovsky K, Contera SA, Kamihira M, Watts A, Ryan JF. Differential stiffness and lipid mobility in the leaflets of purple membranes. Biophys J. 2006;90(6):2075–2085. | ||
Sato K, Adachi T, Ueda D, Hojo M, Tomita Y. Measurement of local strain on cell membrane at initiation point of calcium signaling response to applied mechanical stimulus in osteoblastic cells. J Biomech. 2007;40(6):1246–1255. | ||
Oliferenko S, Kaverina I, Small JV, Huber LA. Brief report hyaluronic acid (HA) binding to CD44 activates Rac1 and induces lamellipodia outgrowth. J Cell Biol. 2000;148(6):1159. | ||
Mori H, Tomari T, Koshikawa N, et al. CD44 directs membrane-type 1 matrix metalloproteinase to lamellipodia by associating with its hemopexin-like domain. EMBO J. 2002;21(15):3949–3959. | ||
Stewart MP, Toyoda Y, Hyman AA, Müller DJ. Tracking mechanics and volume of globular cells with atomic force microscopy using a constant-height clamp. Nat Protoc. 2012;7(1):143–154. | ||
Ralhan R, Kaur J. Alkylating agents and cancer therapy. Expert Opin Ther Pat. 2007;17(9):1061–1075. | ||
Girasole M, Pompeo G, Cricenti A, et al. Roughness of the plasma membrane as an independent morphological parameter to study RBCs: a quantitative atomic force microscopy investigation. Biochim Biophys Acta. 2007;1768(5):1268–1276. | ||
Vasir JK, Labhasetwar V. Quantification of the force of nanoparticle-cell membrane interactions and its influence on intracellular trafficking of nanoparticles. Biomaterials. 2008;29(31):4244–4252. | ||
Zhang L, Yang F, Cai JY, Yang PH, Liang ZH. In-situ detection of resveratrol inhibition effect on epidermal growth factor receptor of living MCF-7 cells by atomic force microscopy. Biosens Bioelectron. 2014;56:271–277. | ||
Wu Y, McEwen GD, Harihar S, Baker SM, DeWald DB, Zhou A. BRMS1 expression alters the ultrastructural, biomechanical and biochemical properties of MDA-MB-435 human breast carcinoma cells: an AFM and Raman microspectroscopy study. Cancer Lett. 2010;293(1):82–91. | ||
Hu M, Wang J, Zhao H, Dong S, Cai J. Nanostructure and nanomechanics analysis of lymphocyte using AFM: from resting, activated to apoptosis. J Biomech. 2009;42(10):1513–1519. | ||
Eaton P, Zuzarte-Luis V, Mota MM, Santos NC, Prudencio M. Infection by plasmodium changes shape and stiffness of hepatic cells. Nanomedicine. 2012;8(1):17–19. | ||
Strange AP, Aguayo S, Ahmed T, et al. Quantitative nanohistological investigation of scleroderma: an atomic force microscopy-based approach to disease characterization. Int J Nanomedicine. 2017;12:411–420. | ||
Fletcher DA, Mullins D. Cell mechanics and the cytoskeleton. Nature. 2010;463(7280):485–492. | ||
Stolz M, Gottardi R, Raiteri R, et al. Early detection of aging cartilage and osteoarthritis in mice and patient samples using atomic force microscopy. Nat Nanotechnol. 2009;4(3):186–192. | ||
Orian-Rousseau V, Chen LF, Sleeman JP, Herrlich P, Ponta H. CD44 is required for two consecutive steps in HGF/c-Met signaling. Gene Dev. 2002;16(23):3074–3086. | ||
Plodinec M, Loparic M, Monnier CA, et al. The nanomechanical signature of breast cancer. Nat Nanotechnol. 2012;7(11):757–765. | ||
Ansardamavandi A, Tafazzoli-Shadpour M, Omidvar R, Jahanzad I. Quantification of effects of cancer on elastic properties of breast tissue by atomic force microscopy. J Mech Behav of Biomed. 2016;60:234–242. | ||
Jonas O, Mierke CT, Kas JA. Invasive cancer cell lines exhibit biomechanical properties that are distinct from their noninvasive counterparts. Soft Matter. 2011;7(24):11488–11495. | ||
Suresh S. Biomechanics and biophysics of cancer cells. Acta Biomater. 2007;3(4):413–438. | ||
Khan M, Maryam A, Qazi JI, Ma T. Targeting apoptosis and multiple signaling pathways with icariside II in cancer cells. Int J Biol Sci. 2015;11(9):1100–1112. | ||
Khan M, Maryam A, Zhang H, Mehmood T, Ma T. Killing cancer with platycodin D through multiple mechanisms. J Cell Mol Med. 2016;20(3):389–402. | ||
Guo JY, Hsu HS, Tyan SW, et al. Serglycin in tumor microenvironment promotes non-small cell lung cancer aggressiveness in a CD44-dependent manner. Oncogene. 2017;36(17):2457–2471. | ||
Suzuki T, Suzuki M, Ogino S, Umemoto R, Nishida N, Shimada I. Mechanical force effect on the two-state equilibrium of the hyaluronan-binding domain of CD44 in cell rolling. Proc Natl Acad Sci U S A. 2015;112(22):6991–6996. | ||
Wang A, Vijayraghavan K, Solgaard O, Butte MJ. Fast stiffness mapping of cells using high-bandwidth atomic force microscopy. ACS Nano. 2016;10(1):257–264. | ||
Bell GI. Models for the specific adhesion of cells to cells. Science (New York, NY). 1978;200(4342):618–627. | ||
Evans E, Ritchie K. Dynamic strength of molecular adhesion bonds. Biophys J. 1997;72(4):1541–1555. | ||
Huang X, Li X, Wang Q, Dai J, Hou J, Chen L. Single-molecule level binding force between collagen and collagen binding domain-growth factor conjugates. Biomaterials. 2013;34(26):6139–6146. | ||
Rankl C, Kienberger F, Wildling L, et al. Multiple receptors involved in human rhinovirus attachment to live cells. Proc Natl Acad Sci U S A. 2008;105(46):17778–17783. | ||
Wang M, Wang Z, Wang X, Wang S, Ding W, Gao C. Layer-by-layer assembly of aquaporin Z-incorporated biomimetic membranes for water purification. Environ Sci Technol. 2015;49(6):3761–3768. | ||
Holler PD, Holman PO, Shusta EV, O’Herrin S, Wittrup KD, Kranz DM. In vitro evolution of a T cell receptor with high affinity for peptide/MHC. Proc Natl Acad Sci U S A. 2000;97(10):5387–5392. |
Supplementary materials
Methods
Lactate dehydrogenase (LDH) leakage assay
Cells (1×10⁴ cells/well) were seeded in a 96-well plate and allowed to adhere overnight. They were then incubated with various concentrations of dacarbazine (DTIC) (25, 50, and 75 μg/mL) for 24, 48, or 72 hours. Cells were collected and washed twice with PBS at each time point. As negative control, we used the medium of cells incubated without DTIC. For the positive control, we removed the medium (200 mL) and added Triton X-100 solution (20 mL, 0.5% in water) to the cells. LDH analysis was carried out according to the manufacturer’s instructions of LDH Cytotoxicity Assay Kit (C0017; Beyotime Biotechnology, Shanghai, China). The absorbance of each well was read at 490 nm with MK3 Absorbance Microplate Reader (Thermo Electron Corporation, USA).
Cell cycle analysis
The cells (2×10⁵ cells/well) of the control and those treated with 25, 50 and 75 μg/mL DTIC for 24 hours were harvested and then fixed in 70% ethanol overnight at 4°C. The cells were then washed with phosphate-buffered saline, resuspended in propidium iodide (50 mg/mL), and treated for 15 minutes at room temperature. Cell cycle analysis was performed by flow cytometry and Cell Quest software.
The additional control experiment for immunofluorescence imaging of the cytoskeletal proteins F-actin and tubulin
The B16-F10 cells were pretreated with 20 μg/mL of anti-CD44 antibodies for 12 hours before exposure to 50 μg/mL DTIC for 24 hours. The cytoskeletal proteins F-actin and tubulin of the cells were labeled with the procedures in the text.
Atomic force microscopy (AFM) additional control experiments
For CD44 molecule recognition, as controls for tip modification, bare tips and BSA-modified tips were also conducted on B16-F10 cells to obtain force curves. The immobilization of BSA on the tips were done by the same procedures in the text. Blocking experiments were performed with anti-CD44 antibodies solution (20 μg/mL).
During nanomechanical properties detection, CD44 blocking experiments were also carried out. To exclude a possible coincidental correlation, the B16-F10 cells were pretreated with another antibody CD34 before exposure to 50 μg/mL DTIC for 24 h. These cells were then used for AFM force spectroscopy measurement in Hank’s solution.
Elastic indentation model fitting
To determine the elastic modulus of the cells, we applied the Hertz model in which the force (F) versus indentation (δ) curves were fitted with the equation:
| (S1) |
| (S2) |

| (S3) |

| (S4) |
The Hertz model is widely used in the literature for a spherical shape probe in equation (S1), where z and d are the displacement of the AFM tip in z-axis and the deflection of the AFM cantilever, respectively. The loading force (F) was calculated according to Hooke’s law by multiplying the spring constant (k) by the deflection of the AFM tip as shown in equation (S2). The spring constant was 0.077 N/m, which was determined using the thermal noise method. The indentation depth (δ) was calculated by subtracting deflection from the displacement of the AFM tip as shown in equation (S3). In this model, the cell is treated as a semisphere of radius Rcell, Rprobe =2.0 μm.
Results
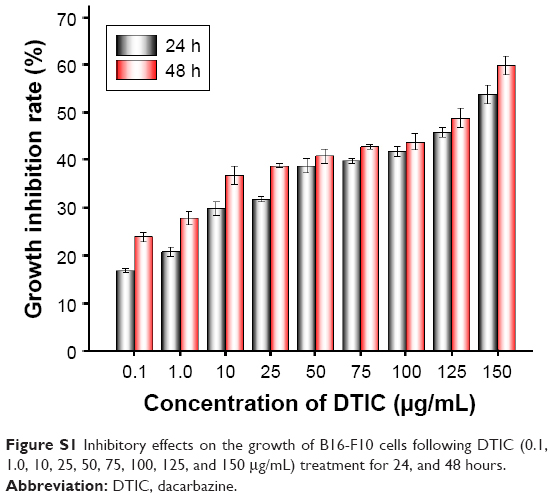 | Figure S1 Inhibitory effects on the growth of B16-F10 cells following DTIC (0.1, 1.0, 10, 25, 50, 75, 100, 125, and 150 μg/mL) treatment for 24, and 48 hours. |
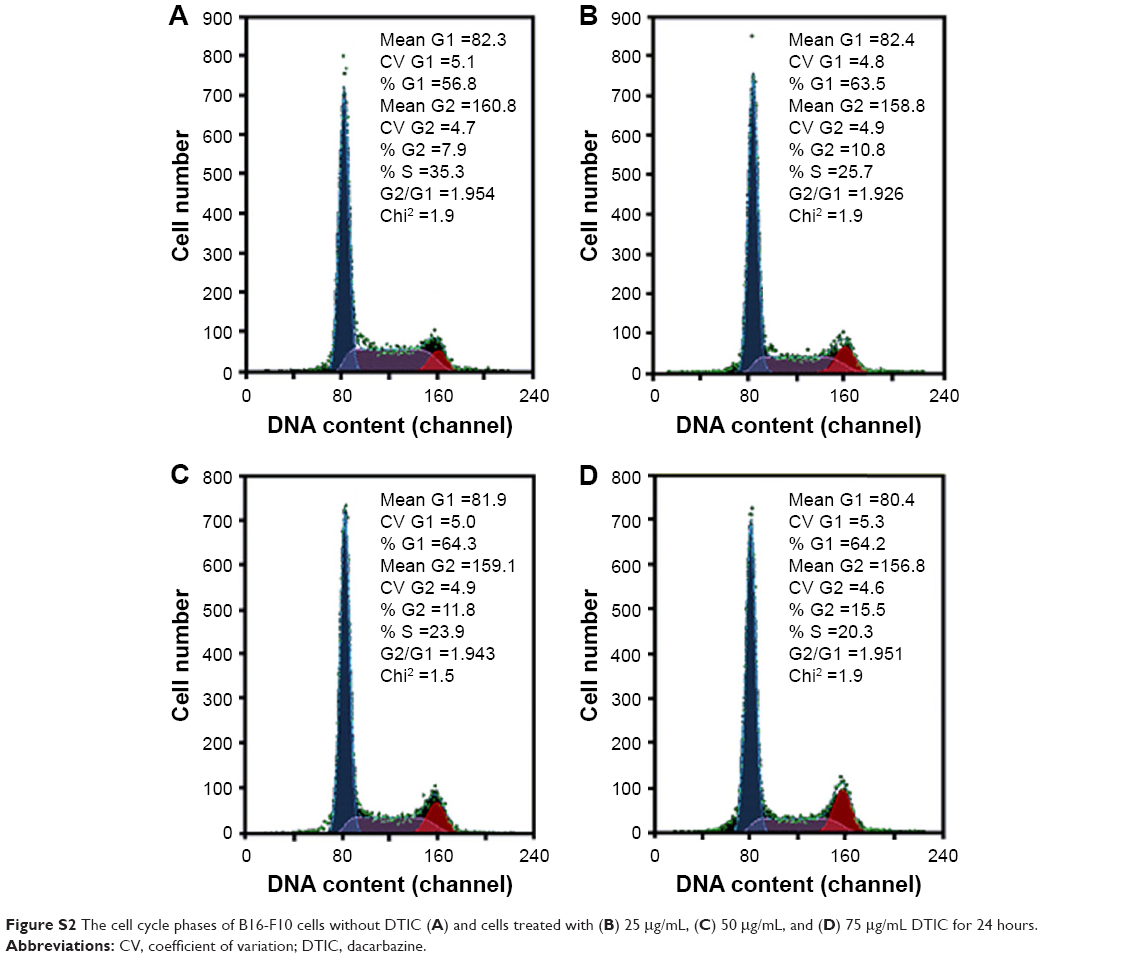 | Figure S2 The cell cycle phases of B16-F10 cells without DTIC (A) and cells treated with (B) 25 μg/mL, (C) 50 μg/mL, and (D) 75 μg/mL DTIC for 24 hours. |
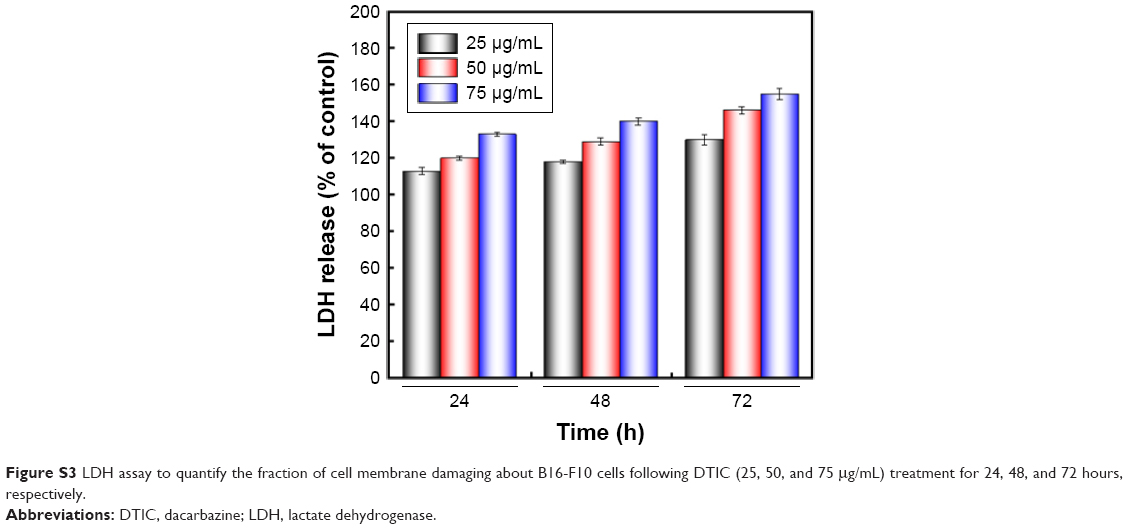 | Figure S3 LDH assay to quantify the fraction of cell membrane damaging about B16-F10 cells following DTIC (25, 50, and 75 μg/mL) treatment for 24, 48, and 72 hours, respectively. |
 © 2017 The Author(s). This work is published and licensed by Dove Medical Press Limited. The full terms of this license are available at https://www.dovepress.com/terms.php and incorporate the Creative Commons Attribution - Non Commercial (unported, v3.0) License.
By accessing the work you hereby accept the Terms. Non-commercial uses of the work are permitted without any further permission from Dove Medical Press Limited, provided the work is properly attributed. For permission for commercial use of this work, please see paragraphs 4.2 and 5 of our Terms.
© 2017 The Author(s). This work is published and licensed by Dove Medical Press Limited. The full terms of this license are available at https://www.dovepress.com/terms.php and incorporate the Creative Commons Attribution - Non Commercial (unported, v3.0) License.
By accessing the work you hereby accept the Terms. Non-commercial uses of the work are permitted without any further permission from Dove Medical Press Limited, provided the work is properly attributed. For permission for commercial use of this work, please see paragraphs 4.2 and 5 of our Terms.