Back to Journals » Diabetes, Metabolic Syndrome and Obesity » Volume 7
Effect of BMI on cardiovascular and metabolic syndrome risk factors in an Appalachian pediatric population
Authors Weber K, Fischl A, Murray P, Conway B ![]()
Received 23 May 2014
Accepted for publication 2 July 2014
Published 25 September 2014 Volume 2014:7 Pages 445—453
DOI https://doi.org/10.2147/DMSO.S68283
Checked for plagiarism Yes
Review by Single anonymous peer review
Peer reviewer comments 3
Katelynn E Weber,1 Andrea FR Fischl,2 Pamela J Murray,3 Baqiyyah N Conway1
1Department of Epidemiology, West Virginia University, Morgantown, WV, USA; 2University of Pittsburgh School of Nursing, Pittsburgh, PA, USA; 3Department of Pediatrics, West Virginia University, Morgantown, WV, USA
Background: The purpose of this study was to characterize cardiovascular risk factors in a rural pediatric population by body mass index (BMI) category and the presence of the metabolic syndrome.
Methods: Data on 13,018 children and adolescents (aged younger than 20 years) from West Virginia and Ohio in 2005–2006 were obtained from the C8 Health Project to determine the prevalence of overweight/obesity and the metabolic syndrome, which was then compared with National Health and Nutrition Examination Survey 2005–2006 data. Cardiovascular risk factors were assessed by age-standardized and sex-standardized BMI category (<85th, 85th–95th, >95th percentiles) and the presence of metabolic syndrome, defined as the presence of three or more of the following criteria: BMI >97th percentile, triglycerides >110 mg/dL, high-density lipoprotein cholesterol <40 mg/dL, and fasting blood glucose >110 mg/dL.
Results: The population was 51% male and 95% white. The prevalence of overweight/obesity was 38% and metabolic syndrome was 4.6% in the C8 population, compared with a prevalence of 30% and 3.4%, respectively, within the National Health and Nutrition Examination Survey population. In our Appalachian population, a significant adverse trend across BMI categories was observed for lipids, insulin, inflammatory markers, white blood cell count, and C-reactive protein. Significant differences in these risk factors were seen among those with metabolic syndrome compared with those without metabolic syndrome.
Conclusion: The increased prevalence of overweight/obesity and the metabolic syndrome along with the increase in cardiovascular risk factors in Appalachian children and adolescents, suggests a cohort that may develop earlier onset and possibly increased severity of cardiovascular disease and other complications associated with metabolic syndrome and obesity.
Keywords: body mass index, cardiovascular, metabolic syndrome, risk factors, pediatric population, Appalachian
Introduction
Childhood obesity has become an epidemic in the USA. Recent reports indicate that 17% of children and adolescents aged 2–19 years are obese, with a body mass index (BMI) category over the 95th percentile.1 These vary by race, geographic location in the USA, and family socioeconomic status. Obesity is more prevalent among non-Hispanic blacks2 and in rural populations in the eastern USA.3
Metabolic syndrome is defined as a cluster of related risk factors in adults and children that includes central adiposity, dyslipidemia, glucose intolerance, and hypertension.4 These conditions often predict chronic diseases in adulthood, such as cardiovascular disease, diabetes, and kidney disease. Earlier onset of metabolic syndrome can intensify complications already associated with obesity.5 Recent studies have indicated an association between cardiovascular disease and perfluorooctanoic acid (PFOA) in adults and children.6
Children and adolescents classified as overweight or obese exhibit an increase in cardiovascular and metabolic risk factors when compared with those of normal weight,7 which places them at increased risk for many serious health conditions, including cardiovascular disease and type 2 diabetes.8 Changes in BMI and central adiposity in youth positively correlate with changes in cardiometabolic risk factors,9 which become increasingly more detrimental in the most extreme BMI categories.10
PFOA, also known as C8, is a ubiquitous, degradation-resistant, bioaccumulating environmental toxin used extensively for industrial purposes and has been found in human tissues worldwide. Emerging evidence suggests that adverse endocrine effects through activation of the peroxisome proliferator-activated receptor alpha may affect growth and development, leading to obesity.11 Children appear to harbor greater concentrations of the chemical in their tissues than adults.12
The objective of this study was to determine the prevalence of overweight/obesity and the metabolic syndrome among a rural, predominantly white pediatric population in Appalachia exposed to C8 contamination of drinking water. Cardiovascular and metabolic risk factors were determined by BMI category and metabolic syndrome status. As there is evidence that C8 may have effects on cardiovascular and metabolic risk factors, we investigated the general association of C8 with age-standardized and sex-standardized BMI percentile, cardiovascular risk factors, and metabolic syndrome risk factors before conducting the main analysis.
Research design and methods
The C8 Health Project is a cross-sectional community-based health survey that was created as part of a settlement agreement in the case of “Jack W Leach, et al. v. E.I. du Pont de Nemours and Company” following PFOA contamination of six drinking water districts that occurred between 1950 and 2004 in the mid-Ohio Valley. The population-wide health study resulted from a post hoc agreement between the settling parties to determine a potential link between PFOA exposure and human disease. Data collection and consenting was administered by Brookmar Inc., Parkersburg, WV, USA. Additional consent and release forms were administered by the phlebotomy laboratory contracted to obtain blood samples. Participants aged 18 years and older and those under 18 years but independent from their parents were allowed to take the survey on their own. A parent or legal guardian was required to answer the survey for dependent minors.13 We obtained institutional review board approval at West Virginia University for access to the deidentified data.
The methods used for enrollment and data collection have been described in detail previously.13 The study population consisted of 13,018 children and adolescents from rural Ohio and West Virginia. The deidentified data was obtained from a total of 14,573 children and adolescents under the age of 20 years enrolled in the C8 Health Project in 2005 and 2006. Individuals with missing information on BMI percentile (n=1,390) or whose BMI percentile was an outlier (n=165) were excluded from analysis, resulting in a main study population of 13,018 children and adolescents. For analysis of the prevalence of metabolic syndrome, an additional 1,408 children and adolescents with missing information on two or more metabolic syndrome criteria were excluded, resulting in 11,610 children and adolescents for analysis.
Data were collected via health survey, self-reported or parent-reported anthropometric measurements, a blood sample, and a medical chart review for all eligible participants. A variety of self-reported medical diagnoses were confirmed through review of supporting medical documentation obtained from health care providers by survey staff. Clinical laboratory tests included serum lipid, immune, and inflammatory markers; liver, kidney, and thyroid function; blood count; serum electrolytes and protein; and endocrine laboratory tests. For clinical tests, serum was separated from red blood cells, placed in transport tubes, and refrigerated prior to shipping to a single, accredited national laboratory. Total cholesterol, high-density lipoprotein cholesterol (HDL), and triglycerides were measured enzymatically. Low-density lipoprotein cholesterol (LDL) was calculated by the Friedewald equation when triglycerides were less than 400.
Analyses of perfluoroalkyl acid compounds (PFAA), including PFOA, were conducted at a single commercial laboratory. Serum from the blood sample was separated for a broad range of clinical laboratory testing and for PFAA analysis, and shipped on dry ice to the analysis laboratory. PFAA assays deployed a protein precipitation extraction method with reverse phase high-performance liquid chromatography/tandem mass spectrometry. Detection relied on a triple quadrupole mass spectrometer in preselected reaction monitoring mode, monitoring for the M/Z transitions of ten PFAA species with an internal 13C PFAA standard corresponding to the target compound. Assay results were transferred to the C8 Health Project’s Windows-based information system.
BMI percentiles adjusted for age and sex were calculated using an SAS program based on the year 2000 growth charts obtained from the Centers for Disease Control and Prevention (CDC) website for growth chart training.14 The BMI categories included <85th percentile as normal, 85th–95th as overweight, and >95th as obese.15 Participants with diabetes (n=114) were included in the analyses. Because fasting was not required of participants, self-reported fasting duration collected via survey was used to determine fasting status for glucose and insulin levels. Individuals with a 6-hour or greater fast were categorized as fasting and individuals with less than a 6-hour fast were categorized as non-fasting.
The metabolic syndrome was determined based on published criteria for diagnosis in a pediatric population.5 Although a unified definition of the metabolic syndrome appropriate for children and adolescents does not exist, a study in 2004 concluded that criteria included a BMI >97th percentile, triglycerides greater than 110 mg/dL, HDL cholesterol less than 40 mg/dL, systolic/diastolic blood pressure >90th percentile for age, sex, and height, fasting blood glucose >110 mg/dL or 2-hour oral glucose tolerance test >140 mg/dL, and a waist circumference >90th percentile in boys or ≥90th percentile in girls. Similar to adult criteria, the presence of three or more criteria indicated the presence of the metabolic syndrome in children.5 We did not have data on blood pressure, the oral glucose tolerance test, or waist circumference, and thus for our population we defined the metabolic syndrome by the presence of three of the four remaining factors: BMI >97th percentile, triglycerides >110 mg/dL, HDL cholesterol <40 mg/dL, and fasting blood glucose >110 mg/dL.
For comparison of the C8 population with the national population, the 2005–2006 National Health and Nutrition Examination Survey (NHANES) was obtained from the CDC website (n=10,348). All individuals aged 20 years and older in NHANES were excluded from the analysis (n=4,979), as well as those for whom data on BMI were not available (n=1,100) or BMI was an outlier (n=29), leaving 4,240 individuals on whom further analyses were then based. An additional 3,321 individuals with missing data on two or more of the necessary criteria for determining metabolic syndrome were excluded from all analyses on prevalence and risk factors of metabolic syndrome, leaving 948 individuals on whom these analyses were based. BMI percentiles for age and sex were calculated using the same SAS program as the C8 population based on the year 2000 CDC growth charts.14 BMI percentiles were then categorized into the same categories as the C8 population for normal, overweight, and obese.
Characteristics of the C8 study population were stratified by BMI category (normal, overweight, obese) and the presence of the metabolic syndrome. Mean BMI percentile and prevalence of the metabolic syndrome in the C8 population was compared with that from NHANES data and confidence intervals were used to assess significance. All variables of interest were tested for correlation with serum C8 levels at each category of BMI percentile to determine if serum C8 levels had any effect on biomarkers. Biomarkers of interest included: serum C8 levels; fasting and non-fasting serum glucose; total, HDL, LDL, and very low-density lipoprotein (VLDL) cholesterol; triglycerides; serum creatinine; white blood cell count; serum albumin; C-reactive protein; and testosterone. We decided a priori that any variable correlated with C8 (r≥0.3, P<0.05) would be adjusted for C8 in the analyses with BMI and the metabolic syndrome.
All statistical analyses were conducted using SAS version 9.3 (SAS Institute, Cary, NC, USA) or R (R Core Team; R Foundation for Statistical Computing, Vienna, Austria). Statistics reported were descriptive in nature and are reported as the mean (standard error of the mean [SEM]), frequency (percent), or Pearson’s or Spearman’s correlations. Some variables were adjusted for age using a general linear model and least square means; these variables are denoted in the tables. Continuous variables were tested for trend using a test of linearity in the general linear model. Categorical variables were tested for trend using the Cochran–Armitage trend test. The difference between least square means was calculated within a general linear model to test for differences in continuous variables by metabolic syndrome status and the Pearson chi-square test was used to test for differences in categorical variables. P<0.05 was considered to be statistically significant.
Results
Of 13,018 children and adolescents, 95% were white and 51% were male. The mean age was 12.9 (range 1–19; SEM 0.04) years. Thirty-eight percent (n=4,925) were either overweight or obese. Overweight individuals made up 17% of the study population and another 21% were obese.
Figure 1 shows the distribution of BMI in our C8-exposed population compared with the 2005–2006 general population (NHANES). Mean BMI within the C8 population was at the 65.4th percentile (SEM 0.27). Mean BMI for the 2005–2006 NHANES population of individuals between one and 19 years of age was at the 61.4th percentile (SEM 1.09). Approximately 30% (n=1,439) of the NHANES population was either overweight or obese according to the same BMI percentile categories as the C8 population.
 | Figure 1 Proportion of individuals from C8 Health Project and NHANES data by BMI percentile. The proportion of individuals within each BMI percentile from the NHANES and C8 populations were plotted in an overlaid histogram. The bottom area of each bar shaded darkest gray is where the two populations overlap. The top portion of each bar that is a lighter gray is the proportion that is greater among the C8 population, and the lightest gray is the proportion that is greater among the NHANES population. |
Table 1 presents the characteristics of the C8-exposed pediatric population stratified by BMI category. Approximately 20% in each BMI category reported an average household income of less than $10,000 a year. Age decreased across BMI categories, indicating a greater prevalence of overweight and obesity at younger ages. A significant increase was seen in total, LDL, and VLDL cholesterol, and triglycerides as BMI category increased. Conversely, HDL cholesterol significantly decreased as BMI category increased. Although no association was observed for fasting glucose, non-fasting glucose and fasting insulin increased significantly with BMI category. The inflammatory markers of white blood cell count and C-reactive protein both increased across BMI categories, and serum albumin decreased across BMI categories. Finally, serum C8 levels did not significantly change across BMI categories. Table 2 shows that none of the variables in Table 1 were substantially correlated with serum C8 concentration, so analyses were not adjusted for C8.
 | Table 1 Characteristics of population by BMI category, mean (SEM) or n (%), adjusted for age |
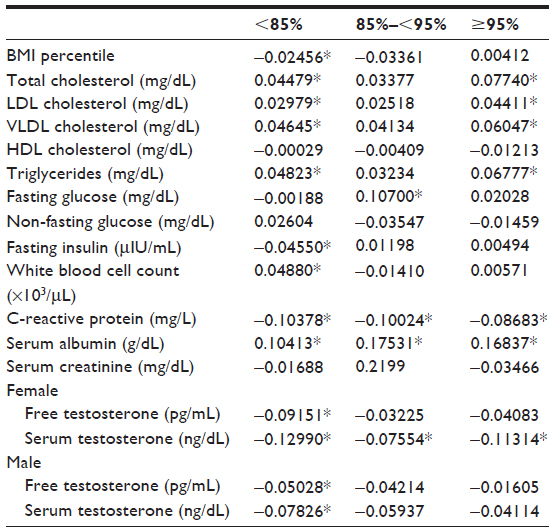 | Table 2 Correlations with C8 (Spearman rank correlation coefficient) |
The metabolic syndrome was observed in 4.64% of the C8 study participants. Characteristics of the study population by metabolic syndrome status are presented in Table 3. The majority of individuals with metabolic syndrome (97.2%, n=524) were found among those with a BMI category greater than the 95th percentile. Despite the greater prevalence of overweight and obesity among younger individuals in the overall pediatric population, those with metabolic syndrome tended to be older than non-cases, suggesting that despite earlier onset of overweight and obesity among our population, the children did not present with metabolic syndrome until they were slightly older. Consistent with the inclusion criteria for the metabolic syndrome, cases tended to have a less favorable lipid profile and more glycemia (mean glucose 97.8 mg/dL, SEM 0.88) than non-cases (mean glucose 90.4 mg/dL, SEM 0.20). Fasting insulin was three times higher in those with the metabolic syndrome than in non-cases. Age-adjusted serum insulin and testosterone were also higher in cases than in non-cases.
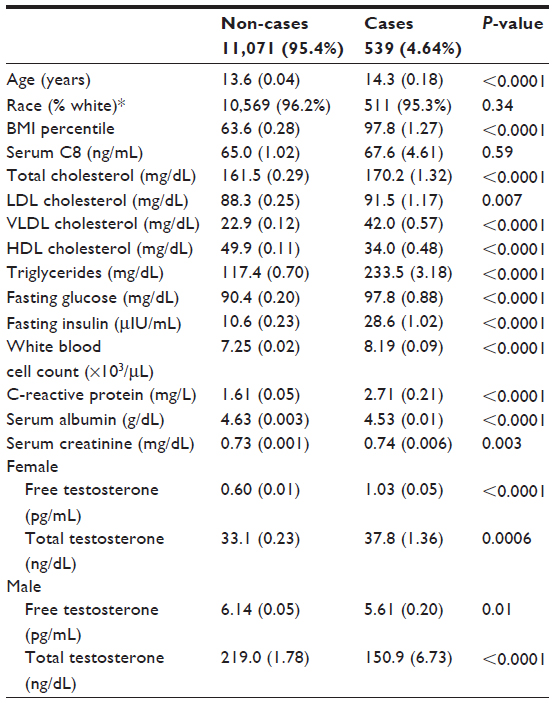 | Table 3 Characteristics of population by metabolic syndrome, mean (SEM), adjusted for age |
Table 4 displays the mean age, mean BMI percentile, and prevalence of the metabolic syndrome in the C8 pediatric population compared with that in the 2005–2006 NHANES population. Compared with the 4.64% prevalence of metabolic syndrome in the C8 population, 3.40% (n=31) of the 943 qualifying NHANES study participants were classified as having the metabolic syndrome when the same criteria for the metabolic syndrome was used as in the C8 population. Similar to the C8 population, the majority (90.6%) of those with the metabolic syndrome in the NHANES population were classified as obese.
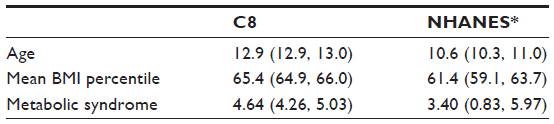 | Table 4 C8 and NHANES population comparisons, mean (95% CLM) or percent (95% confidence interval) |
Discussion
In this report we characterized a rural and primarily white population for cardiovascular and diabetes risk factors. We also investigated the association between C8, an environmental toxin, and several metabolic and cardiovascular risk factors. While we did not see a substantial effect of C8 on BMI percentile or any of the other risk factors, our findings revealed an alarmingly high prevalence of overweight and obesity in this pediatric Appalachian population. Furthermore, cardiovascular and metabolic syndrome risk factors were more severe as BMI category increased. The prevalence of the metabolic syndrome was approximately 1.5 times higher than that observed nationally, with a much higher prevalence among those classified as obese.
We observed a significantly higher prevalence of overweight and obesity in our study population than what has been observed in other US pediatric populations. Approximately 30% of children and adolescents in the USA are overweight or obese.16 The NHANES prevalence of overweight and obesity among children and adolescents, from approximately the same time period as the C8 study (2005–2006), was 30%. Although similar to the national prevalence quoted by Ogden et al,16 the NHANES prevalence was still much less than the 38% prevalence found in the C8 population. Data on the effects of overweight and obesity among rural pediatric populations are limited; however, our results are comparable with those of similar studies in which rates of overweight and obesity are as high as 40% among rural children.17 Tambalis et al found a higher prevalence of obesity (12%) among rural children compared with 11% among urban children in a national study of children in Greece.18 Joens-Matre et al found a 25% rate of obesity and 40% risk of overweight among school-aged children in a region in rural Iowa that was approximately 90% white and with 40% being of low socioeconomic status.19 Our study, with an observed pediatric obesity prevalence of 21%, further demonstrates these very high rates of obesity among rural white children.
While much attention has been focused on national data or disparities among ethnic groups primarily dwelling in urban areas, recent epidemiological evidence is indicative of higher rates of obesity among rural populations in the USA compared with more urban areas.19,20 Murray et al have argued that distinct epidemiological subgroups exist in the USA that warrant tailored research and interventions.21 Additionally, the magnitude of individual risk factors differs between each subgroup, and the subgroups with poor health are not limited to high-risk urban environments, which is the focus of most research.21
Not only is the prevalence of BMI high among our population, but as BMI among these children and adolescents increases, the severity of cardiometabolic risk factors worsens. Additionally, significant negative linear trends were seen for HDL cholesterol and serum albumin as BMI category increased. These trends for worsening risk factors with increasing BMI were similar to what has been seen in many studies on obesity.22,23 However, the degree of elevation of risk factors (or in some cases, depression of protective factors) associated with cardiovascular and metabolic risk was much greater than what has previously been seen among children and adolescents.7,24,25 For example, total cholesterol, LDL cholesterol, triglycerides, and both fasting and non-fasting glucose were more elevated at all levels of BMI category in our population compared with other studies in children and adolescents.7,24 In some instances, we report levels twice as high as seen in other studies.25 A study in rural Georgia yielded similar results to ours, and found that youths in rural areas are more likely to be overweight or obese and that white children had significantly higher triglycerides and lower HDL cholesterol than black children.22
C-reactive protein levels among our study population were doubled among those who were obese when compared with those of normal weight and about 1.5-fold higher among those with metabolic syndrome when compared with those without. Elevation of C-reactive protein levels is related to the risk of cardiovascular disease, metabolic syndrome, and diabetes.26,27 Specifically, increased inflammatory markers, such as C-reactive protein and white blood cells, are an indication of particularly increased cardiovascular and metabolic risk in obese individuals.28 Although inflammatory markers are associated with cardiovascular and metabolic disease risk in adults, more knowledge is needed on the utility of these markers for diagnosis in children and adolescents.29
The prevalence of the metabolic syndrome has been increasing over the past few decades.4 There has not been an official consensus on one unified definition of metabolic syndrome in children, in part due to their rapid growth and development.30 Studies have identified the metabolic syndrome in 4%–20% of children, depending on the criteria used.31,32 The prevalence in our population was relatively low at 4.6% compared with other recent studies. However, because data on blood pressure and waist circumference were unavailable and our definition utilized three of four criteria rather than the traditional three of six criteria, these estimates are most likely underestimated. Using the same three of four criteria as for the C8 population, analysis of NHANES data revealed a lower prevalence of the metabolic syndrome (3.4%) nationally than in the C8 population. Other studies have shown the importance of insulin resistance in the development of the metabolic syndrome.33 Fasting insulin levels in our study population were three times higher in those with the metabolic syndrome compared with those without, which is similar to data reported by Weiss et al.5 The similarity between our results and those of Weiss et al5 suggests that our criteria for the metabolic syndrome performed well in the selection of cases. Additionally, our data showed that fasting insulin levels increased with BMI category, further suggesting a greater risk of developing the metabolic syndrome as BMI increases. It has been suggested that the rise in insulin resistance and the metabolic syndrome can be attributed to the global rise in obesity.34,35 Lipid levels for total cholesterol, VLDL cholesterol, and triglycerides were much more elevated in those with metabolic syndrome than in those who were obese.
Our study found several significant correlations between serum C8 and serum levels of cardiovascular and metabolic risk factors; however, although significant, C8 accounted for very little of the variation in these risk factor levels. Additionally, several of the correlations across BMI category were in the opposite direction to what we had assumed. We do not have an explanation for this. We would have expected to see positive correlations between C8 and the covariates; however, in several instances, we saw slightly negative correlations.
The prevalence of overweight and obesity was exceptionally high in this population of children and adolescents. Additionally, the presence of metabolic syndrome, especially among those who were obese, forebodes additional adverse health outcomes in this population. The degree of obesity among children and adolescents has been shown to predict disease into adulthood.36 Given that 65% of obese children remain obese into adulthood,37 prevention from an early age is the primary approach for decreasing the high rates of morbidity associated with obesity. This study demonstrates the need for a better understanding of the prevalence of overweight and obesity, as well as the associated risk factors, in order to focus efforts to reverse these adverse health outcomes. Interventions aimed at these rural populations should be well informed of the demographics and baseline characteristics, which are often different from national averages, as our study results indicate, in order to best address the different needs and circumstances found among various groups in society.38
One limitation of this study was that the NHANES from 2005–2006 only collected data on HDL and triglycerides from individuals aged 6 years and older and 12 years and older, respectively, so the estimates in the NHANES population were likely an underestimation as well. Although we statistically adjusted for age, this was unlikely to fully account for the biological increase in some biomarkers as age and BMI naturally increase. Mean age increased from 13.6 to 14.3 years between those without and with the metabolic syndrome, so residual confounding by age of the associations between biomarkers and the metabolic syndrome may still occur. However, mean age decreased as BMI category increased, suggesting that any increase seen in biomarkers was most likely due to the increase seen in BMI category. Another limitation is the use of self-reported or parent/guardian-reported height and weight for the calculation of BMI and BMI percentiles. This has been shown to be biased such that BMI is often overestimated at younger ages and underestimated at older ages.39 Additionally, the use of age-specific and sex-specific BMI percentiles for classification of overweight and obesity is not considered the most accurate indicator of overweight and obese status. Body fat percentage is a better indicator of overweight and obese status in children;40 unfortunately, these data were not available in our population.
Despite the much lower prevalence of diabetes among whites compared with minority populations, West Virginia, a state that is 93% white, consistently ranks in the top first to fourth place for diseases such as diabetes and cardiovascular disease. The deterioration in risk factors for cardiovascular and metabolic syndrome as age-standardized and sex-standardized BMI category increases among children and adolescents is likely predictive of obesity-associated diseases and complications. The results of this study suggest the need for further public health involvement to decrease this risk in the pediatric Appalachian population.
Acknowledgments
Funding for this project was provided by VK Raju, The Eye Foundation of America, and the Ross Foundation. BNC and PJM were also partially supported by a grant from the National Institutes of Health General Medical Sciences (U54GM104942).
Disclosure
Parts of this study were presented in abstract form at the American Heart Association Epidemiology and Prevention Nutrition, Physical Activity and Metabolism Scientific Sessions, San Francisco, CA, USA, March 18–21, 2014 and the abstract was published in the March 2014 online version of Circulation. The authors report no other conflicts of interest in this work.
References
Wang Y, Wu Y, Wilson R, et al. Childhood obesity prevention programs: comparative effectiveness review and meta-analysis. Rockville, MD, USA: Agency for Healthcare Research and Quality; 2013. Available from: http://www.effectivehealthcare.ahrq.gov/reports/final.cfm. Accessed August 22, 2014. | |
Claire Wang Y, Gortmaker SL, Taveras EM. Trends and racial/ethnic disparities in severe obesity among US children and adolescents, 1976–2006. Int J Pediatr Obes. 2011;6(1):12–20. | |
Singh GK, Kogan MD, van Dyck PC. Changes in state-specific childhood obesity and overweight prevalence in the United States from 2003 to 2007. Arch Pediatr Adolesc Med. 2010;164(7):598–607. | |
Weiss R, Bremer AA, Lustig RH. What is metabolic syndrome, and why are children getting it? Ann N Y Acad Sci. 2013;1281:123–140. | |
Weiss R, Dziura J, Burgert TS, et al. Obesity and the metabolic syndrome in children and adolescents. N Engl J Med. 2004;350(23):2362–2374. | |
Geiger SD, Xiao J, Ducatman A, Frisbee S, Innes K, Shankar A. The association between PFOA, PFOS and serum lipid levels in adolescents. Chemosphere. 2014;98:78–83. | |
Gong CD, Wu QL, Chen Z, Zhang D, Zhao ZY, Peng YM. Glycolipid metabolic status of overweight/obese adolescents aged 9- to 15-year-old and the BMI-SDS/BMI cut-off value of predicting dyslipidemiain boys, Shanghai, China: a cross-sectional study. Lipids Health Dis. 2013;12:129. | |
Dhuper S, Buddhe S, Patel S. Managing cardiovascular risk in overweight children and adolescents. Paediatr Drugs. 2013;15(3):181–190. | |
Jago R, Mendoza JA, Chen T, Baranowski T. Longitudinal associations between BMI, waist circumference, and cardiometabolic risk in US youth: monitoring implications. Obesity (Silver Spring). 2013;21(3):E271–E279. | |
Kelly AS, Barlow SE, Rao G, et al. Severe obesity in children and adolescents: identification, associated health risks, and treatment approaches: a scientific statement from the American Heart Association. Circulation. 2013;128(15):1689–1712. | |
White SS, Fenton SE, Hines EP. Endocrine disrupting properties of perfluorooctanoic acid. J Steroid Biochem Mol Biol. 2011;127(1–2):16–26. | |
Kato K, Calafat AM, Wong LY, Wanigatunga AA, Caudill SP, Needham LL. Polyfluoroalkyl compounds in pooled sera from children participating in the National Health and Nutrition Examination Survey 2001–2002. Environ Sci Technol. 2009;43(7):2641–2647. | |
Frisbee SJ, Brooks AP Jr, Maher A, et al. The C8 health project: design, methods, and participants. Environ Health Perspect. 2009;117(12):1873–1882. | |
Centers for Disease Control and Prevention. A SAS Program for the 2000 CDC Growth Charts (ages 0 to <20y). 2011. Available from: http://www.cdc.gov/nccdphp/dnpao/growthcharts/resources/sas.htm. Accessed August 31, 2014. | |
Krebs NF, Jacobson MS. Prevention of pediatric overweight and obesity. Pediatrics. 2003;112(2):424–430. | |
Ogden CL, Carroll MD, Kit BK, Flegal KM. Prevalence of obesity and trends in body mass index among US children and adolescents, 1999–2010. JAMA. 2012;307(5):483–490. | |
Holm JE, Lilienthal KR, Poltavski DV, Vogeltanz-Holm N. Relationships between health behaviors and weight status in American Indian and white rural children. J Rural Health. 2013;29(4):349–359. | |
Tambalis KD, Panagiotakos DB, Kavouras SA, Papoutsakis S, Sidossis LS. Higher prevalence of obesity in Greek children living in rural areas despite increased levels of physical activity. J Paediatr Child Health. 2013;49(9):769–774. | |
Joens-Matre RR, Welk GJ, Calabro MA, Russell DW, Nicklay E, Hensley LD. Rural-urban differences in physical activity, physical fitness, and overweight prevalence of children. J Rural Health. 2008;24(1):49–54. | |
Davy BM, Harrell K, Stewart J, King DS. Body weight status, dietary habits, and physical activity levels of middle school-aged children in rural Mississippi. South Med J. 2004;97(6):571–577. | |
Murray CJ, Kulkarni S, Ezzati M. Eight Americas: new perspectives on US health disparities. Am J Prev Med. 2005;29(5 Suppl 1):4–10. | |
Moore JB, Davis CL, Baxter SD, Lewis RD, Yin Z. Physical activity, metabolic syndrome, and overweight in rural youth. J Rural Health. 2008;24(2):136–142. | |
Gharipour M, Ramezani MA, Sadeghi M, et al. Sex based levels of C-reactive protein and white blood cell count in subjects with metabolic syndrome: Isfahan Healthy Heart Program. J Res Med Sci. 2013;18(6):467–472. | |
Bell L, Hung J, Knuiman M, et al. Body mass index and waist circumference: relationship to cardiometabolic risk factors in children – Busselton Health Study 2005–2007. J Paediatr Child Health. 2013;49(11):955–962. | |
Bluher S, Molz E, Wiegand S, et al. Body mass index, waist circumference, and waist-to-height ratio as predictors of cardiometabolic risk in childhood obesity depending on pubertal development. J Clin Endocrinol Metab. 2013;98(8):3384–3393. | |
Marques-Vidal P, Mazoyer E, Bongard V, et al. Prevalence of insulin resistance syndrome in southwestern France and its relationship with inflammatory and hemostatic markers. Diabetes Care. 2002;25(8):1371–1377. | |
Ridker PM, Buring JE, Cook NR, Rifai N. C-reactive protein, the metabolic syndrome, and risk of incident cardiovascular events: an 8-year follow-up of 14 719 initially healthy American women. Circulation. 2003;107(3):391–397. | |
Pecht T, Gutman-Tirosh A, Bashan N, Rudich A. Peripheral blood leucocyte subclasses as potential biomarkers of adipose tissue inflammation and obesity subphenotypes in humans. Obes Rev. 2014;15(4):322–337. | |
DeBoer MD. Obesity, systemic inflammation, and increased risk for cardiovascular disease and diabetes among adolescents: a need for screening tools to target interventions. Nutrition. 2013;29(2):379–386. | |
Zimmet P, Alberti KG, Kaufman F, et al. The metabolic syndrome in children and adolescents – an IDF consensus report. Pediatr Diabetes. 2007;8(5):299–306. | |
Retnakaran R, Zinman B, Connelly PW, Harris SB, Hanley AJ. Nontraditional cardiovascular risk factors in pediatric metabolic syndrome. J Pediatr. 2006;148(2):176–182. | |
Goodman E, Daniels SR, Morrison JA, Huang B, Dolan LM. Contrasting prevalence of and demographic disparities in the World Health Organization and National Cholesterol Education Program Adult Treatment Panel III definitions of metabolic syndrome among adolescents. J Pediatr. 2004;145(4):445–451. | |
Haffner SM, Stern MP, Hazuda HP, Mitchell BD, Patterson JK. Cardiovascular risk factors in confirmed prediabetic individuals. Does the clock for coronary heart disease start ticking before the onset of clinical diabetes? JAMA. 1990;263(21):2893–2898. | |
Eckel RH, Grundy SM, Zimmet PZ. The metabolic syndrome. Lancet. 2005;365(9468):1415–1428. | |
Grundy SM. Metabolic syndrome scientific statement by the American Heart Association and the National Heart, Lung, and Blood Institute. Arterioscler Thromb Vasc Biol. 2005;25(11):2243–2244. | |
Sachdev HP, Osmond C, Fall CH, et al. Predicting adult metabolic syndrome from childhood body mass index: follow-up of the New Delhi birth cohort. Arch Dis Child. 2009;94(10):768–774. | |
Juonala M, Viikari JS, Raitakari OT. Main findings from the prospective Cardiovascular Risk in Young Finns Study. Curr Opin Lipidol. 2013;24(1):57–64. | |
Maziak W, Ward KD, Stockton MB. Childhood obesity: are we missing the big picture? Obes Rev. 2008;9(1):35–42. | |
Weden MM, Brownell PB, Rendall MS, Lau C, Fernandes M, Nazarov Z. Parent-reported height and weight as sources of bias in survey estimates of childhood obesity. Am J Epidemiol. 2013;178(3):461–473. | |
Gomez-Ambrosi J, Silva C, Galofre JC, et al. Body mass index classification misses subjects with increased cardiometabolic risk factors related to elevated adiposity. Int J Obes (Lond). 2012;36(2):286–294. |
 © 2014 The Author(s). This work is published and licensed by Dove Medical Press Limited. The
full terms of this license are available at https://www.dovepress.com/terms
and incorporate the Creative Commons Attribution
- Non Commercial (unported, 3.0) License.
By accessing the work you hereby accept the Terms. Non-commercial uses of the work are permitted
without any further permission from Dove Medical Press Limited, provided the work is properly
attributed. For permission for commercial use of this work, please see paragraphs 4.2 and 5 of our Terms.
© 2014 The Author(s). This work is published and licensed by Dove Medical Press Limited. The
full terms of this license are available at https://www.dovepress.com/terms
and incorporate the Creative Commons Attribution
- Non Commercial (unported, 3.0) License.
By accessing the work you hereby accept the Terms. Non-commercial uses of the work are permitted
without any further permission from Dove Medical Press Limited, provided the work is properly
attributed. For permission for commercial use of this work, please see paragraphs 4.2 and 5 of our Terms.