")
Back to Journals » Clinical Ophthalmology » Volume 13
Effect of anterior chamber depth on predictive accuracy of seven intraocular lens formulas in eyes with axial length less than 22 mm
Authors Shrivastava AK , Behera P, Kacher R, Kumar B
Received 31 May 2019
Accepted for publication 16 July 2019
Published 20 August 2019 Volume 2019:13 Pages 1579—1586
DOI https://doi.org/10.2147/OPTH.S217932
Checked for plagiarism Yes
Review by Single anonymous peer review
Peer reviewer comments 2
Editor who approved publication: Dr Scott Fraser
Ankur K Shrivastava, Pranayee Behera, Rajaram Kacher, Binod Kumar
Department of Ophthalmology, All India Institute of Medical Sciences, Raipur, India
Correspondence: Ankur K Shrivastava
Department of Ophthalmology, All India Institute of Medical Sciences, Flat No 603, Type 5A, AIIMS residential complex, Kabir Nagar, Raipur, Chhattisgarh 492099, India
Tel +91 971 310 0777
Email [email protected]
Purpose: This study aimed to evaluate whether different anterior chamber depth (ACD) affects the predictive accuracy of intraocular lens formulas in eyes with axial length (AL) less than 22 mm.
Methods: Eighty-five eyes of 85 patients with AL less than 22 mm were included in this retrospective study, which were divided into three groups: Group 1, ACD less than 2.4 mm; Group 2, ACD between 2.4 and 2.9 mm; and Group 3, ACD greater than 2.9 mm. Optical biometry with partial coherence interferometry was performed in all cases. The median absolute error (MedAE) was compared by Friedman’s test, using the optimized lens constant, among seven formulas (Barrett Universal II, Haigis, Hill-RBF, Hoffer Q, Holladay 1, Holladay 2, and SRK/T) in each group.
Results: Friedman’s test showed no significant difference in MedAE among all formulas in Groups 1 and 3. However, as the Haigis formula had the highest MedAE and lowest percentage of eyes within ±0.25 Diopter, it is least preferred in Group 1. On the contrary, in Group 3 it fared the best, having the least MedAE and highest percentage of eyes within ±0.25 Diopter. In Group 2, Friedman’s test gave significant difference, and post-hoc analysis showed statistical superiority of Haigis over the Holladay 1 (p=0.02), Holladay 2 (p=0.01), Hill-RBF (p=0.04), and SRK/T (p=0.02) formulas. However, there was no statistical difference between the Barrett Universal II, Haigis, and Hoffer Q formulas.
Conclusion: Considering the ACD in eyes with AL less than 22 mm, Haigis is the preferred formula while SRK/T proved to be the worst formula in Groups 2 and 3.
Keywords: short axial length, optical biometry, anterior chamber depth, intraocular lens formulas, optimized lens constant
Introduction
Refractive expectation of current-generation cataract surgeries is ever-increasing. Precise intraocular lens (IOL) power calculation is pivotal to attain excellent refractive outcomes. Accuracy has been worse with complex eyes. In short eyes (axial length (AL) less than 22 mm), it has been noted that the most preferred formulas still gave less than 75% of eyes with a prediction error within  0.50 Diopter (D).1 Previous studies have reported that every 1 mm erroneous measurement of corneal radius, AL, and anterior chamber depth (ACD) can result in 5.7 D, 2.7 D, and 1.5 D of refractive error, respectively.2 Olsen2 has also shown that ACD, AL, and corneal power (K) contributed to 42%, 36%, and 22% of error, respectively. Assessment of AL, K, ACD, and effective lens position (ELP) is essential for preoperative estimation of IOL power.
Precise AL measurement has long been considered a key factor when dealing with the accuracy of various IOL formulas as almost all of them use AL as a variable. The accuracy of various formulas may differ according to ACD, even in eyes with the same K and AL.3 Jeong et al4 in their study of 91 eyes analyzed the role of preoperative biometric parameters with the expectation disparities between the formulas. They concluded that preoperative ACD was the key factor for the difference of third-generation formulas compared to the Haigis formula. Predicted refractions based on ACD were more accurate than predicted refractions without considering ACD in eyes with short AL and shallow ACD.3 There are meager studies comparing the effect of ACD on the accuracy of IOL formulas despite increasing use of this parameter for ELP calculation, with only two studies done in short eyes.
Apprehending that there can be wide variation in ACD in eyes with short AL, the current study was undertaken to analyze the effect of ACD on predictive accuracy of seven IOL formulas in eyes with AL less than 22 mm. This includes six vergence formulas, namely Hoffer Q,5 Holladay 1,6 SRK/T7 which utilizes two variables, Haigis8 utilizing three variables, Barrett Universal II9 utilizing five variables, and Holladay 210 using seven variables. The seventh formula, Hill-RBF (version 2.0) hereby referred to as the RBF Method,11 uses the artificial intelligence method.
Materials and methods
This retrospective, observational study was undertaken at All India Institute of Medical Sciences, Raipur, India. The study enrolled patients above 40 years of age, with AL less than 22 mm, who underwent uneventful phacoemulsification cataract surgery with 2.8 mm clear corneal incision. All cases operated on between 1 January 2016 and 31 August 2017 who met the inclusion criteria were included in the study. All surgeries were performed by a single surgeon with implantation of an aspheric acrylic hydrophobic foldable IOL (Acrysof SN6CWS; Alcon Laboratories, Inc., Fort Worth, TX, USA). In patients where both eyes were eligible, the first operated eye was included in the study. The study was conducted under Institute Ethics Committee approval, strictly adhering to the tenets of the Declaration of Helsinki.
We excluded eyes with corneal disease (corneal scar, keratoconus), ocular comorbidity (ocular injury, uveitis), any prior ocular surgery, eyes with preoperative keratometric cylinder greater than 2.5 D, eyes with poor fixation or dense cataract making optical biometry infeasible, intraoperative complications (posterior capsular tear, vitreous disturbances, zonular dialysis, nucleus drop), IOL implantation other than the capsular bag (sulcus placed IOL, open-loop anterior chamber IOL, scleral-sutured posterior chamber IOL, and iris-sutured posterior chamber IOL), and postoperative best corrected visual acuity less than 20/40 at the end of 1 month. The RBF Method identifies eyes as being out of bounds when the keratometry (K) values fall outside the range of 37–52 D. Such eyes were also excluded from the study.
Data were collected retrospectively for all patients. Demographic characteristics like age, sex, and laterality were noted. Optical biometry with partial coherence interferometry (PCI) was performed in all cases. PCI device software (IOLMaster 500, version 5.4; Carl Zeiss Meditec AG, Jena, Germany) was used for measurement of AL, ACD (distance from corneal epithelium to anterior lens surface), average K, and horizontal corneal diameter. Lens thickness (LT) measurement was done in all the cases by immersion A-scan ultrasonography (Compact touch; Quantel Medical, France) as this parameter cannot be measured by IOLMaster 500. Seven formulas were used to calculate IOL power using the optimized lens constant.
The IOL power calculation for the Haigis, Hoffer Q, Holladay 1, and SRK/ T formulas was done using PCI device software. Holladay IOL Consultant software was used for the Holladay 2 formula,10 while an online calculator was utilized for Barrett Universal II9 and the RBF Method.11 All eyes were implanted with IOL power calculated with the Hoffer Q formula, a third-generation IOL formula suggested for calculation in short eyes.5,12,13
Final postoperative manifest refraction was performed at the end of 1 month by a predesignated refractionist and was converted into its spherical equivalent. For analysis, all eyes were divided into three groups based on ACD: Group 1 includes ACD less than 2.4 mm; Group 2 includes ACD between 2.4 and 2.9 mm; and Group 3 includes ACD greater than 2.9 mm.
The mean numerical error or refractive prediction error (RPE) was defined as the difference between the actual postoperative spherical equivalent at 1 month follow up and the predicted postoperative spherical equivalent. A negative predictive error indicated more myopic results (ie, a tendency toward overcorrection), and vice versa. The mean absolute error (MAE) was calculated as the magnitude of the prediction error, regardless of sign. The mean numerical error, MAE, and median absolute error (MedAE) were back-calculated for other formulas in all three groups.
Optimization was done by adjusting the lens constant for each formula in 0.001 steps until the mean numerical error was as close as possible to 0.14 This resulted in Haigis a0, a1, and a2 constants of 1.350, 0.400, and 0.100, respectively, after triple optimization, Hoffer Q personalized ACD of 4.99, Holladay 1 surgeon factor of 1.77, Holladay 2 constant of 5.530, and SRK/T A-constant of 118.966. The recommended constant of 118.99 and 119.02 was used for the Barrett Universal II formula and RBF Method, respectively. The differences in the MedAE of the seven formulas were analyzed. The proportion of eyes within ±0.25 D, ±0.50 D, ±1.00 D, and ±2.00 D of the predicted refraction was also calculated in all three groups.
Statistical analysis
The differences in MedAE between formulas in all three groups were assessed by Friedman’s test. In the case of a significant result, post-hoc analysis was performed for multiple comparisons among formulas.15 The Wilcoxon signed-rank test was utilized for post-hoc analysis to compare the MedAE of each formula in different ACD groups. Cochran’s Q test was used to compare the percentages of eyes with a prediction error within a given value. A p-value less than 0.05 was considered statistically significant. Pearson’s correlation coefficient determined the correlation of ACD and RPE. All analysis was performed using SPSS software (version 24.0; IBM Corp., Armonk, NY, USA).
Results
The study comprised 85 eyes of 85 patients (71 (83.5%) women and 14 (16.5%) men) with AL less than 22 mm. Table 1 shows descriptive data of patients in the three ACD groups. The ACD was inversely proportional to LT (p=0.1) and age of the patients (p=0.0001), whereas it was directly proportional to AL (p=0.02) (ie, with an increase in LT and age the ACD decreases, whereas with an increase in AL the ACD increases). The difference in LT in the three groups was not statistically significant (p>0.05). Table 2 shows the mean RPE, MAE, and MedAE produced by each formula in all three groups. Tables 3–5 show the percentage of eyes with RPEs within ±0.25 D, ±0.50 D, ±1.00 D, and ±2.00 D in ACD Group 1, Group 2, and Group 3, respectively. A significant difference was found in Group 2, where the Haigis formula produced a greater percentage of eyes within ±0.50 D of error compared with the Holladay 2, RBF Method, and SRK/T formulas (p<0.05).
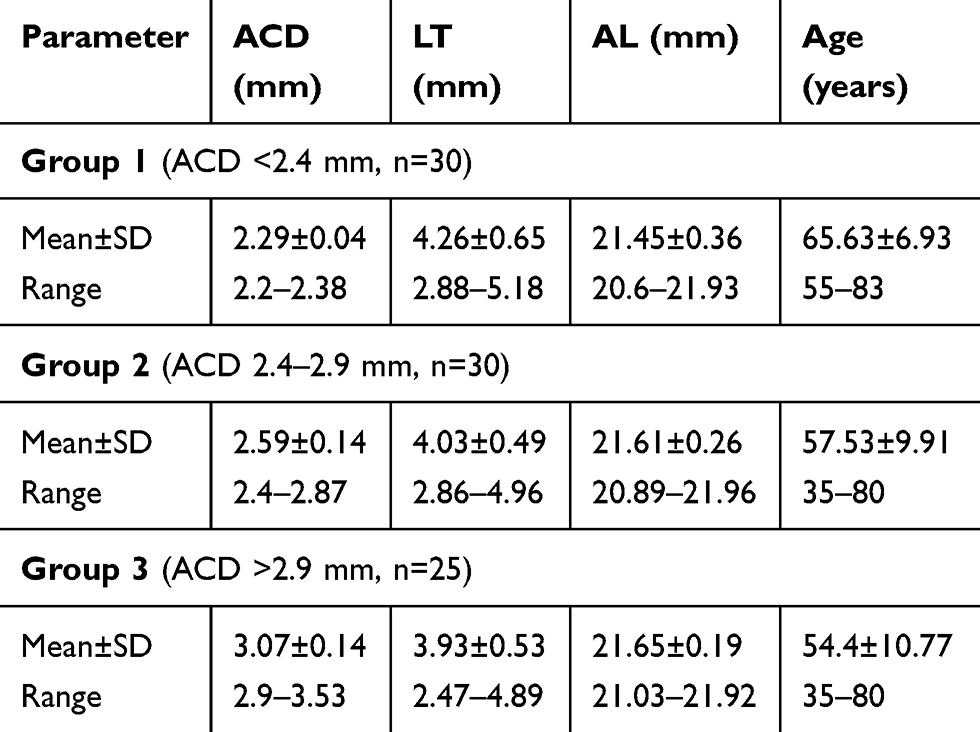 |
Table 1 Descriptive data of patients in the three ACD groups |
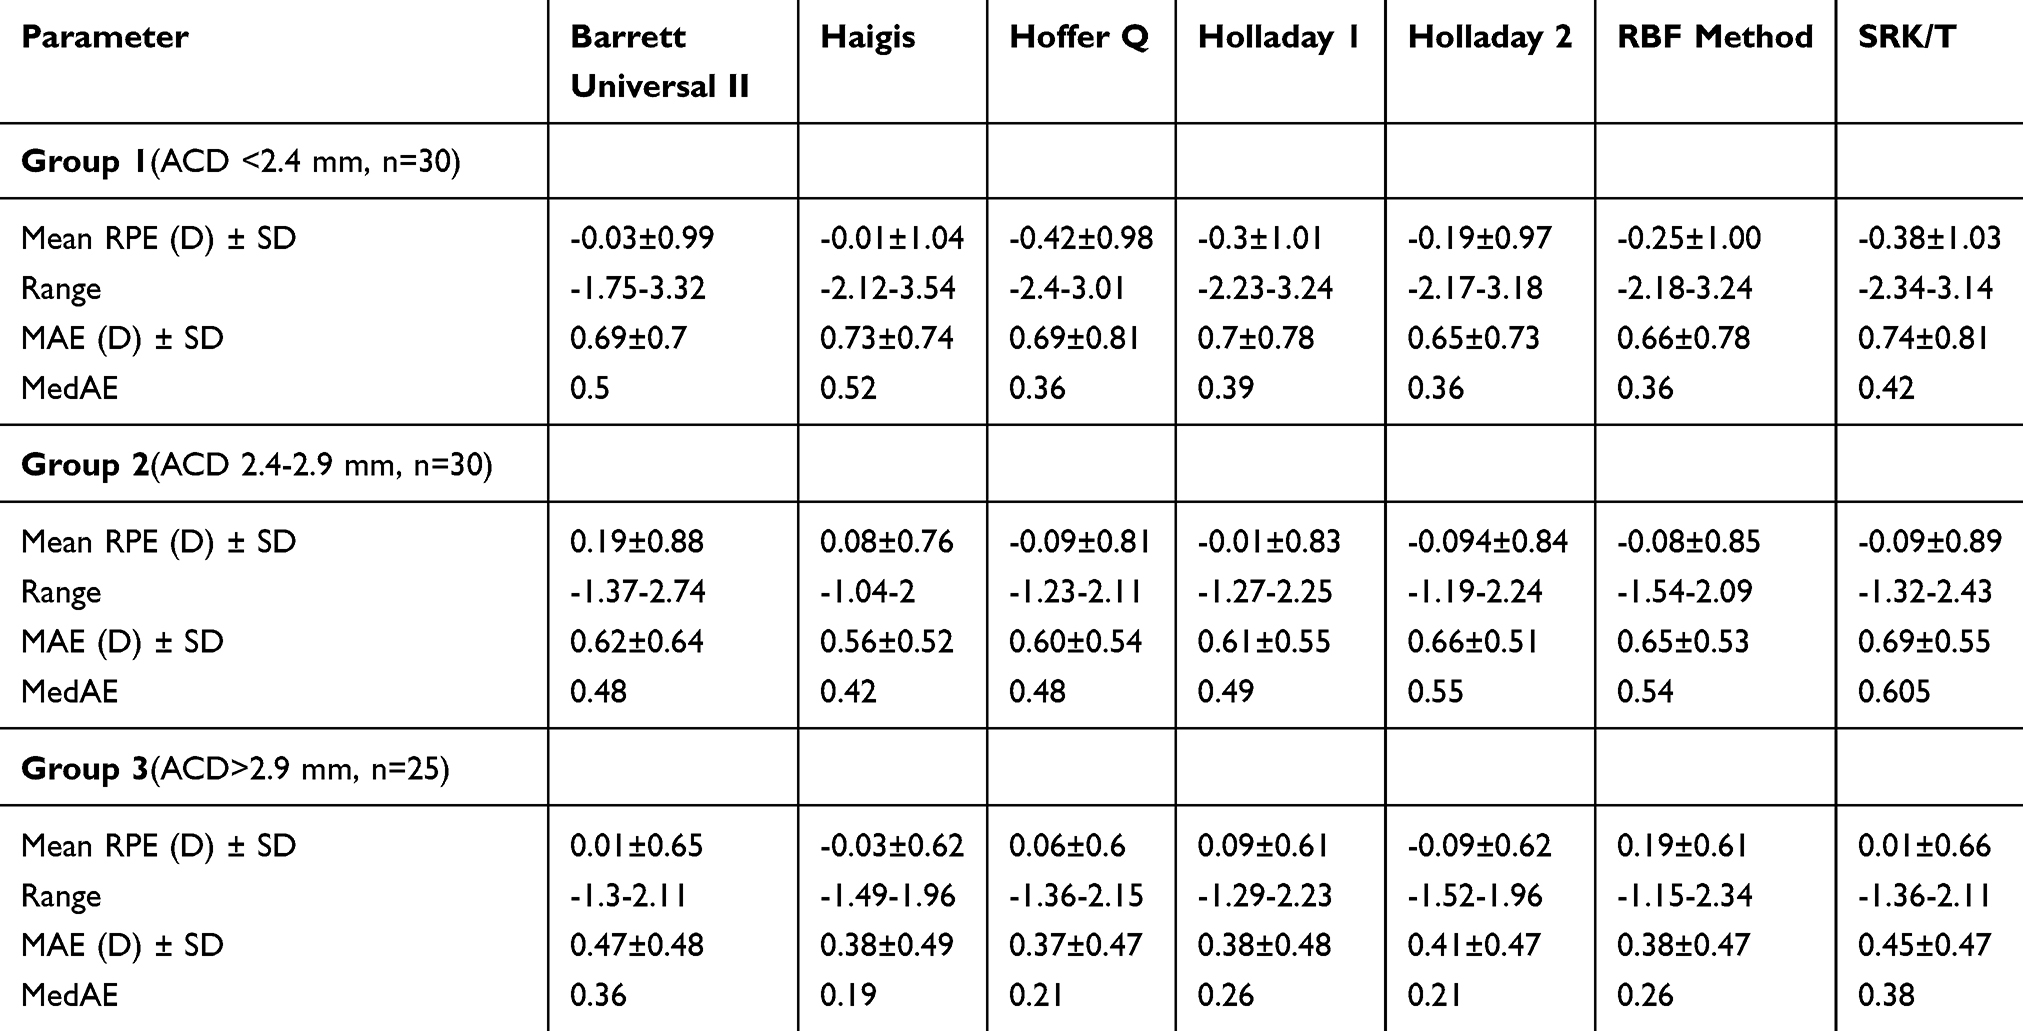 |
Table 2 Mean refractive prediction error, mean absolute error and median absolute error of each formula in three groups |
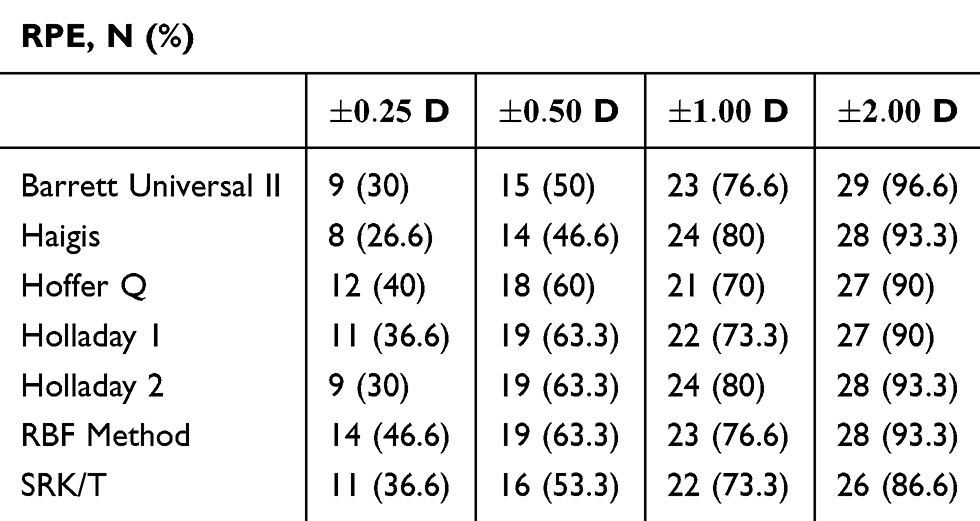 |
Table 3 Percentage of eyes with refractive prediction errors within ±0.25 D, ±0.50 D, ±1.00 D, and ±2.00 D in Group 1 (ACD less than 2.4 mm) |
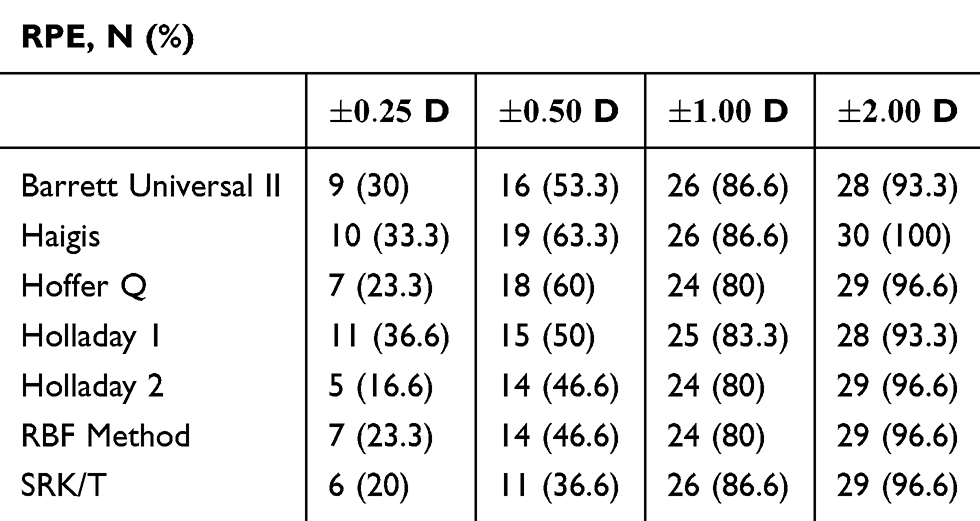 |
Table 4 Percentage of eyes with refractive prediction errors within ±0.25 D, ±0.50 D, ±1.00 D, and ±2.00 D in Group 2 (ACD between 2.4 and 2.9 mm) |
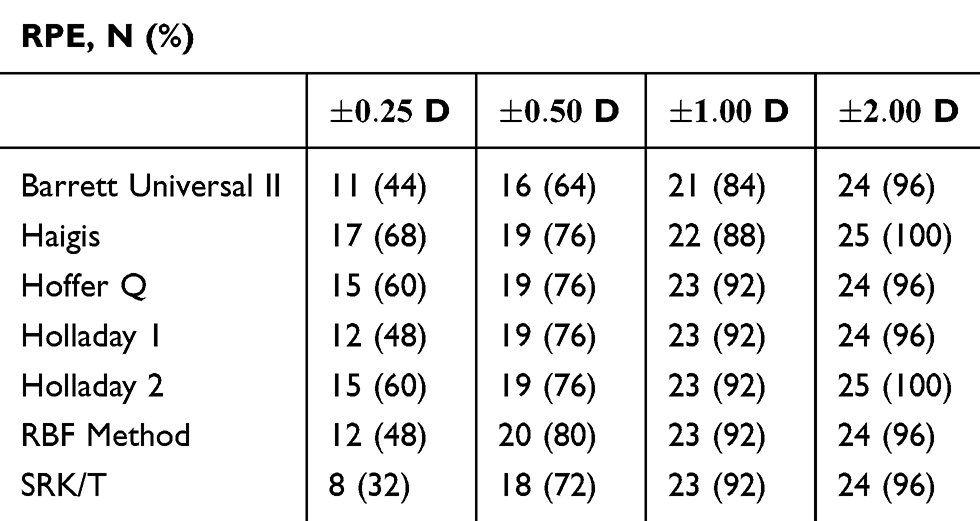 |
Table 5 Percentage of eyes with refractive prediction errors within ±0.25 D, ±0.50 D, ±1.00 D, and ±2.00 D in Group 3 (ACD greater than 2.9 mm) |
Friedman’s test showed no significant difference in the MedAE among all formulas in Group 1. However, the Haigis formula had the highest MedAE (0.520) and also the lowest percentage of eyes (26.6% and 46.6%) within RPE of ±0.25 D and ±0.50 D, respectively (p>0.05).
In Group 2, Friedman’s test showed statistical difference when comparing MedAE among the seven formulas. Post-hoc analysis showed the Haigis formula to be statistically better than the Holladay 1 (p=0.02), Holladay 2 (p=0.01), RBF Method (p=0.04), and SRK/T (p=0.02) formulas. However, there was no statistical difference between the Barrett Universal II, Haigis, and Hoffer Q formulas. The Haigis formula had the least MAE (0.561) and MedAE (0.420). The percentage of eyes within RPE of ±0.50 D was maximum (63.3%) for the Haigis formula, whereas it was least (36.6%) for the SRK/T formula (p<0.05). The SRK/T formula also had the worst MAE (0.692) and MedAE (0.605).
The results of Friedman’s test in Group 3 showed no statistically significant difference in the MedAE among all formulas. However, the Haigis formula was found to have the least MedAE (0.190) and maximum percentage of eyes (68%) within RPE of  0.25 D (p>0.05). On the contrary, the SRK/T formula had the highest MedAE (0.380) and the least percentage of eyes (32%) within RPE of
  0.25 D.
Pearson’s correlation coefficient showed no linear correlation between ACD and RPE in all seven formulas (Figures 1–3).
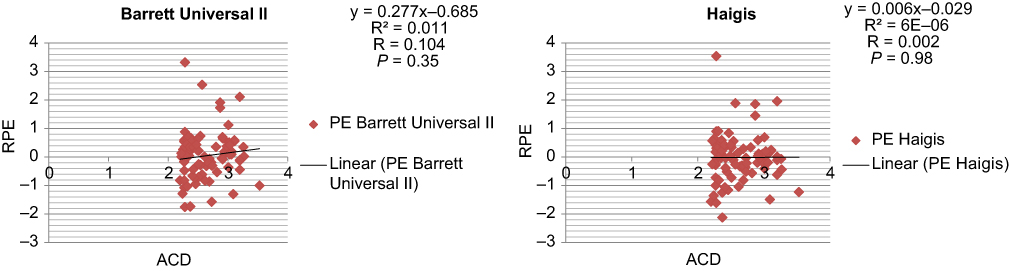 |
Figure 1 Correlation of anterior chamber depth with refractive prediction error for the Barrett Universal II and Haigis formulas.Abbreviations: ACD, anterior chamber depth; RPE, refractive prediction error. |
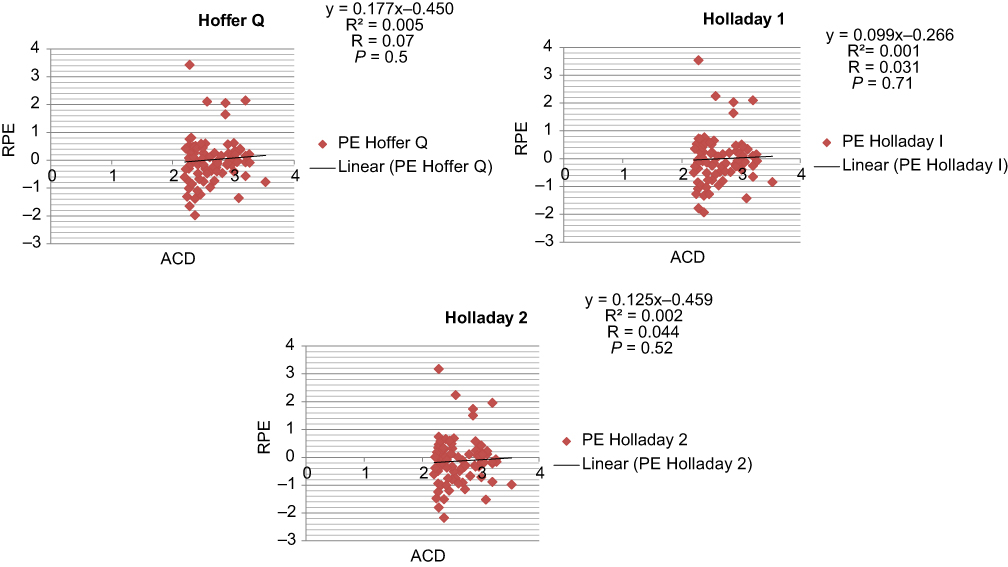 |
Figure 2 Correlation of anterior chamber depth with refractive prediction error for the Hoffer Q, Holladay 1, and Holladay 2 formulas. Abbreviations: ACD, anterior chamber depth; RPE, refractive prediction error. |
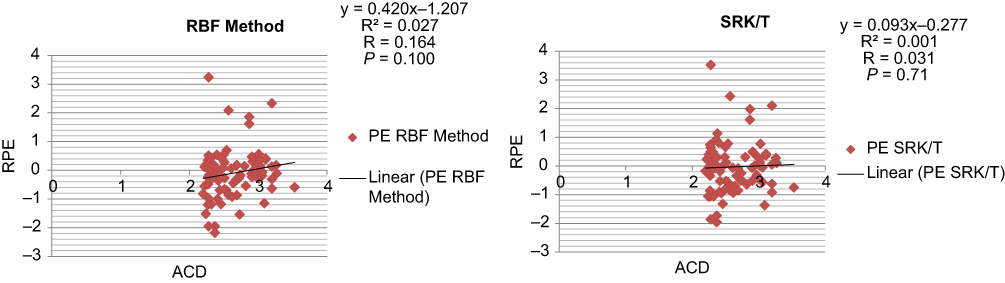 |
Figure 3 Correlation of anterior chamber depth with refractive prediction error for the RBF Method and SRK/T formulas. Abbreviations: ACD, anterior chamber depth; RPE, refractive prediction error. |
Discussion
Preoperative ACD plays a pivotal role in determining the ELP. The predictive accuracy of different IOL power calculation formulas varies not only according to AL but also according to ACD.16 When preoperative ACD is considered in short eyes, then the margin of error in the predictive accuracy of different IOL formulas narrows down still further. Previous studies have reported the influence of ACD in short eyes considering various third and fourth-generation formulas.3,16 But none of them has utilized modern formulas like Barrett Universal II, Holladay 2, and the RBF Method. Hence, the current study was undertaken to compare the predictive accuracy of seven IOL formulas (Barrett Universal II, Haigis, Hoffer Q, Holladay 1, Holladay 2, RBF Method, and SRK/T) in short eyes taking ACD into consideration.
In short eyes with ACD less than 2.4 mm, none of the formulas was statistically superior over the others. The mean RPE of the Barrett Universal II and Haigis formulas was close to emmetropia, whereas that of the Hoffer Q, Holladay 1, Holladay 2, RBF Method, and SRK/T formulas erred toward slight overcorrection; that is, the outcome was slightly more myopic than what was intended. Eom et al3 in their study of 75 short eyes concluded that the Haigis formula was more accurate in the ACD less than 2.4 mm group, while Yang et al16 in their study of 90 short eyes found the Haigis formula performing worst in the ACD less than 2.5 mm group. In our study, as the Haigis formula had the highest MedAE and lowest percentage of eyes within RPE of ±0.25 D and ±0.50 D, we also do not recommend the Haigis formula in Group 1.
In short eyes having ACD between 2.4 and 2.9 mm, Friedman’s test showed significant difference. The Haigis formula was statistically superior to the Holladay 1, Holladay 2, RBF Method, and SRK/T formulas. However, there was no statistical difference between the Barrett Universal II, Haigis, and Hoffer Q formulas. The mean RPE of all formulas was close to emmetropia except for Barrett Universal II which erred toward slight hyperopia. In the studies by Eom et al3 (ACD greater than 2.4 mm group) and Yang et al16 (ACD between 2.5 and 3.5 mm group), none of the formulas was statistically superior over the others. In our study, as the Haigis formula had the least MAE and MedAE and the highest percentage of eyes within RPE of ±0.50 D, we recommend it over other formulas in ACD Group 2. On the contrary, as the SRK/T formula had the highest MAE and MedAE and the least percentage of eyes within RPE of ±0.50 D, we do not recommend the SRK/T formula in this group.
In short eyes with ACD greater than 2.9 mm, none of the formulas was statistically superior over the others. The mean RPE of all formulas was close to emmetropia except for the RBF Method which erred toward slight hyperopia. As the Haigis formula was found to have the least MedAE and maximum percentage of eyes within RPE of  0.25 D it seemed to be best tuned in this group, and hence we recommend it over other formulas in ACD Group 3. On the contrary, as the SRK/T formula had the highest MedAE and least percentage of eyes within RPE of
  0.25 D, we do not recommend it in this group.
The results of our study favor the Haigis formula over others in ACD Groups 2 and 3 in short eyes. In the Haigis formula, ELP is tuned to ACD by a1, one of its three lens constants. This could be the most probable reason for its better performance when compared to the Hoffer Q, Holladay 1, and SRK/T formulas. Although the Hoffer Q formula includes personalized ACD, AL is primarily used for ELP estimation. Modern formulas like Barrett Universal II and the RBF Method have received more popularity recently, but their superiority over others, particularly in short eyes, is yet to be proved.17,18 Although Kane et al17 concluded that none of the formulas was statistically superior over the others in short eyes, their results also revealed the Haigis formula as having the highest percentage of eyes within ±0.25 D. Melles et al19 showed that although the Barrett formula had the lowest MAE for short eyes, when variation in ACD was considered the Haigis formula proved better than Barrett with little deviation in prediction error, which was in concordance with our results.
The strengths of our study are that we followed the recommendations of Hoffer et al14 regarding standard protocols for IOL power studies. The biometric analysis was exclusively done with PCI technology as optical biometry has been accepted as the most accurate method in short eyes where small differences in AL measurements may potentially lead to larger refractive errors.13,20–22 Accuracy was further ensured by including eyes with a signal-to-noise ratio greater than or equal to 2.0. All biometric calculations were done by the same refractionist and all eyes were operated on by the same surgeon so as to minimize bias. An IOL of the same make (Acrysof SN6CWS; Alcon Laboratories, Inc.) was implanted in all patients as studies have shown that different IOL designs might affect the outcome precision.23,24
Our study had a few limitations. The results can only be applied for short eyes with AL between 20.6 and 21.96 mm. Use of IOLMaster 500 instead of IOLMaster 700 or Lens-Star is another shortcoming of our study. The latter uses a swept source laser that has a better signal-to-noise ratio, therefore better sensitivity on results. LT was measured by immersion ultrasound biometry. Its measurement by optical biometry might have produced different results as LT measured by immersion ultrasound biometry and optical biometry is not interchangeable.25 Also, differentiation between shallow ACD due to inherent anatomy or increased LT was not taken into consideration. However, as the difference in LT in the three ACD groups was not statistically significant, we assume that shallow ACD was primarily due to inherent anatomy.
The Haigis formula had the best outcome in terms of MAE, MedAE, and percentage of eyes within ±0.50 D in this study and performed well across ACD greater than 2.4 mm in short eyes. But when ACD ranges were below 2.4 mm, none of the formulas yielded more accurate results than others. Thus, to conclude, as per the results of our study, when variations in ACD were considered in short eyes, the Haigis formula should be preferred in Groups 2 and 3. Future prospective studies comparing ACD groups in all eyes, using modern formulas, should be considered.
Ethics statement
The patient data confidentiality was maintained and their consent to review medical records was not required by the institute’s ethics committee as the study was retrospective in nature.
Disclosure
The authors report no conflicts of interest in this work.
References
1. Gokce SE, Zeiter JH, Weikert MP, Koch DD, Hill W, Li Wang L. Intraocular lens power calculations in short eyes using 7 formulas. J Cataract Refract Surg. 2017;43:892–897. doi:10.1016/j.jcrs.2017.07.004
2. Olsen T. Calculation of intraocular lens power: a review. Acta Ophthalmol Scand. 2007;85(5):472–485. doi:10.1111/j.1755-3768.2007.00879.x
3. Eom Y, Kang S-Y, Song JS, Kim YY, Kim HM. Comparison of Hoffer Q and Haigis formulae for intraocular lens power calculation according to the anterior chamber depth in short eyes. Am J Ophthalmol. 2014;157:818–824. doi:10.1016/j.ajo.2013.12.017
4. Jeong J, Song H, Lee JK, Chuck RS, Kwon JW. The effect of ocular biometric factors on the accuracy of various IOL power calculation formulas. BMC Ophthalmol. 2017;17:62. doi:10.1186/s12886-017-0454-y
5. Hoffer KJ. The Hoffer Q formula: a comparison of theoretic and regression formulas. J Cataract Refract Surg. 1993;19:700–712. errata, 1994;20:677;further explanation 2007; 33:2–3. doi:10.1016/S0886-3350(13)80338-0
6. Holladay JT, Prager TC, Chandler TY, Musgrove KH, Lewis JW, Ruiz RS. A three-part system for refining intraocular lens power calculations. J Cataract Refract Surg. 1988;14:17–24. doi:10.1016/S0886-3350(88)80059-2
7. Retzlaff JA, Sanders DR, Kraff MC. Development of the SRK/T intraocular lens implant power calculation formula. J Cataract Refract Surg. 1990;16:333–340. erratum, 528. doi:10.1016/S0886-3350(13)80705-5
8. Haigis W, Lege B, Miller N, Schneider B. Comparison of immersion ultrasound biometry and partial coherence interferometry for intraocular lens calculation according to Haigis. Graefes Arch Clin Exp Ophthalmol. 2000;238:765–773. doi:10.1007/s004170000188
9. Barrett GD. Barrett Universal II Formula. Singapore: Asia-Pacific Associationof Cataract and Refractive Surgeons. Available from: http://www.apacrs.org/barrett_universal2/. Accessed July 21, 2018.
10. Holladay JT. Holladay IOL Consultant Software & Surgical Outcomes Assessment. Bellaire, TX: Holladay Consulting; 2015. Available from: http://www.hicsoap.com. Accessed July 21, 2018.
11. Hill WE Hill-RBF calculator version 2.0. Available from:http://rbfcalculator.com/online/index.html.
12. Hoffer KJ. Clinical results using the Holladay 2 intraocular lens power formula. J Cataract Refract Surg. 2000;26:1233–1237.
13. Aristodemou P, Knox Cartwright NE, Sparrow JM, Johnston RL. Formula choice: Hoffer Q, Holladay 1, or SRK/T and refractive outcomes in 8108 eyes after cataract surgery with biometry by partial coherence interferometry. J Cataract Refract Surg. 2011;37:63–71. doi:10.1016/j.jcrs.2010.07.032
14. Hoffer KJ, Aramberri J, Haigis W, et al. Protocols for studies of intraocular lens formula accuracy. Am J Ophthalmol. 2015;160:403–405. doi:10.1016/j.ajo.2015.05.029
15. Benavoli A, Corani G, Mangili F. Should we really use post-hoc tests based on mean-ranks? J Mach Learn Res. 2016;17:1–10.
16. Yang S, Whang WJ, Joo CK. Effect of anterior chamber depth on the choice of intraocular lens calculation formula. PLoS One. 2017;12(12):e0189868. doi:10.1371/journal.pone.0189868
17. Kane JX, Van Herdeen A, Atik A, et al. Intraocular lens power formula accuracy: comparison of 7 formulas. J Cataract Refract Surg. 2016;42:
18. Kane JX, Van Herdeen A, Atik A, Petsoglou C. Accuracy of 3 new methods for intraocular lens power selection. J Cataract Refract Surg. 2017;43:
19. Melles RB, Holladay JT, Chang WJ. Accuracy of intraocular lens calculation formulas. Ophthalmology. 2018;125:169–178. doi:10.1016/j.ophtha.2017.08.027
20. Cao KY, Sit M, Braga-Mele R. Primary piggyback implantation of 3 intraocular lenses in nanophthalmos. J Cataract Refract Surg. 2007;33:727–730. doi:10.1016/j.jcrs.2006.11.028
21. Landers J, Goggin M. Comparison of refractive outcomes using immersion ultrasound biometry and IOLMaster biometry. Clin Experiment Ophthalmol. 2009;37:566–569. doi:10.1111/j.1442-9071.2009.02091.x
22. Lee AC, Qazi MA, Pepose JS. Biometry and intraocular lens power calculation. Curr Opin Ophthalmol. 2008;19:13–17. doi:10.1097/ICU.0b013e3282f1c5ad
23. Maclaren RE, Natkunarajah M, Riaz Y, Bourne RR, Restori M, Allan BD. Biometry and formula accuracy with intraocular lenses used for cataract surgery in extreme hyperopia. Am J Ophthalmol. 2007;143:920–931. doi:10.1016/j.ajo.2007.02.043
24. Rhiu S, Lee ES, Kim TI, Lee HS, Kim CY. Power prediction for one-piece and three-piece intraocular lens implantation after cataract surgery in patients with chronic angle-closure glaucoma: a prospective, randomized clinical trial. Acta Ophthalmol. 2012;90:580–585. doi:10.1111/j.1755-3768.2011.02287.x
25. Savini G, Hoffer KJ, Lomoriello DS. Agreement between lens thickness measurements by ultrasound immersion biometry and optical biometry. J Cataract Refract Surg. 2018;44:1463–1468. doi:10.1016/j.jcrs.2018.07.057
 © 2019 The Author(s). This work is published and licensed by Dove Medical Press Limited. The full terms of this license are available at https://www.dovepress.com/terms.php and incorporate the Creative Commons Attribution - Non Commercial (unported, v3.0) License.
By accessing the work you hereby accept the Terms. Non-commercial uses of the work are permitted without any further permission from Dove Medical Press Limited, provided the work is properly attributed. For permission for commercial use of this work, please see paragraphs 4.2 and 5 of our Terms.
© 2019 The Author(s). This work is published and licensed by Dove Medical Press Limited. The full terms of this license are available at https://www.dovepress.com/terms.php and incorporate the Creative Commons Attribution - Non Commercial (unported, v3.0) License.
By accessing the work you hereby accept the Terms. Non-commercial uses of the work are permitted without any further permission from Dove Medical Press Limited, provided the work is properly attributed. For permission for commercial use of this work, please see paragraphs 4.2 and 5 of our Terms.