Back to Archived Journals » Open Access Journal of Sports Medicine » Volume 8
Effect of age and performance on pacing of marathon runners
Authors Nikolaidis PT ![]() , Knechtle B
, Knechtle B ![]()
Received 12 May 2017
Accepted for publication 27 July 2017
Published 21 August 2017 Volume 2017:8 Pages 171—180
DOI https://doi.org/10.2147/OAJSM.S141649
Checked for plagiarism Yes
Review by Single anonymous peer review
Peer reviewer comments 6
Editor who approved publication: Prof. Dr. Andreas Imhoff
Pantelis Theodoros Nikolaidis,1 Beat Knechtle2,3
1Exercise Physiology Laboratory, Attiki, Greece; 2Gesundheitszentrum St. Gallen, St. Gallen, 3Institute of Primary Care, University of Zurich, Zurich, Switzerland
Abstract: Pacing strategies in marathon runners have previously been examined, especially with regard to age and performance level separately. However, less information about the age × performance interaction on pacing in age-group runners exists. The aim of the present study was to examine whether runners with similar race time and at different age differ for pacing. Data (women, n=117,595; men, n=180,487) from the “New York City Marathon” between 2006 and 2016 were analyzed. A between–within subjects analysis of variance showed a large main effect of split on race speed (p<0.001, η2=0.538) with the fastest speed in the 5–10 km split and the slowest in the 35–40 km. A small sex × split interaction on race speed was found (p<0.001, η2=0.035) with men showing larger increase in speed at 5 km and women at 25 km and 40 km (end spurt). An age-group × performance group interaction on Δspeed was shown for both sexes at 5 km, 10 km, 15 km, 20 km, 25 km, 30 km, 35 km, and 40 km (p<0.001, 0.001≤η2≤0.004), where athletes in older age-groups presented a relatively more even pace compared with athletes in younger age-groups, a trend that was more remarkable in the relatively slow performance groups. So far, the present study is the first one to observe an age × performance interaction on pacing; ie, older runners pace differently (smaller changes) than younger runners with similar race time. These findings are of great practical interest for coaches working with marathon runners of different age, but similar race time.
Keywords: running, master athlete, endurance, aerobic capacity, fatigue, gender, race time
Introduction
Running is one of the sports practicing worldwide,1 and the distance of a marathon (42.195 km) is one of the running races presenting the highest participation rates.2 To meet the challenging psychophysiological demands of a marathon race, one should have optimal levels of aerobic capacity, anaerobic threshold, and motivation.3 In addition, performance in marathon running depends on pacing,4 ie, the ability to appropriately expend energy to prevent premature fatigue prior to the completion of the event.5
Pacing in a marathon can be assessed using several methods.6–8 For instance, it can be calculated as the percentage change in speed in the second half of a marathon compared with the first half,6 the mean speed in the last 12.2 km divided by the mean speed in the first 30 km,7 or the mean speed in the last 9.7 km divided by the mean speed in the first 32.5 km.8 Regardless of the assessment method, a variation of pacing by sex, age, and performance has been shown9 with women, older, and faster runners adopting a less variable pacing compared with men, younger, and slower runners.6,7
Although the abovementioned research has improved our understanding of the role of sex, age, and performance on pacing, there is little information with regard to the differences in pacing between younger and older marathon runners of similar race time. Only one study has ever examined the age × performance interaction on race speed, and their finding of no interaction might be due to the relatively small number of participants.8 The knowledge of the existence of such interaction would be of great practical value for coaches and runners and of theoretical value for scientists interested in pacing during endurance sports. Therefore, the aim of the present study was to examine whether differences in pacing strategies do exist between younger and older marathon runners of similar race time. A secondary aim was to examine the association of performance groups based on race time with sex and age. The “New York City Marathon” should be considered as a flat marathon due to the relatively small changes in elevation. Many thousands of women and men participate every year in the “New York City Marathon,” which consists of a suitable race to study the interaction of performance and age on pacing due to its large participation. We hypothesized that older marathon runners would show a relatively more even pace than younger runners of similar race time based on previous studies that showed more even pace in the older and in the faster runners. A more even pace would be characterized by changes in speed from split to split closer to zero, as well as by the lack of an end spurt.
Materials and methods
Ethical approval
The Institutional Review Board of Kanton St. Gallen, Switzerland, approved all procedures used in the study with a waiver of the requirement for informed consent from the participants, given the fact that the study involved the analysis of publicly available data. The study was conducted in accordance with recognized ethical standards according to the Declaration of Helsinki regarding human experimentation as it was adopted in 1964 and revised in 2013.
Data sampling
Finishers (women, n=168,702; men, n=282,935) in the “New York City Marathon” between 2006 and 2016 were initially considered in the present study.10 They were considered in 14 age-groups (one bin of 18 and 19 years and 13 bins, 5 years in width, from 20–24 years to 80–84 years). Inclusion criteria were the following: for each finisher, there were complete data of all split times, and changes between splits were <20%. The limit of 20% was applied to exclude cases that deviate from the “normal” sport pacing, eg, those who abruptly decreased speed probably due to intolerable fatigue or an injury. Finally, 117,595 women and 180,487 men were included and analyzed. Nine splits were analyzed, the first eight were 5 km each and the last was 2.195 km: 0–5 km, 5–10 km, 10–15 km, 15–20 km, 20–25 km, 25–30 km, 30–35 km, 35–40 km, and 40–42 km. In addition, eight points of change of speed (Δspeed, ie, change of speed between two consecutive splits) were considered: 5 km, 10 km, 15 km, 20 km, 25 km, 30 km, 35 km, and 40 km.
The race
The “New York City Marathon” presents relatively small changes in its elevation.11 It starts at an elevation of 29.3 m, decreases by −8.0 m in the 0–5 km split and by −9.1 m in the 5–10 km split, increases by +1.8 m in the 10–15 km split, decreases by −3.6 m in the 15–20 km split, increases by +30.7 m in the 20–25 km split, decreases by −39.0 m in the 25–30 km split, and then increases continuously in the 30–35 km (+6.1 m), 35–40 km (+13.7 m), and 40–42 km split (+3.7 m) to end at an elevation of 25.6 m. In addition, it should be highlighted that the “New York City Marathon” has been conducted in the same route since the 1970s.
Statistical analyses
All statistical analyses were performed using the statistical packages IBM SPSS version 20.0 (Chicago, IL, USA) and GraphPad Prism version 7.0 (San Diego, CA, USA). All data were examined for normality using Kolmogorov–Smirnoff test of normality and visual inspection of normal Q-Q plots. Descriptive statistics (mean ± standard deviation) were used for all variables. Race speed was calculated by dividing split distance (ie, 5 km for all splits, except the last one which was 2.195 km) by time for each split.3 We created nine performance groups according to the race times as follows: <3.0 h, 3.0–3.5 h, 3.5–4.0 h, 4.0–4.5 h, 4.5–5.0 h, 5.0–5.5 h, 5.5–6.0 h, 6.0–6.5 h and >6.5 h. This approach allowed an “absolute” comparison among age-groups, eg, the 60–64 years of male runners of 5.5–6.0 h were compared with the 30–34 years of male runners of 5.5–6.0 h for pacing. The association of performance group with sex and age-group was examined using chi-square (χ2) and Cramer’s phi (j). A between–within subjects analysis of variance (ANOVA) examined the main effects of sex, age-group, performance group, split, and the performance group × split and performance group × age-group interactions on race speed and Δspeed, followed by a Bonferroni post hoc analysis. The magnitude of differences in the ANOVA was evaluated using eta-square (η2) as trivial (η2<0.01), small (0.01≤η2<0.06), moderate (0.06≤η2<0.14), and large (η2≥0.14).12 We calculated percentage Δspeed at eight points of the race, eg, Δspeed at 15 km was calculated as 100× (speed in 15–20 km − speed in 10–15 km)/speed in 10–15 km. We defined an end spurt as Δspeed at 40 km >0% and examined the association of end spurt with sex, age, and performance using χ2 and j. Alpha level was set at 0.05.
Results
Sex ¥ performance group association
A sex × performance group association was observed (χ2=23,119.4, p<0.001, j=0.278) with more men than women classified in performance groups <3.0 h, 3.0–3.5 h, 3.5–4.0 h, 4.0–4.5 h and 4.5–5.0 h, whereas the opposite trend was shown in 5.0–5.5 h, 5.5–6.0 h, 6.0–6.5 h and >6.5 h groups (Figure 1). In women, an age-group × performance group association was found (χ2=6,279.5, p<0.001, j=0.231) with the <3.0 h and 3.0–3.5 h performance groups being the most frequent in the age-group 25–29 years; the 4.0–4.5 h and 4.5–5.0 h performance groups in the age-group 30–34 years; and the slower performance groups in the age-group 40–44 years (Table 1). In men, an age-group × performance group association was found (χ2=17,866.0, p<0.001, φ=0.315) with the <3.0 h performance group being the most frequent in age-group 30–34 years; the 3.0–3.5 h, 3.5–4.0 h, 4.0–4.5 h, 4.5–5.0 h, 5.0–5.5 h, and >6.5 h performance groups in the age-group 40–44 years; the 5.5–6.0 h performance group in the age-group 45–49 years; and the 6.0–6.5 h performance group in the age-group 50–54 years (Table 2). Figure 2 presents the percentage frequency of performance groups by age-groups and sex.
 | Figure 1 Distribution of performance groups by sex and men-to-women ratio (). Note: The horizontal dashed line represents men-to-women ratio of at y=1. |
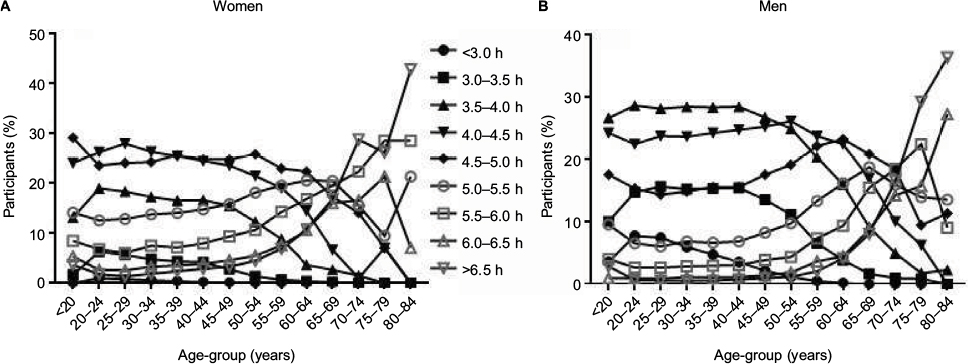 | Figure 2 Distribution (%) of performance groups by age-groups in women (A) and men (B). |
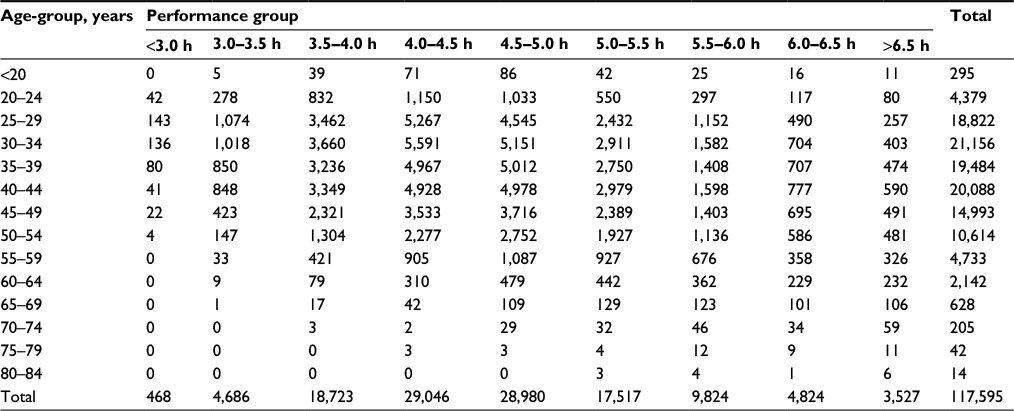 | Table 1 Number of women by performance group and age-group |
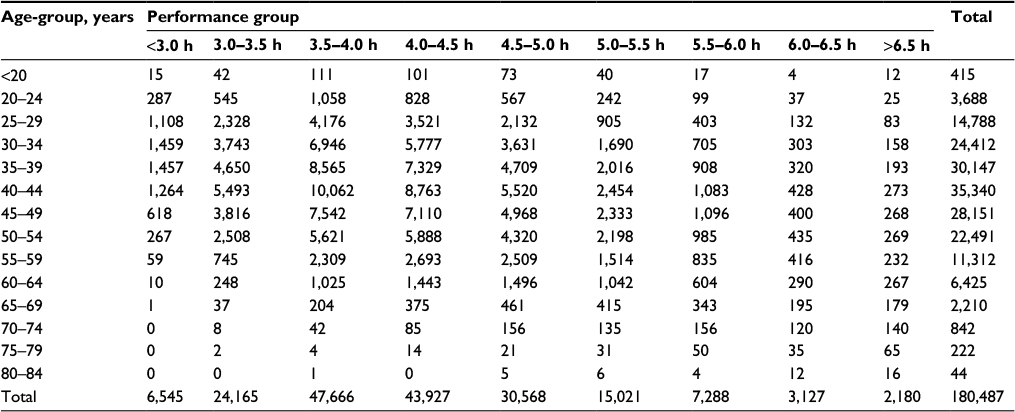 | Table 2 Number of men by performance group and age-group |
Split × performance group interaction on race speed and Δspeed
A small split × performance group interaction on race speed was observed in women (p<0.001, η2=0.049) and men (p<0.001, η2=0.052; Figure 3) with faster performance groups showing a more even pacing, ie, the Δspeed was closer to zero in the faster performance groups compared with their slower counterparts (Figure 4). An age-group × performance group interaction on Δspeed was shown for both sexes at 5 km, 10 km, 15 km, 20 km, 25 km, 30 km, 35 km, and 40 km (p<0.001, 0.001≤η2≤0.004; Figures 5 and 6) where athletes in older age-groups presented a relatively more even pace (ie, Δspeed closer to zero) than athletes in younger age-groups, a trend that was more noticeable in the relatively slow performance groups (Figures 7 and 8).
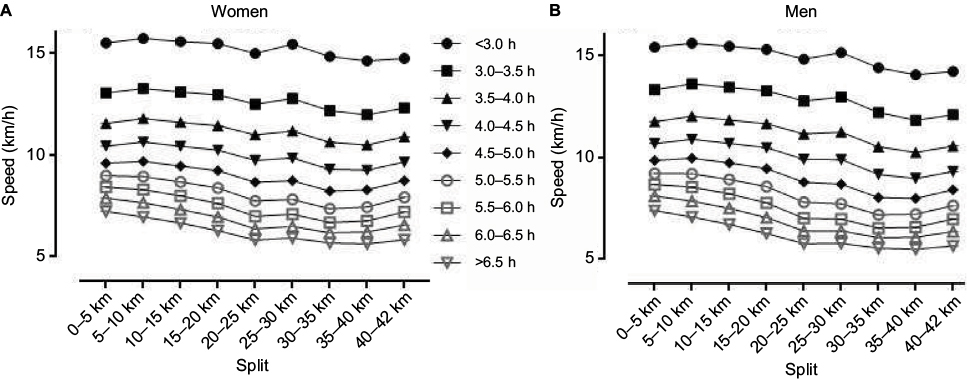 | Figure 3 Race speed by split and performance group in women (A) and men (B). |
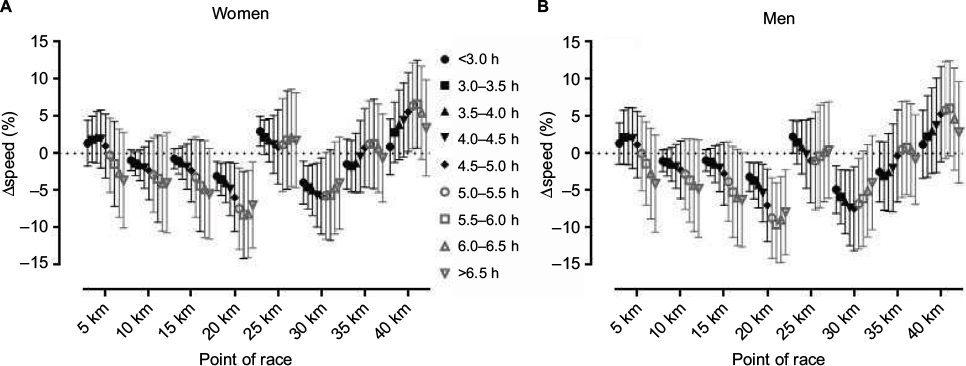 | Figure 4 Changes in speed (%) by point of race and performance group in women (A) and men (B). Note: Error bars represent standard deviations. |
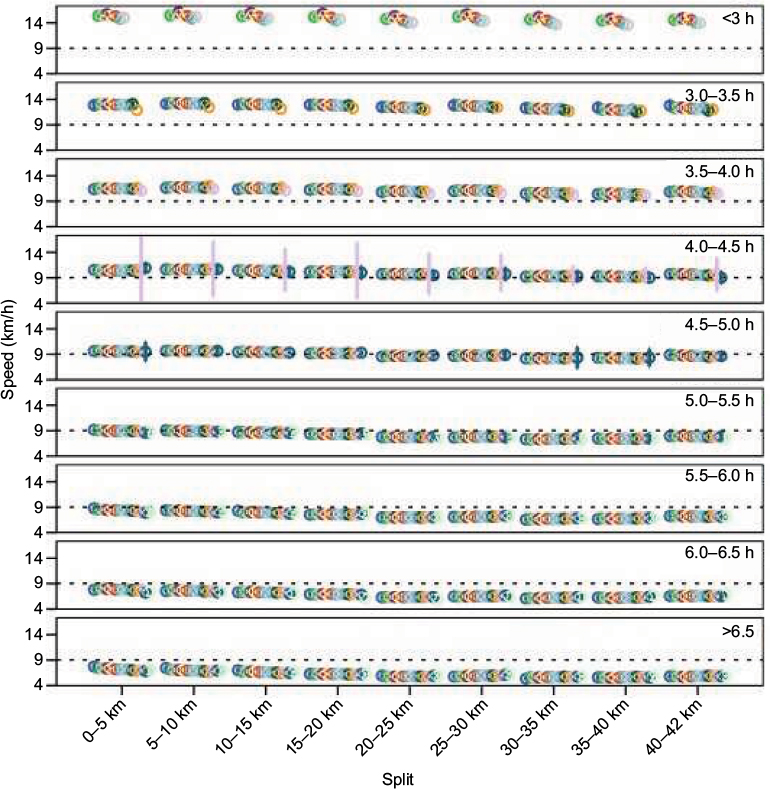 | Figure 5 Race speed by split, performance group, and age-group in women. Notes: Dashed horizontal line represents mean speed (9.03 km/h). Error bars represent standard error of mean. Age-groups are presented from the younger on the left to the older on the right within each split. |
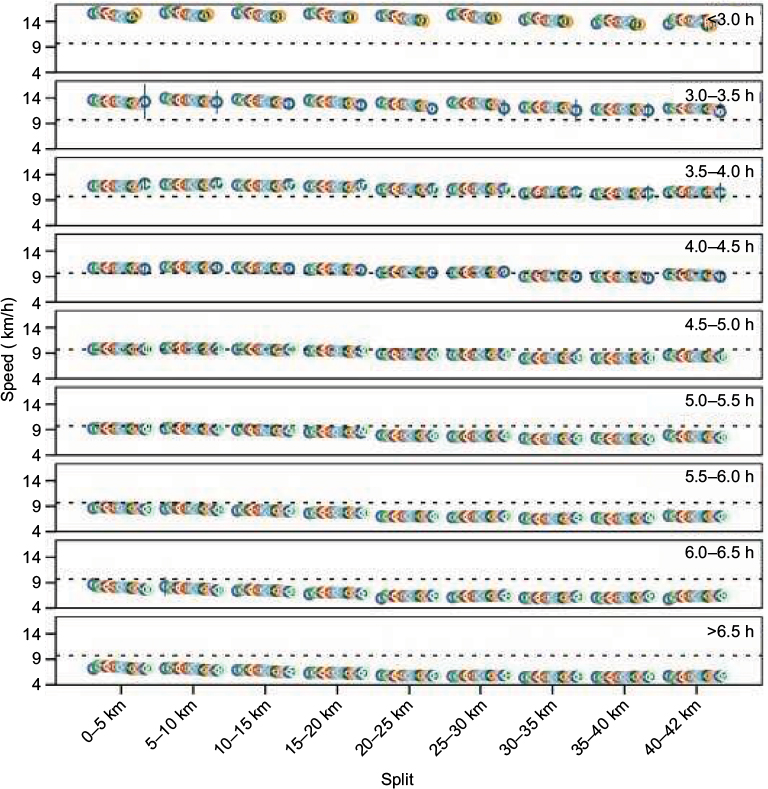 | Figure 6 Race speed by split, performance group, and age-group in men. Notes: Dashed horizontal line represents mean speed (9.69 km/h). Error bars represent standard error of mean. Age-groups are presented from the younger on the left to the older on the right within each split. |
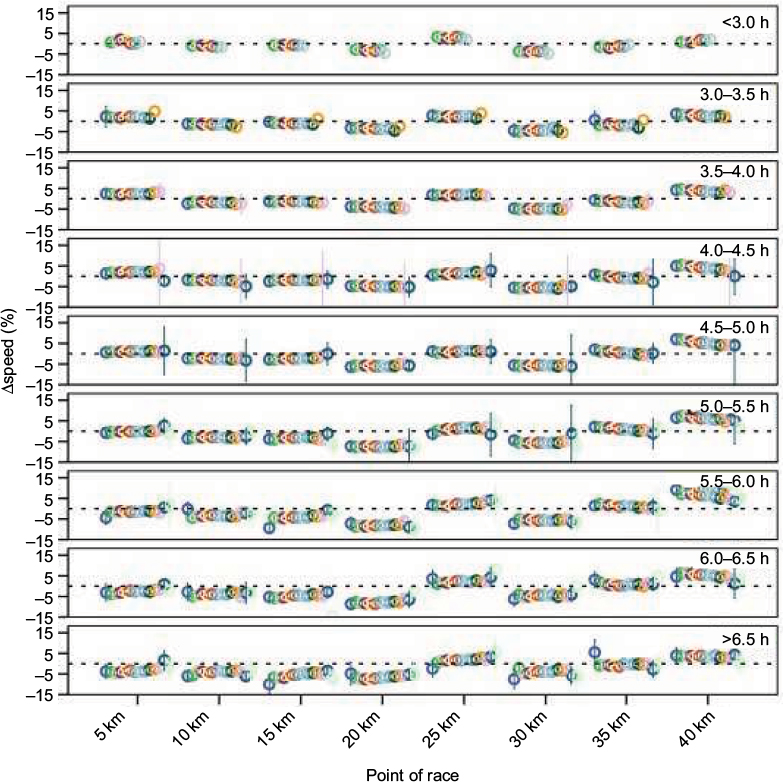 | Figure 7 Changes in speed (%) by point of race, performance group, and age-group in women. Notes: Dashed horizontal line represents zero. Error bars represent standard error of mean. Age-groups are presented from the younger on the left to the older on the right within point of the race. |
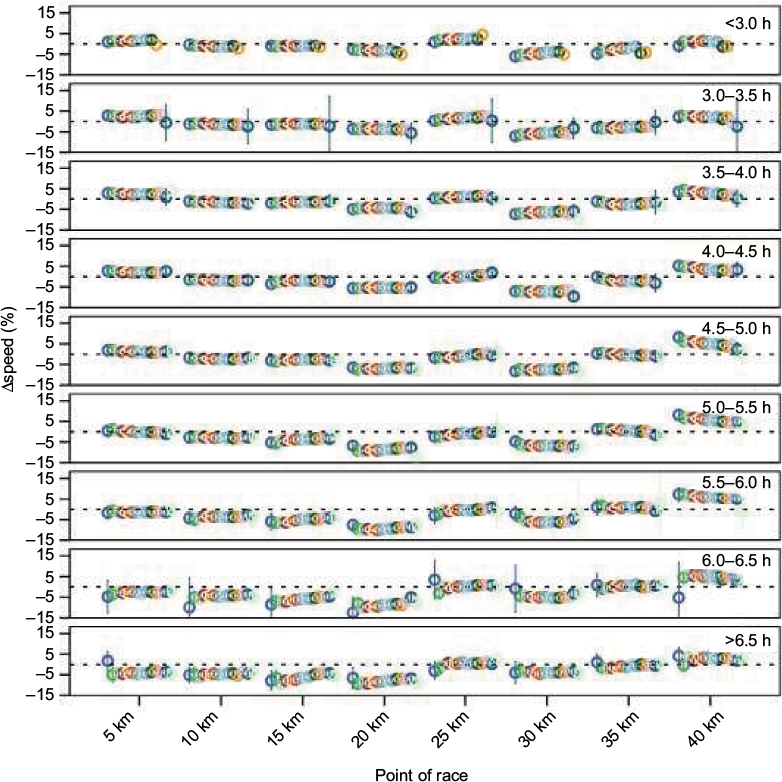 | Figure 8 Changes in speed (%) by point of race, performance group, and age-group in men. Notes: Dashed horizontal line represents zero. Error bars represent standard error of mean. Age-groups are presented from the younger on the left to the older on the right within point of the race. |
End spurt
An end spurt × performance group association was shown in both sexes (women, χ2=1,357.9, p<0.001, j=0.107; men, χ2=2.967.9, p<0.001, j=0.128; Figure 9). According to this association, the largest prevalence was found in the 5.0–5.5 h performance group in women (88.5%) and the 5.5–6.0 h group in men (83.6%) and the lowest in the <3.0 h performance group in both sexes (64.1% and 62.8%, respectively). An inverse U shape of the association between the prevalence of end spurt and performance group was demonstrated in both sexes. An end spurt × age-group was observed in all performance groups (p<0.05), except the <3.0 h, 3.0–3.5 h, 6.0–6.5 h, and >6.5 h performance groups in women (Figure 10A) and the <3.0 h, 6.0–6.5 h, and >6.5 h performance groups in men (Figure 10B).
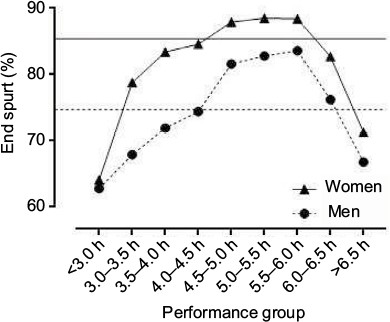 | Figure 9 Prevalence of end spurt by performance group and sex. Notes: Dashed and solid horizontal lines represent overall prevalence of end spurt in women (85.4%) and men (74.7%), respectively. End spurt was defined as Δspeed at 40 km >0% (ie, increased speed in 40–42 km split compared with 35–40 km split). |
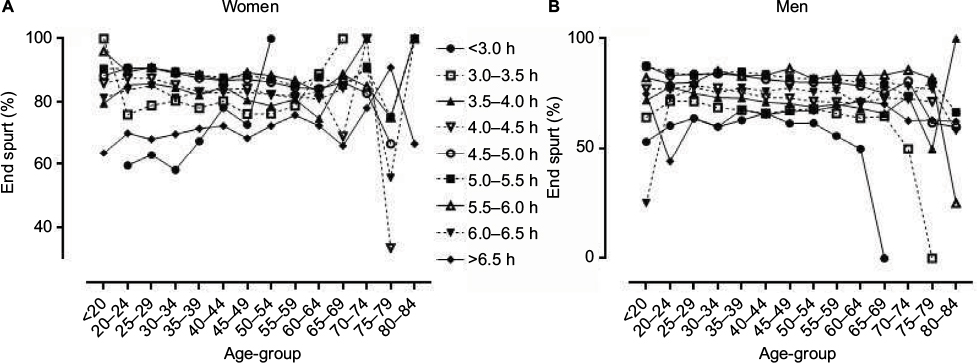 | Figure 10 Prevalence of end spurt by performance group and age-group in women (A) and men (B). Note: End spurt was defined as Δspeed at 40 km >0% (ie, increased speed in 40–42 km split compared with 35–40 km split). |
Discussion
The main finding of the present study was a trivial split × age-group interaction on running speed which was observed for all performance groups in both sexes, which was more pronounced (larger changes in speed) in the slower performance groups, whereas less variability in change of running speed was observed in the fastest performance group. Secondary findings were that 1) more men were observed in the faster and more women in the slower performance groups; 2) compared with the other performance groups, the slower performance groups had larger percentage changes in running speed, especially in the first half of the race; 3) the faster performance groups had less percentage changes in running speed during the race; and 4) the prevalence of an end spurt in an inverse U shape relationship with performance groups was observed.
Overall pattern of pacing
Considering the classification of pacing into negative, all-out, positive, even, parabolic-shaped, and variable,13 the pattern of pacing in the present study was characterized as positive, ie, the finishers increased the time spent in each split across the race (ie, their running speed decreased). The positive pacing of the finishers in the present study was not in agreement with that of elite runners competing in Olympic and IAAF World Championship marathons that showed the maintenance of an even-paced running from 10 km onward.14 In these two top competitions, the pacing of the elite runners might be influenced by the existence of many “groups” for long periods before runners “breaking away” in the later stages of the competition. This disagreement should be attributed to the runners’ performance level. We observed in our results that the fastest runners adopted a relatively more even pacing compared with the slower runners. On the other hand, our findings confirmed those of a previous study on the “New York City Marathon” that characterized the pacing of all performance (quartiles) groups as positive accompanied by less variability in speed across the race in the fastest runners.9 Moreover, a positive pacing was found in an analysis of 14 US marathons,6 where the second half was slower than the first one. The least variability in speed observed in the fastest runners should partially be due to their greater experience6 in addition to other factors (eg, superior physiological characteristics).
“End spurt”
An increase in running speed was noticed only at three points of the race (5 km, 25 km, and 40 km). A decrease in elevation could explain the increase in speed at 5 km and 25 km; however, the increase in speed at 40 km might be due to an “end spurt” as the elevation did not change remarkably at this point. In agreement with the overall effect of performance on pacing (ie, smaller changes of speed in the faster runners), the fastest runners showed the least prevalence of “end spurt.” An explanation of the occurrence of an “end spurt” might be the knowledge of approaching the finish line encouraging the runners to mobilize the last reserves of energy.5 Previous studies on ultra-marathoners competing in the “100 km Lauf Biel,”15 ultra-marathoners competing in 101 km and 161 km,16 and shorter distances, such as 1 mile,17 highlighted the occurrence of an “end spurt” too.
The larger changes in running speed, including the occurrence of an “end spurt,” observed in the slower runners might be due to the current recommendations for novice runners, according to which large changes in running speed such as alternating run and walk are advised for a successful finish time.18 In this case, a previous mix of running and walking is expected to be replaced by running in the final 2.2 km, resulting in a more pronounced “end spurt” in the slow performance groups.
Pacing by performance level
We observed a small effect of performance level on pacing, according to which the faster runners showed smaller changes of speed during the race in both sexes. For instance, the slowest performance group had the largest percentage decrease in running speed at four points of the race (5 km, 10 km, 15 km, and 20 km) and the largest percentage increase in running speed at two points (35 km and 40 km). This finding was in agreement with previous research that showed a less variable pacing in the faster runners compared with their slower counterparts.6,8,9,19,20 It was also in agreement with previous studies on other running distances such as half-marathon21 and 100 km ultra-marathon.15,22
Performance × age interaction on pacing
The novel finding of the present study was that the effect of age on pacing varied by race time (larger effect of age was observed in the slower performance groups). The small changes in speed that were observed in both young and old fast runners could be attributed to their large training volumes and superior physiological characteristics compared with their slower counterparts. Within a performance group, the older runners paced more evenly, which was observed especially in the slower performance groups. Thus, it was assumed that the origin of the differences in pacing among runners with similar performance level but at different age might be the age-related variation of the physiological and training characteristics associated with the performance in marathon.23–25
Limitations and strengths
The main limitation of the present study was the definition of performance groups, which relied on race time (ie, “absolute” performance), in contrast with the methodological approach of defining performance groups based on quartiles of race time (ie, “relative” performance).9 Therefore, examining age-related differences within a particular performance group resulted in different “relative” performances among these age-groups (ie, compared with other runners within an age-group), eg, 3.0–3.5 h male runners were almost the fastest in age-groups older than 55–59 years, whereas they finished after hundreds of runners in the younger age-groups. On the other hand, a strength of the study was that this “absolute” approach in performance groups allowed comparing similar race times.3,9 Coaches and runners would be more interested in the performance analysis by race time groups considering that they may train runners of similar race time but at different age. Further studies should address the question of age-group × performance group interaction on pacing in marathons with different characteristics (eg, larger changes in elevation and temperature) that might magnify the magnitude of this interaction. For instance, we assume larger differences in pacing between fast young and old runners in a mountain marathon inducing extra muscular effort considering the effect of aging on body composition and muscle strength.24,25
Conclusion
Although it was shown previously that pacing is related to race time, whereas sex, age, and performance level were identified as correlates of pacing, we had no knowledge about the age × performance level interaction on pacing, ie, whether runners with similar race time but at different age present different variation of running speed during a marathon race. The main finding of the present study was a significant age × performance level interaction on pacing, according to which the younger age-groups showed larger changes in speed during the race than the older age-groups, and this trend was more pronounced in runners with relatively slow race time. Therefore, coaches and trainers working with marathon runners should consider the influence of age on pacing, especially when they train runners with slow race time but at different age.
Disclosure
The authors report no conflicts of interest in this work.
References
Tschopp M, Brunner F. [Diseases and overuse injuries of the lower extremities in long distance runners]. Z Rheumatol. 2017;76(5):443–450. German. | ||
Available from: www.runningusa.org/. | ||
Renfree A, St Clair Gibson A. Influence of different performance levels on pacing strategy during the Women’s World Championship marathon race. Int J Sports Physiol Perform. 2013;8(3):279–285. | ||
Angus SD. Did recent world record marathon runners employ optimal pacing strategies? J Sports Sci. 2014;32(1):31–45. | ||
Skorski S, Abbiss CR. The manipulation of pace within endurance sport. Front Physiol. 2017;8:102. | ||
Deaner RO, Carter RE, Joyner MJ, Hunter SK. Men are more likely than women to slow in the marathon. Med Sci Sports Exerc. 2014;47(3):607–616. | ||
Trubee NW, Vanderburgh PM, Diestelkamp WS, Jackson KJ. Effects of heat stress and sex on pacing in marathon runners. J Strength Cond Res. 2014;28(6):1673–1678. | ||
March DS, Vanderburgh PM, Titlebaum PJ, Hoops ML. Age, sex, and finish time as determinants of pacing in the marathon. J Strength Cond Res. 2011;25(2):386–391. | ||
Santos-Lozano A, Collado P, Foster C, Lucia A, Garatachea N. Influence of sex and level on marathon pacing strategy. insights from the New York City race. Int J Sports Med. 2014;35(11):933–938. | ||
Available from: www.tcsnycmarathon.org/sites/default/files/NYC%20Marathon%20Elevation%20Profile_2014.pdf. Accessed January 10, 2017. | ||
Cohen J. Statistical Power Analysis for the Behavioral Sciences. 2nd ed. Hillsdale, NJ: Lawrence Erlbaum Associates; 1988. | ||
Abbiss CR, Laursen PB. Describing and understanding pacing strategies during athletic competition. Sports Med. 2008;38(3):239–252. | ||
Hanley B. Pacing, packing and sex-based differences in Olympic and IAAF World Championship marathons. J Sports Sci. 2016;34(17):1675–1681. | ||
Knechtle B, Rosemann T, Zingg MA, Stiefel M, Rust CA. Pacing strategy in male elite and age group 100 km ultra-marathoners. Open Access J Sports Med. 2015;6:71–80. | ||
Tan PLS, Tan FHY, Bosch AN. Similarities and differences in pacing patterns in a 161-km and 101-km ultra-distance road race. J Strength Cond Res. 2016;30(8):2145–2155. | ||
Noakes TD, Lambert MI, Hauman R. Which lap is the slowest? An analysis of 32 world mile record performances. Br J Sports Med. 2009;43(10):760–764. | ||
Hottenrott K, Ludyga S, Schulze S, Gronwald T, Jäger FS. Does a run/walk strategy decrease cardiac stress during a marathon in non-elite runners? J Sci Med Sport. 2016;19(1):64–68. | ||
Haney TA Jr, Mercer JA. A description of variability of pacing in marathon distance running. Int J Exerc Sci. 2011;4(2):133–140. | ||
Ely MR, Martin DE, Cheuvront SN, Montain SJ. Effect of ambient temperature on marathon pacing is dependent on runner ability. Med Sci Sports Exerc. 2008;40(9):1675–1680. | ||
Hanley B. Pacing profiles and pack running at the IAAF World Half Marathon Championships. J Sports Sci. 2015;33(11):1189–1195. | ||
Lambert MI, Dugas JP, Kirkman MC, Mokone GG, Waldeck MR. Changes in running speeds in a 100 KM ultra-marathon race. J Sports Sci Med. 2004;3(3):167–173. | ||
Hawkins S, Wiswell R. Rate and mechanism of maximal oxygen consumption decline with aging: implications for exercise training. Sports Med. 2003;33(12):877–888. | ||
Maharam LG, Bauman PA, Kalman D, Skolnik H, Perle SM. Masters athletes: factors affecting performance. Sports Med. 1999;28(4):273–285. | ||
Faulkner JA, Davis CS, Mendias CL, Brooks SV. The aging of elite male athletes: age-related changes in performance and skeletal muscle structure and function. Clin J Sport Med. 2008;18(6):501–507. | ||
Foster C, Wright G, Battista RA, Porcari JP. Training in the aging athlete. Curr Sports Med Rep. 2007;6(3):200–206. |
 © 2017 The Author(s). This work is published and licensed by Dove Medical Press Limited. The
full terms of this license are available at https://www.dovepress.com/terms
and incorporate the Creative Commons Attribution
- Non Commercial (unported, 3.0) License.
By accessing the work you hereby accept the Terms. Non-commercial uses of the work are permitted
without any further permission from Dove Medical Press Limited, provided the work is properly
attributed. For permission for commercial use of this work, please see paragraphs 4.2 and 5 of our Terms.
© 2017 The Author(s). This work is published and licensed by Dove Medical Press Limited. The
full terms of this license are available at https://www.dovepress.com/terms
and incorporate the Creative Commons Attribution
- Non Commercial (unported, 3.0) License.
By accessing the work you hereby accept the Terms. Non-commercial uses of the work are permitted
without any further permission from Dove Medical Press Limited, provided the work is properly
attributed. For permission for commercial use of this work, please see paragraphs 4.2 and 5 of our Terms.