Back to Journals » International Journal of Nanomedicine » Volume 11
Effect of a controlled-release drug delivery system made of oleanolic acid formulated into multivesicular liposomes on hepatocellular carcinoma in vitro and in vivo
Authors Luo Y, liu Z, Zhang X, huang J, Yu X, li J, Xiong D, Sun X, Zhong Z ![]()
Received 14 March 2016
Accepted for publication 25 May 2016
Published 12 July 2016 Volume 2016:11 Pages 3111—3129
DOI https://doi.org/10.2147/IJN.S108445
Checked for plagiarism Yes
Review by Single anonymous peer review
Peer reviewer comments 3
Editor who approved publication: Professor Lei Yang
Yuling Luo, Zhongbing Liu, Xiaoqin Zhang, Juan Huang, Xin Yu, Jinwei Li, Dan Xiong, Xiaoduan Sun, Zhirong Zhong
Department of Pharmaceutical Sciences, School of Pharmacy, Southwest Medical University, Luzhou, Sichuan,People’s Republic of China
Abstract: The aim of the present study was to develop a novel dosage form of multivesicular liposomes for oleanolic acid (OA) to overcome its poor solubility, prolong therapeutic drug levels in the blood, and enhance the antitumor effect on hepatocellular carcinoma. OA-encapsulated multivesicular liposomes (OA-MVLs) were prepared by a double-emulsion method, and the formulation was optimized by the central composite design. The morphology, particle size, and drug-loading efficiency of OA-MVLs were investigated. Furthermore, OA-MVLs were also characterized both in vitro and in vivo. The results showed that OA-MVLs were spherical particles with an average particle size of 11.57 µm and an encapsulation efficiency of 82.3%±0.61%. OA-MVLs exhibited a sustained-release pattern in vitro, which was fitted to Ritger–Peppas equation. OA-MVLs inhibited the growth of human HepG2 cells which was confirmed by the MTT assay and fluorescence microscopy detection. The in vivo release of OA from OA-MVLs exhibited a sustained manner, indicating a longer circulation time compared to OA solution. The in vivo toxicity study indicated that medium-dose OA-MVLs exerted no toxic effect on the hosts. Importantly, OA-MVLs suppressed the growth of murine H22 hepatoma and prolonged the survival of tumor-bearing mice. In conclusion, the poorly soluble OA could be encapsulated into MVLs to form a novel controlled-release drug delivery system. The present study may hold promise for OA-MVLs as a new dosage form for sustained-release drug delivery in cancer therapy.
Keywords: oleanolic acid, multivesicular liposomes, murine hepatocellular carcinoma, controlled release, cancer therapy
Introduction
Oleanolic acid (OA) is a kind of pentacyclic triterpenoid widely found in plant kingdom such as glossy privet fruits and hawthorn fruits. It has been used in traditional Chinese medicine to treat liver disorders for over 20 years,1 and it also exhibits many biological activities such as anti-inflammatory, antioxidant, antitumor, antiviral, two-way-mediated immunity, lipid-lowering, hypoglycemic, hepatoprotective, and anti-hyperlipidemic effects.1–6 Modern pharmacology study shows that OA has a protective effect on the liver, which could revert necrosis-degenerated liver tissue back to its normal form, enhance alanine vitality, relieve inflammation of liver tissue, promote liver cell regeneration, and repair necrotic area rapidly.5 There are also reports that OA exerts antitumor effect and provides resistance against mutation.7,8 Its anticancer mechanism mainly includes inhibition of tumor cell proliferation cycle and tumor angiogenesis.9 At present, OA is mainly used in clinical application for treatment of acute icteric hepatitis and chronic poisoning, and as an auxiliary anticancer drug.
Hepatocellular carcinoma (HCC) is the fifth most common cancer and the third leading cause of cancer-related death worldwide. It is an aggressive tumor that often occurs in the setting of chronic liver disease and cirrhosis.10 Typically, diagnosis is not easy, and the median survival following diagnosis is poor (~6–20 months). It is reported that HCC arises most frequently in the setting of chronic liver inflammation and fibrosis due to viral infections, metabolic injuries, toxic insults, or autoimmune reaction.11 OA exhibits therapeutic effect on the complications mentioned. The conventional clinical formulations of OA are tablets and capsules, which possess significant first-pass effect of hepar and undergoes low dissolution in gastrointestinal tract because of the poor water solubility.12–14 Therefore, it is essential to develop a novel dosage form for OA to improve the treatment efficiency for HCC.
Some dosage forms of OA have been introduced such as liposomes,15 nanoliposomes,16 nanoparticle suspension,17 oral microemulsion,18 and solid dispersions,19 but they showed some shortcomings, such as poor long-term stability, small drug loading, and unobvious release effect. Multivesicular liposomes (MVLs) have received great attention due to their excellent stability and longer duration of release.
MVL is reported to be a unique lipid-based depot delivery system prepared by DepoFoam™ technology, and it has been demonstrated to be an effective sustained-release delivery system with the release duration ranging from days to several weeks.20 MVL is distinguished structurally from unilamellar vesicles and multilamellar vesicles. It comprises a set of closely packed nonconcentric internal aqueous chambers separated by a network of lipid layers.21,22 The uniqueness of the structure is due to the presence of triolein in the MVL particles, which is essential in MVL and absent in conventional liposomes. The triolein in MVL, as a kind of neutral oil and a part of corners or edges where membranes meet each other, can be used as a tool to alter the release profiles of encapsulated drugs.23 Only breaches in the outermost membranes of an MVL participate in release of encapsulated drug to the external medium; release of drug from the internal vesicles results in a redistribution of drug inside the particle instead of drug release from the particle.24 The particles are tens of microns in diameter which are about ten times larger than that of unilamellar vesicles and multilamellar vesicles. Due to the large size, these MVL particles will not be rapidly cleared by tissue macrophages and can act as a drug depot. Moreover, not only could MVLs encapsulate water-soluble substances with high efficiency,25 but also in their internal part exists a large amount of lipid bilayer which provides possibility for carrying a good deal of fat-soluble drugs. Therefore, given their special structures and large size, MVLs provide a higher stability and a longer duration of drug release when compared with conventional liposomes.23
In the present study, just as shown in Figure 1, we managed to develop a novel dosage form of MVLs for OA to overcome its poor solubility, maintain the therapeutic drug level in the blood for long time, and enhance the antitumor effect on murine HCC. First, OA-encapsulated MVLs (OA-MVLs) were prepared by the double-emulsion method, and the formulation was optimized by central composite design. Then, cellular uptake and cell proliferation inhibition against HepG2 cells were evaluated. Moreover, the evaluation of in vitro drug release profile and pharmacokinetics of OA-MVLs in rats was carried out. Finally, the effects of tumor inhibition and survival prolongation of OA-MVLs were investigated in H22 tumor-bearing mice through intraperitoneal (ip) administration.
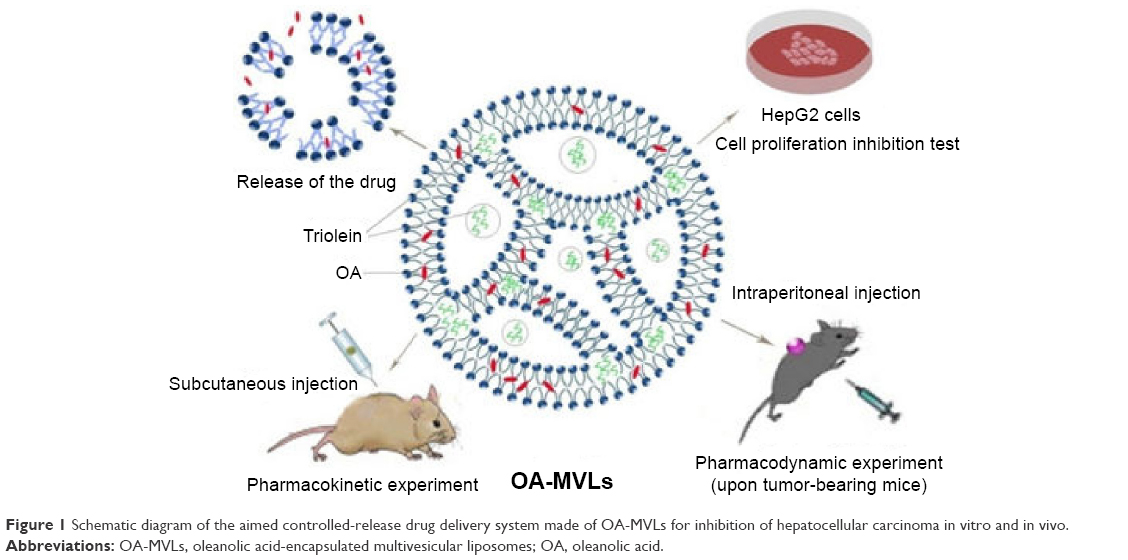 | Figure 1 Schematic diagram of the aimed controlled-release drug delivery system made of OA-MVLs for inhibition of hepatocellular carcinoma in vitro and in vivo. |
Materials and methods
Materials
OA was purchased from Keyang (Luzhou, People’s Republic of China); standard of OA was purchased from Must BioTechnology Company (Chengdu, People’s Republic of China; purity >98%); soybean lecithin was purchased from Tywei Pharmaceutical Company (Shanghai, People’s Republic of China; purity >90%), and stearic acid was obtained from National Medicine Group Chemical Company (Beijing, People’s Republic of China). Triolein was purchased from Aladdin Chemistry Company (Shanghai, People’s Republic of China). Cholesterol, Tween-80, polyvinyl alcohol, acetic acid, and triethylamine were purchased from Kelong Chemical Reagent Factory (Chengdu, People’s Republic of China). The original ginseng diol standard was obtained from the Source Leaves Biological Technology Company (Shanghai, People’s Republic of China; purity >98%).
Rosewell Park Memorial Institute (RPMI) 1640 culture medium was purchased from Hammer Flew Biochemical Company (Beijing, People’s Republic of China). Fetal bovine serum was purchased from TianHang Biotechnology Company (Huzhou, People’s Republic of China). Tyrisin was supplied by Thermo Fisher Scientific (Waltham, MA, USA), and 3-(4,5-methylthiazol-2-yl)-2, 5-diphenyltetrazolium bromide (MTT) was obtained from Keyang. Paraformaldehyde was purchased from Jinshan Chemical Company (Chengdu, People’s Republic of China) and 4′,6-diamidino-2-phenylindole (DAPI) was supplied by BETTE (Shanghai, People’s Republic of China).
Cells and animals
Human HepG2 and murine H22 hepatoma cells (syngeneic to the Kunming strain of mice) were cultured in complete RPMI 1640 medium supplemented with 10% (v/v) fetal bovine serum, penicillin (100 U/mL), and streptomycin (100 μg/mL). The cells were maintained in an incubator at 37°C with a 5% CO2 atmosphere. The use of human cells was approved by the Human cell Ethics Committee of Southwest Medical University.
Eight- to 10-week-old female Sprague Dawley rats (150–220 g) and 6- to 8-week-old male Kunming mice (18–22 g) were obtained from the Laboratory Animal Center of Southwest Medical University, Luzhou, People’s Republic of China, and housed under controlled humidity, temperature, and lighting conditions in facilities. All animal experiments were approved by the Animal Ethics Committee of Southwest Medical University, and all procedures with animals were conducted according to the guidelines of the Local Animal Use and Care Committees of Luzhou and executed according to the National Animal Welfare Law of China.
Preparation of OA-MVLs
OA-MVLs were prepared by the double-emulsion method21,26 according to the optimized formulation from the central composite design. Briefly, the mixture of soybean lecithin (80 mg), cholesterol (45.6 mg), triolein (30 mg), stearic acid (1 mg), and OA (16 mg) was dissolved in 0.75 mL solvent made of chloroform/diethyl ether (1:1, v/v) and was emulsified with 0.5 mL of aqueous solution (7% sucrose) by shearing at 13,500 rpm for 2 minutes to obtain a water-in-oil emulsion (the first emulsion). A subsequent emulsification with the second aqueous solution of 4% glucose containing 2% Tween-80 and 0.3% polyvinyl alcohol yielded a water-in-oil-in-water double emulsion (the second emulsion). The second emulsion was transferred to a 10 mL round-bottom flask. Then, chloroform and diethyl ether were removed by rotary evaporation at room temperature for ~15 minutes to form the OA-MVLs. Blank MVLs without drug as control were also prepared using the same procedure. All the procedures for preparation of the OA-MVLs and blank MVLs were performed under strictly sterile conditions. The final products were stored at 4°C for further use.
Morphology and particle size of OA-MVLs
The morphology of OA-MVLs was observed under light microscopy. The diameter of OA-MVLs was determined by the high-resolution photographs taken using a microscope, with Image-pro plus 6.0 professional image-processing software (Media Cybernetics, Inc., Bethesda, MD, USA), to measure the average particle size. All the measurements were carried out in triplicate.
Determination of encapsulation efficiency by HPLC
Chromatographic conditions
The content analysis of OA in various samples was carried out using a high-performance liquid chromatography (HPLC) system consisting of a photodiode array detector. Separation was performed on a reverse-phase C18 column (4.6×250 mm, 5 μm particle size) with a guard column (Phenomenex C18, 4.0×3.0 mm) maintained at 30°C. The flow phase was a mixture of methanol, water, acetic acid, and triethylamine (90:10:0.04:0.02, v/v/v/v) at a flow rate of 0.8 mL/min. Chromatographic separation was monitored at 210 nm, and the injection volume was 20 μL.
Method validation
HPLC analysis method used in this study was validated through specificity, linearity, limit of detection, precision, accuracy, and extraction recovery. Specificity of the method was determined by analyzing the chromatograms of OA standards, blank MVLs, and OA-MVLs as a representative sample. Standard calibration curve was prepared with five calibrators over the concentration range of 5–200 μg/mL for OA. The data of peak area versus concentration were tested by linear least square regression analysis. A standard curve was evaluated for intra-day and inter-day linearity. Intra- and inter-day accuracy and precision were determined by analyzing the quality control (QC) standard solutions at low, medium, and high concentrations on the same day and on different days. The extraction recoveries of OA at three QC levels were determined by comparing the peak area of OA standard stock solution with blank MVLs.
Sample preparation
Five hundred microliters of OA-MVLs solution was dissolved in 5 mL methanol and filtrated through a 0.22 μm microporous membrane to detect the total amount of OA in the formulation of OA-MVLs. Another 500 μL of OA-MVLs solution was mixed with 1 mL saline and centrifuged at 4°C for 12 minutes at a speed of 434× g. Then, the upper layer of clear liquid was collected and diluted by adding methanol. After filtration using 0.22 μm microporous membrane, the free amount of OA in OA-MVLs was measured by HPLC (Agilent 1260; Agilent Technologies, Santa Clara, CA, USA) according to the chromatographic conditions mentioned earlier. The encapsulation efficiency (EE%) was calculated using the following formula: EE% = (Ctotal − Cfree)/Ctotal ×100. Among them, Cfree was the amount of free OA in OA-MVLs formulation, and Ctotal was the total amount of OA in the same amount of OA-MVLs formulation.
Stability study of OA-MVLs
To estimate the physical stability of OA-MVLs, the newly prepared OA-MVLs (n=3) were placed into the glass vials and stored in the refrigerator at 4°C for 30, 60, and 90 days. The drug-leakage rate was monitored using the HPLC method described earlier. Meanwhile, characterization of morphological changes of OA-MVLs in vitro was done under an optical microscope once every hour within 12 hours from the beginning of the storage.
In addition, the serum stability assay was performed as follows: three batches of freshly prepared OA-MVLs (2 mL) were mixed with the same volume of bovine calf serum and placed into dialysis bags (molecular weight cut-off =2,000 Da) which were suspended in 100 mL phosphate-buffered saline (PBS) solution (pH 7.4). The sealed vials were placed in a water bath (37°C) at a stirring speed of 50 rpm. At predetermined time intervals of 0, 0.5, 1, 2, 3, 5, 7, and 10 hours, 1 mL of the solution was withdrawn and replaced with fresh PBS, and this was repeated for three times, with PBS as controls. The samples were measured by HPLC method as described earlier to calculate the accumulative percentage of leakage.
In vitro release profile
The PBS medium containing 0.3% Tween-80 (pH 7.4) was used for the in vitro drug release experiment. Three batches of freshly prepared OA-MVLs were placed into dialysis bags (molecular weight cut-off =2,000 Da) and suspended in 30 mL release medium. The sealed vials were placed in a water bath at 37°C with thermostatic oscillator (50 rpm). At predetermined time intervals of 0.5, 1, 2, 4, 6, 8, 12, 24, 36, 48, 72, 96, and 120 hours, 1 mL of the solution was withdrawn from the release medium and replaced with fresh medium. After filtration through a 0.22 μm millipore membrane, all the samples were determined using HPLC method as described earlier.
Pharmacokinetic evaluation of OA-MVLs in rats
Drug administration and blood sample collection
Two groups of five rats each were treated with OA solution or OA-MVLs at a single dose of 10 mg/kg via subcutaneous (sc) injection;16 the OA solution was prepared by dissolving OA in polyethylene glycol 400 (0.2%) and further diluting with saline for injection. Blood samples were collected from the ophthalmic veins after administration. The different time intervals for OA solution-treated group and OA-MVLs-treated group were determined according to the results of the pre-experiments. The time points were 0.25, 0.5, 1, 1.5, 2, 3, 5, 7, 9, and 11 hours for OA groups, and 0.5, 1, 2, 4, 8, 12, 24, 36, 48, 60, 72, and 96 hours for OA-MVLs group. The heparinized blood was immediately centrifuged at 1,700× g for 10 minutes. The plasma aliquots were collected and stored at −20°C until analysis.
Sample preparation, measurement, and data analysis
After thawing the deep-frozen samples at 4°C, an aliquot of each plasma sample (200 μL) was transferred to a 2 mL tube, and the same volume of a mixture of methanol and protopanoxadiol (internal standard) was added. Then, the samples were vortexed for 7 minutes and centrifuged at 15,637× g for 15 minutes. Subsequently, the supernatants were transferred into another tube and dried under nitrogen at 35°C. The residues were reconstituted with 300 μL methanol, vortexed for 3 minutes, and centrifuged at 15,637× g for 10 minutes. The supernatants were filtrated through a 0.22 μm millipore membrane and subjected to content determination using HPLC method mentioned earlier. Briefly, the determination conditions were as follows: reverse-phase C18 column, 4.6×250 mm and 5 μm particle size; flow phase, a mixture of methanol/water/acetic acid/triethylamine (90:10:0.04:0.02, v/v/v/v); flow rate, 1.0 mL/min; monitoring wavelength, 210 nm; column temperature, 30°C; and injection volume, 20 μL. The pharmacokinetic parameters of OA administered by sc injection were calculated by non-compartmental analysis using Phoenix WinNonlin 6.3 (Pharsight Corporation, St Louis, MO, USA).
IC50 determination by MTT assay
The cell proliferation inhibitory effect of OA-MVLs on HepG2 cells was evaluated by MTT assay. Briefly, cells were adjusted to a density of 4×10⁵ cells/mL and seeded into 96-well plates (100 μL/well), and cultured for 48 hours at 37°C. Then, the cells were treated with OA-MVLs at different concentrations such as 10, 20, 40, 80, 120, 160, 200, 220, 240, 250, 260, 270, 280, 290, 300, 310, 320, 330, and 350 μmol/L, and concentrations of OA solution were maintained consistent with those of OA-MVLs.9 After incubation for 24 hours, 20 μL of MTT reagent (5 mg/mL) was added to each well, and the plate was incubated for another 4 hours at 37°C in the dark. The liquid was then removed, and the remaining crystals were solubilized with 150 μL of dimethyl sulfoxide. The plate was incubated for an additional 10 minutes at 37°C with gentle shaking before the measurement of absorbance at 490 nm using Varioskan Flash instrument (Thermo Fisher Scientific Inc). The rate of cell proliferation inhibition was calculated by the following formula: Inhibition Rate (%) = (1 − Asample/Acontrol) ×100. Each assay was carried out in triplicate with the empty wells as the negative control and the well containing cell culture medium alone as the blank control.
Cell growth inhibition analysis by fluorescence microscopy
HepG2 cells were seeded into 12-well plates at a density of 4×10⁵ cells/well. After being cultured for 24 hours, the cells were treated with OA-MVLs at different concentrations such as 20, 40, 80, 120, 160, 180, 200, 240, 270, 280, and 290 μmol/L; the RPMI 1640 complete media without OA-MVLs were used as the control.9 Each concentration was set for three groups. Cells were incubated with OA-MVLs for 4 hours, and then the supernatant was removed. After being cultured for 24 hours, the cells were gently washed twice with PBS, fixed with 4% paraformaldehyde for 15 minutes, stained with 150 μL DAPI (5 mg/mL) for 3 minutes, and observed under fluorescence microscope.
Cellular uptake analysis by confocal laser microscopy
In order to further evaluate the rate of uptake of OA-MVLs by HepG2 cells, the intracellular distribution of OA-MVLs was observed under laser confocal scanning microscope.27
Briefly, HepG2 cells were seeded at a density of 4×10⁵ cells/well on the glass slide placed in 12-well plates with complete RPMI 1640 medium and incubated at 37°C and 5% CO2 until the confluence reached ~70%. The fluorescence-labeled DHPE (1%) was added in the oil phase to prepare the fluorescence-labeled OA-MVLs (fluo-OA-MVLs) according to the optimized formulation mentioned earlier. Subsequently, the fluo-OA-MVLs were added into the 12-well plates. After incubation for 4 hours, supernatants were removed, and the cells were washed twice with PBS. Then, the cells were fixed with 4% paraformaldehyde for 15 minutes, stained with 150 μL DAPI (5 mg/mL) for 3 minutes, mounted, and observed under fluorescence microscope.
Chronic toxicity study of OA-MVLs in the female Sprague Dawley rats
The animals were divided randomly into five groups (n=10) as follows: I, saline as control; II, blank MVLs; III, low-dose OA-MVLs, 25 mg/kg; IV, medium-dose OA-MVLs, 50 mg/kg; and V, high-dose OA-MVLs, 100 mg/kg.16,28,29 All the animals were given an ip injection of 2 mL of different formulations mentioned, on every other day for 30 days, and their body weight was weighed at every other week. Moreover, all the animals were observed once daily for the signs of toxicities and twice daily for mortality. The changes in gait, posture, and response to handling and the presence of clonic or tonic movements, stereotypes (eg, excessive grooming, repetitive circling), or bizarre behavior (eg, self-mutilation, walking backward) were recorded. Meanwhile, every group was randomly divided into part A and part B.
In part A, blood sample via orbital venous plexus was taken from all the animals every week, and the animals were sacrificed at 48 hours after the last sample collection. In part B, for restorative observation, all the rats were sacrificed on day 14 after the last sample collection. In both part A and part B, the blood samples from each rat were collected before the rat was euthanatized for blood chemistry tests and complete blood panel analysis in the affiliated hospital of Southwest Medical University (Luzhou, Sichuan, People’s Republic of China). Meanwhile, the samples of the heart, liver, lung, and kidney were rapidly excised, washed with saline, weighed, fixed with 10% formalin, and stained with hematoxylin and eosin (H&E) for pathological analysis. The viscera index in percentage was calculated by the following equation: viscera index = G0/G1 ×100, in which G0 was viscera weight and G1 was the body weight of rats.
In vivo antitumor activity
Tumor model and administration
H22 tumor cells were used for the in vivo study by inoculating them in the male Kunming mice. Briefly, the stocked murine hepatoma H22 cells were first subcultured in RPMI 1640 containing 10% fetal bovine serum and collected in 0.9% saline culture medium (1×10⁸ cells/mL). About 0.5 mL of cell suspension (containing 5×10⁷ cells) was injected into the abdominal cavity of the mouse. After developing ascites tumor on day 7, the mouse was sacrificed by administering CO2 and disinfected by immersing the body in 75% ethanol. Intraperitoneal tumor cells were collected, washed twice, and resuspended in saline. Viable cells were counted by trypan blue (0.4%) staining, and murine H22 hepatoma cells (1×10⁷ cells/mL) in 0.2 mL saline were injected subcutaneously into the right flank of each mouse on day 0. The tumor-bearing mice were divided randomly into five groups (n=10) as follows: I, saline as control; II, OA solution; III, low-dose OA-MVLs, 25 mg/kg; IV, medium-dose OA-MVLs, 50 mg/kg; and V, high-dose OA-MVLs, 100 mg/kg.16,28,29 On day 5 post-inoculation of cancer cells when the tumors reached a volume of 70–100 mm3, the treatments were initiated by ip injection with 500 μL of the solution mentioned. Meanwhile, every group was randomly divided into part A and part B with five mice each. In part A, the mice were treated on every other day for six times and were sacrificed by administering CO2 on day 17. The tumors were weighed and subjected to pathological analysis. In part B, the mice were given the treatment until half of the mice in control group were dead. All the mice were monitored every day with the help of a vernier caliper for measurement of tumor size after treatment. The tumor measurements were converted to tumor volume (V) by a formula (V = L·W2/2) and expressed as the mean ± standard deviation (SD), in which L and W were the length and width of tumor, respectively. Meanwhile, the body weight was weighted on days 0, 3, 6, 9, 12, and 14. The average growth rate of body weight in different groups was calculated according to the formula: (Weightday 14 − Weightday 0) ×100/Weightday 0. The death dates of mice were also recorded for survival rate analysis.
H&E staining of tumor tissues
After being treated for six times, the tumor-bearing mice were sacrificed, and the tumors were weighed and immediately fixed in 10% formalin for 4–6 hours for H&E staining. The fixed tumor tissues were dehydrated with gradient ethanol and embedded in paraffin. Tissue sections (5 μm) were then dewaxed and rehydrated according to the standard protocol. The sections were stained with H&E for pathological observation.
Statistical analysis
All experiments in this study were repeated at least three times, and the data are shown as the mean ± SD. Comparisons between different groups were carried out by Student’s t-test or one-way analysis of variance using SPSS, version 17.0 (SPSS Inc., Chicago, IL, USA). Differences in survival were analyzed using the Kaplan–Meier method. In all cases, P<0.05 was considered statistically significant.
Results
Morphology, particle size, and zeta potential of OA-MVLs
The morphological result of OA-MVLs is shown in Figure 2. From the data, we can find that most of OA-MVLs were spherical with multiple nonconcentric lipid vesicles inside. The mean diameter was 11.57 μm, and the particle size distribution was in accordance with a normal distribution. The absolute zeta potential was ~−13.35 mV, and the polydispersity index was 0.21.
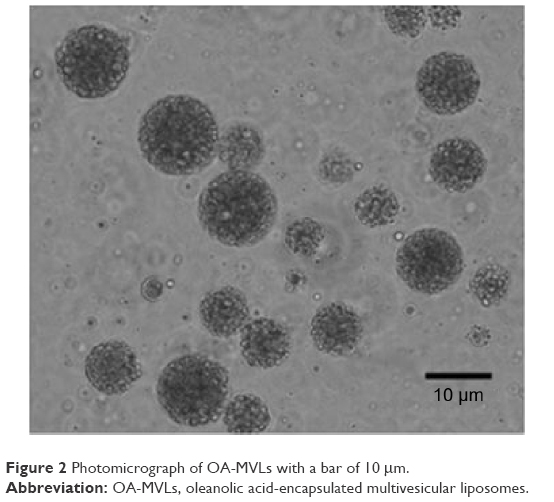 | Figure 2 Photomicrograph of OA-MVLs with a bar of 10 μm. |
Validation of HPLC analysis method and encapsulation efficiency of OA-MVLs
The chromatograms of blank MVLs, OA standards, and OA-MVLs showed that the retention time of a peak of OA from OA-MVLs was consistent with that of standard OA. No significant interfering peaks at or near the location of OA peak were observed. The result indicated that the HPLC method developed in this study was sensitive enough to determine OA. In terms of the linearity, the result indicated that the standard curve was linear over the ranges of 5–200 μg/mL and an excellent correlation between analyzed peak area and concentration of the drug was observed. The typical equation of the calibration curve between peak area ratio (A) and OA concentration (C) was as follows: A =11.13C −16.804 (R2=0.9996).
The accuracy and precision of analysis method were assessed with QC standard solutions at low, medium, and high concentrations. The results shown in Table 1 demonstrate that the analysis method established in this study showed intra- and inter-day relative standard deviation (RSD) <10% for these samples. Therefore, the analysis method was accurate and precise for determination of OA samples.
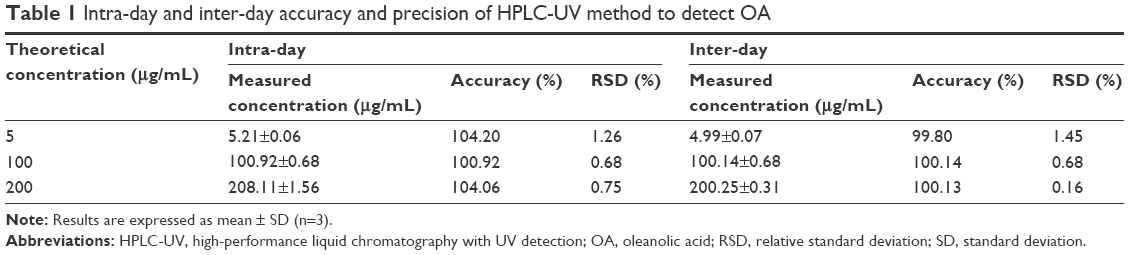 | Table 1 Intra-day and inter-day accuracy and precision of HPLC-UV method to detect OA |
The extraction recovery from OA samples was calculated by comparing it to QC samples (n=3) at low, medium, and high concentrations. The extraction recoveries of OA were 100.74% (RSD =0.77%), 100.40% (RSD =0.79%), and 100.02% (RSD =0.87%), respectively.
Through the preformed HPLC method, the encapsulation efficiency of OA-MVLs prepared according to the optimized formulation was found to be 82.3%±0.61%.
Stability analysis
The physical stability study indicated that OA-MVLs were stable with an average drug-leakage rate of 2% during the storage within 30 days. However, the average drug-leakage rate was increased to 20% at the day 60 of storage, and obvious precipitates were formed at the end of 90-day storage with an average drug-leakage rate of 50%. There were no significant morphological changes of OA-MVLs between 0 and 12 hours; when OA-MVLs were stored at 4°C, the same morphology was maintained, as shown in Figure 2. Therefore, OA-MVLs should be prepared with freeze-drying technology for long-term storage.
In serum stability test, there was no bursting release, and the accumulative percentage of leakage from OA-MVLs at different time points was 0, 2.25%±0.23%, 4.03%±0.42%, 6.69%±0.33%, 7.89%±0.29%, 8.05%±0.94%, 8.72%±0.69%, and 9.01%±0.48%. The results suggested that OA-MVLs were stable in bovine calf serum.
In vitro release and in vivo plasma pharmacokinetic study
The result from in vitro release study showed that the drug release rates were 80.56%±1.27% for MVLs and ~80% for free OA solution within 12 hours (Figure 3A).
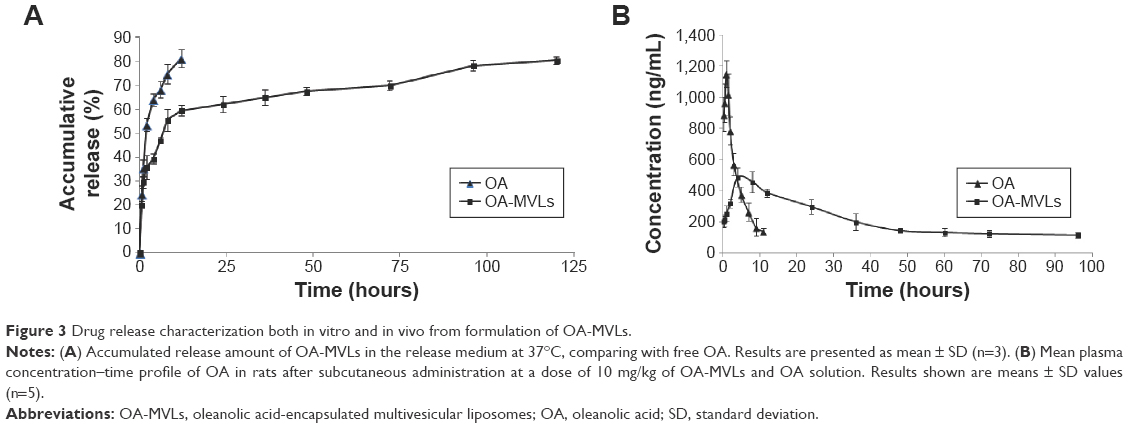 | Figure 3 Drug release characterization both in vitro and in vivo from formulation of OA-MVLs. |
In order to further understand the in vitro drug release mechanism of OA-MVLs, the data were analyzed using the zero-order equation, the first-level equation, Higuchi equation, Ritger–Peppas equation, and Korsmeyer–Peppas equation models. The fitting results are shown in Table 2. These results revealed that the in vitro release profile of OA-MVLs in PBS (pH 7.4) followed the Ritger–Peppas equation (R2=0.9526), and according to Ritger–Peppas model theory, drug release mechanism abided by Fick Diffusion.
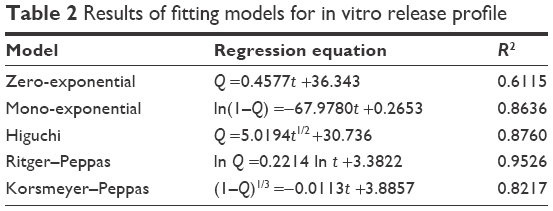 | Table 2 Results of fitting models for in vitro release profile |
In vivo pharmacokinetic studies of OA-MVLs and OA solution were performed in rats by a single sc injection at the dose of 10 mg/kg. The data in Figure 3B showed the profile of OA blood concentration versus time for OA-MVLs and OA solution. The main pharmacokinetic parameters calculated by Phoenix WinNonlin 6.3 are listed in Table 3. After administration of OA solution, plasma concentration reached the maximal value at 1 hour, indicating the rapid absorption of the free drug in the rats. Then, the concentration decreased quickly, and the drug was not detected at 12 hours after administration. When OA-MVLs were administered, however, the maximal concentration was obtained more slowly with lower value, and the drug stayed in the blood for much longer times.
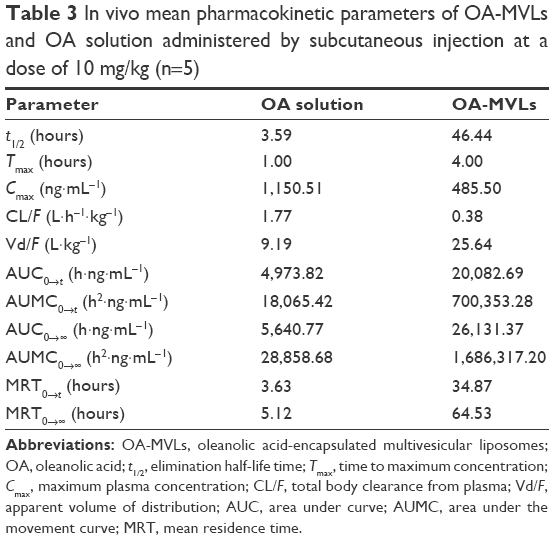 | Table 3 In vivo mean pharmacokinetic parameters of OA-MVLs and OA solution administered by subcutaneous injection at a dose of 10 mg/kg (n=5) |
As shown in Table 3, the half-life of OA-MVLs was ~12.93-fold longer than that of OA solution. The maximum plasma concentration (Cmax) of OA-MVLs was ~2.37-fold lower than that of OA solution, but the value of Tmax of MVLs was about fourfold higher than that of OA solution. In addition, the mean residence time of OA-MVLs was much longer than that of OA solution.
Cell proliferation inhibitory effect of OA-MVLs on HepG2 cells assessed by MTT analysis
To study the inhibitory effect of OA-MVLs and detect the 50% inhibitory concentrations of growth (IC50), the cell proliferation inhibitory effect of OA-MVLs on HepG2 cells was evaluated by MTT assay. The results summarized in Table 4 show that the inhibitory rates were 6.84%±1.81%, 42.69%±4.52%, and 94.07%±0.45% with the concentrations of OA-MVLs at 10, 160, and 220 μM, respectively. However, the inhibitory rates were 10.91%±1.23%, 28.92%±1.05%, and 72.12%±0.93% with the concentrations of OA solution at 10, 160, and 220 μM, respectively. The IC50 was ~169.4 and 190.71 μM for OA-MVLs and OA solution, respectively, which shows that inhibitory effect of OA-MVLs on HepG2 cells was higher than that of OA solution.
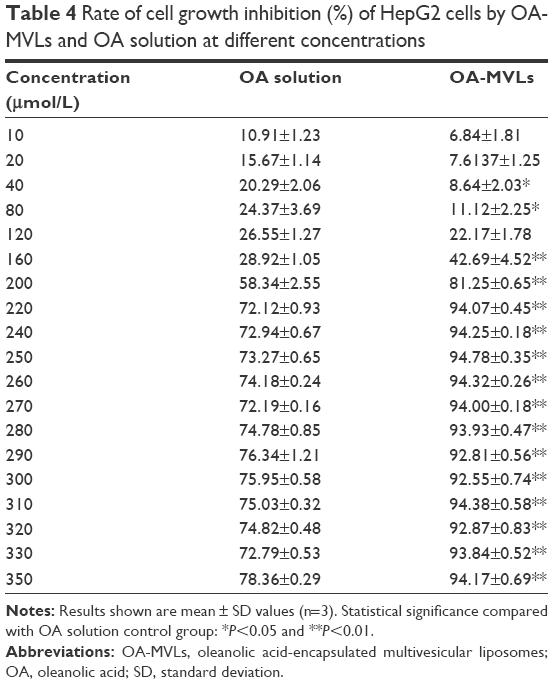 | Table 4 Rate of cell growth inhibition (%) of HepG2 cells by OA-MVLs and OA solution at different concentrations |
Cell growth inhibition of HepG2 cells assessed by fluorescence microscopy observation
To further study the role of OA-MVLs in the growth inhibition of HepG2 cells, the cells were treated with different concentrations of OA-MVLs and subjected to DAPI staining to observe the morphological changes of nuclei under the fluorescent microscope (Figure 4). Figure 4A shows that the nuclei of control group are intact and the fluorescence dispersed uniformly in them, and the cell mitosis is also in progress. However, those cells treated with OA-MVLs shown in Figure 4B–F are obviously different from that shown in Figure 4A; the nuclei turns round and is pyknotic, and appears apoptotic, and even the chromatin appears as dense blocks with grainy fluorescence. Moreover, the inhibitory effect of OA-MVLs on HepG2 cells was concentration dependent, and the inhibition was obviously increased with the increase in concentration from 20 to 290 μM. This was consistent with the results from MTT assay.
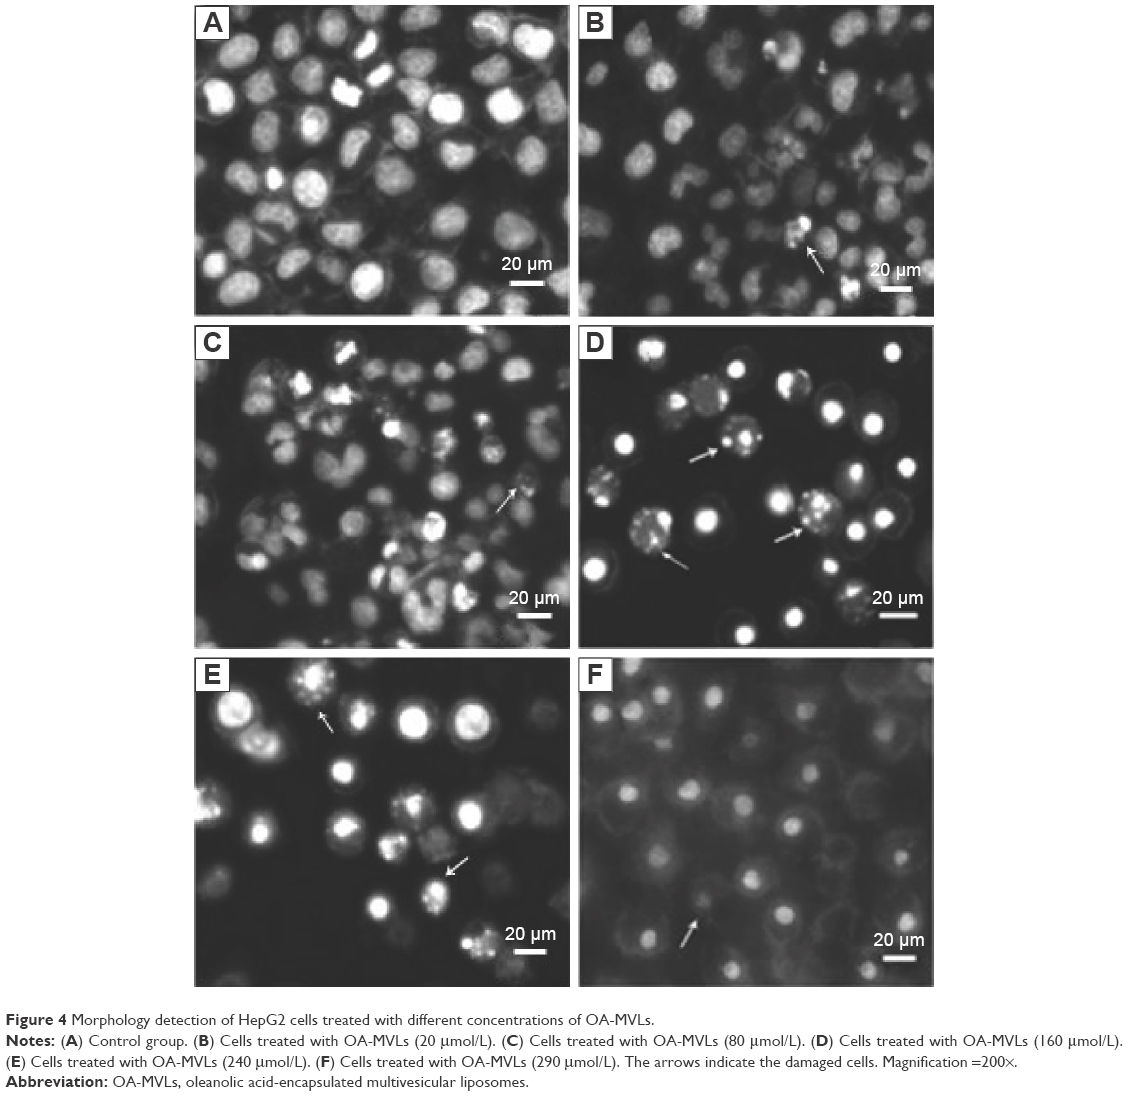 | Figure 4 Morphology detection of HepG2 cells treated with different concentrations of OA-MVLs. |
Cellular uptake assessed by confocal laser scanning microscopy analysis
In order to further elucidate the underlying mechanism of the cell proliferation inhibitory effect of OA-MVLs on HepG2 cells, the intracellular localization was investigated under confocal laser scanning microscopy. As shown both in Figure 5A and B, the fluorescence-labeled OA-MVLs mainly accumulated in the nuclei of HepG2 cells and just few of them were located in the cell membranes.
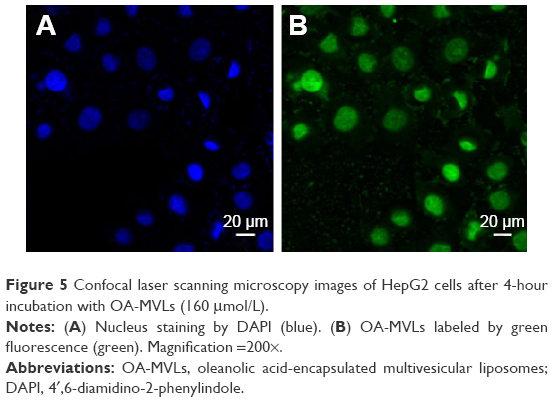 | Figure 5 Confocal laser scanning microscopy images of HepG2 cells after 4-hour incubation with OA-MVLs (160 μmol/L). |
These results suggested that OA-MVLs could enter the cells and be directed to the nuclei. The antitumor activity may be associated with the inhibition of the DNA synthesis and splitting of DNA.9
Chronic toxicity study of OA-MVLs in the Sprague Dawley rats
Survival and toxicity observations in the rats treated with OA-MVLs
Neither treatment-related mortality nor obvious toxic signs, including hair loss, scabbing, soft or mucoid feces, decreased defecation or feces smaller than normal, wet yellow material in the urogenital area, or vocalization upon handling, were observed in any of the treated rats during and at the end of experimental period.
Effect of OA-MVLS on body weight of rats
To investigate the effect of blank MVLs and OA-MVLs on the body weight changes, the rats were weighed before and post-administration for 6 weeks. There was no significant difference between treatment groups and the control group, and the body weights of all rats increased gradually. These results demonstrated that both blank MVLs and OA-MVLs did not affect the body weight of rats after treatment.
Viscera index
To demonstrate the effect of OA-MVLs on viscera index, the samples of the liver, kidney, lung, and heart were collected and weighed for calculation of the viscera index as follows: Viscera index = Viscera weight (g)/Body weight (g) ×100.
The data in Table 5 show that the liver index in the high-dose OA-MVLs group was 2.943%±0.215%, which was significantly increased compared to the control group treated with saline (P<0.05); however, the liver index in the low-dose and medium-dose OA-MVLs groups showed no significant difference compared to that of the control group (P>0.05). In addition, the lung index of rats in the high-dose OA-MVLs group was also higher than that of the control group (P<0.05). However, the heart index and kidney index in the high-dose OA-MVLs group showed no significant difference compared to those of the control group. In part B of the restorative observation experiment, the results were consistent with that of part A, and the indexes of the lung and liver were significantly higher in the high-dose OA-MVLs group (P<0.05) compared to those of the control rats, while there was no significant difference in the blank MVLs, and low- and medium-dose OA-MVLs groups compared to those of the control group (data not shown).
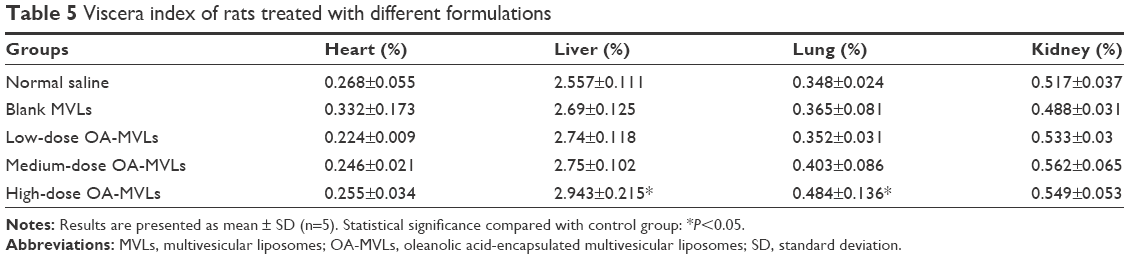 | Table 5 Viscera index of rats treated with different formulations |
The results suggested that all the designed formulations except the high-dose OA-MVLs had no effect on the treated rats compared to the control rats, and only the formulation of high-dose OA-MVLs may have had side effect on the liver and lung of treated rats.
Blood biochemical parameters and hematology analysis
In addition to viscera index study, we further carried out serum biochemistry analysis and complete blood panel analysis to assess the potential toxicity of OA-MVLS to the SD rats.30 Various serum biochemistry parameters, including liver function markers such as alanine aminotransferase (ALT; Figure 6A) and aspartate aminotransferase (AST; Figure 6B) and the kidney function indicators such as blood urea nitrogen (Figure 6C) and creatinine (Figure 6D), were respectively detected. The results showed no obvious kidney dysfunction in blank MVLs and OA-MVLs groups. As shown in Figure 6A, the high-dose OA-MVLs group had significantly decreased serum ALT compared to that of the control group (P<0.05) at week 4. AST activity (Figure 6B) in the high-dose OA-MVLs groups was substantially lower than the control group (P<0.05) at week 4. However, no significant differences were observed with the other parameters between the OA-MVLs-treated groups and the control group at weeks 1, 2, and 3.
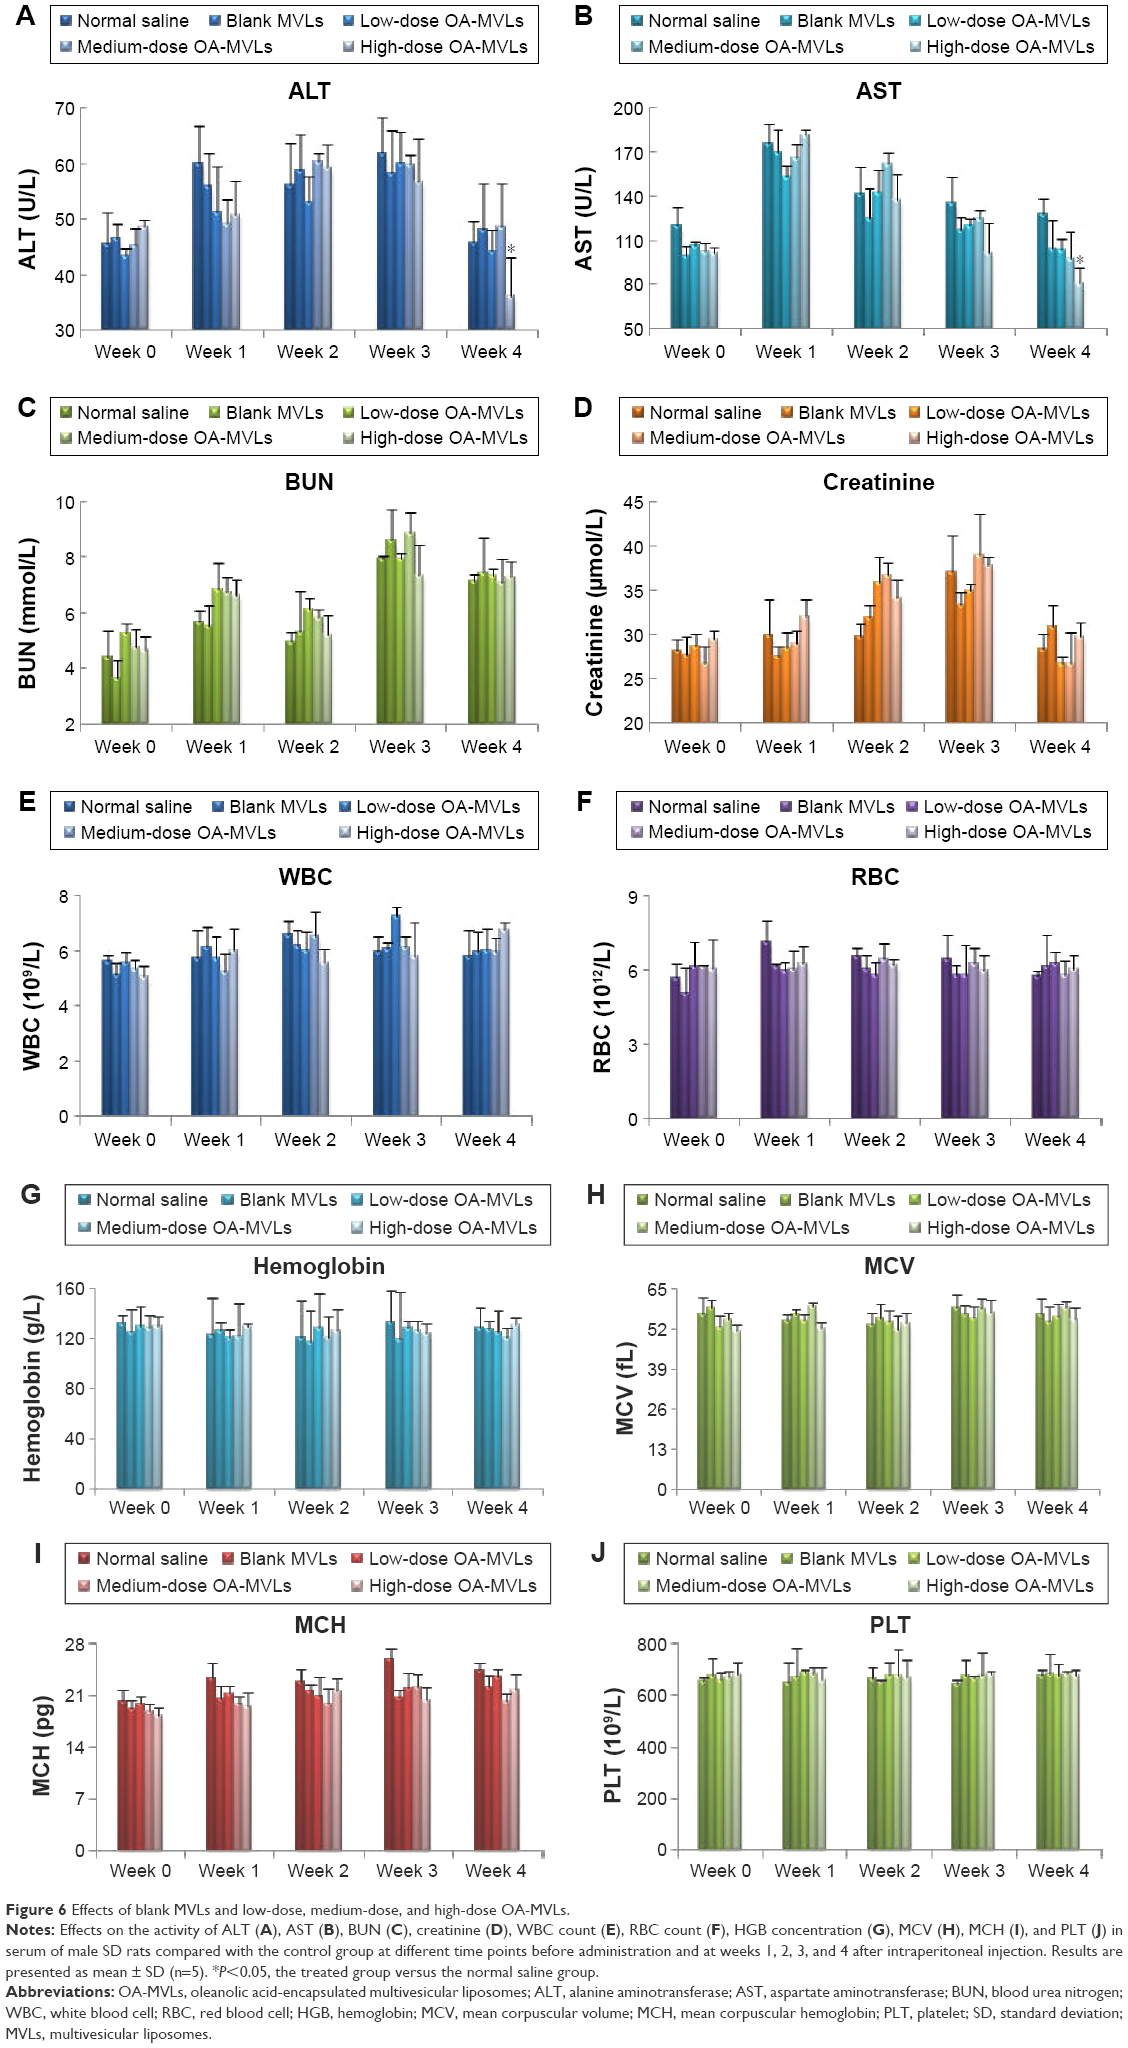 | Figure 6 Effects of blank MVLs and low-dose, medium-dose, and high-dose OA-MVLs. |
In order to further learn whether OA-MVLs may have caused delayed toxicity to the treated rats or not, we examined the indexes after the last treatment. The data in Table 6 show that the ALT and AST activities were substantially decreased in the high-dose OA-MVLs group compared to those of the control group (P<0.05). There were no significant differences in other parameters among the OA-MVLs-treated groups and the control group. The data indicated that OA-MVLs caused no delayed toxicity to the tested rats except liver toxicity in the high-dose OA-MVLs group.
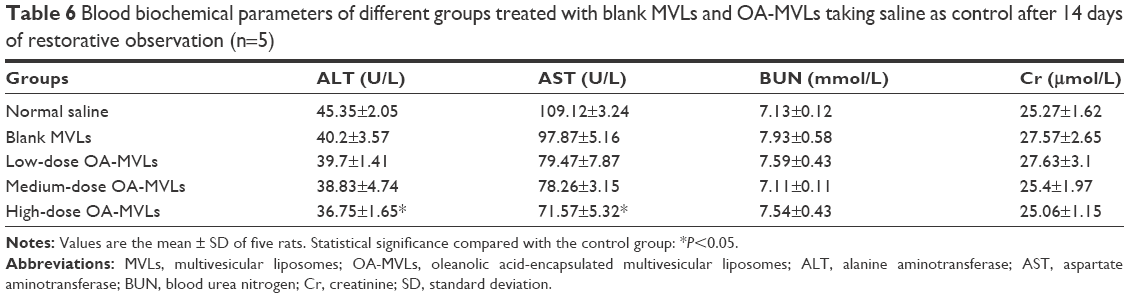 | Table 6 Blood biochemical parameters of different groups treated with blank MVLs and OA-MVLs taking saline as control after 14 days of restorative observation (n=5) |
For the hematological assessment, the following important hematological markers were evaluated such as white blood cells, red blood cells, hemoglobin, mean corpuscular volume, mean corpuscular hemoglobin, and platelet count (Figure 6E–J) on day 30 after treatment. All of the above parameters were normal in the treatment groups and showed no difference compared to those of the control groups. In addition, the parameters in the restorative observation groups were also normal on day 30 after treatment (data not shown). Therefore, the results indicated that OA-MVL nanoparticles caused no noticeable hematological toxicity within 30 days of treatment at the tested doses.
Histopathological analysis
For histopathological study, five mice were used for each group, and for each rat, at least ten sections (5 μm) were blindly analyzed by a pathologist who was blinded to the experimental protocol. The data in Figure 7 show the histological findings of the heart, liver, lung, and kidney collected within 48 hours after the last treatment (Figure 7A) and on day 14 after the last treatment for restorative observation (Figure 7B).
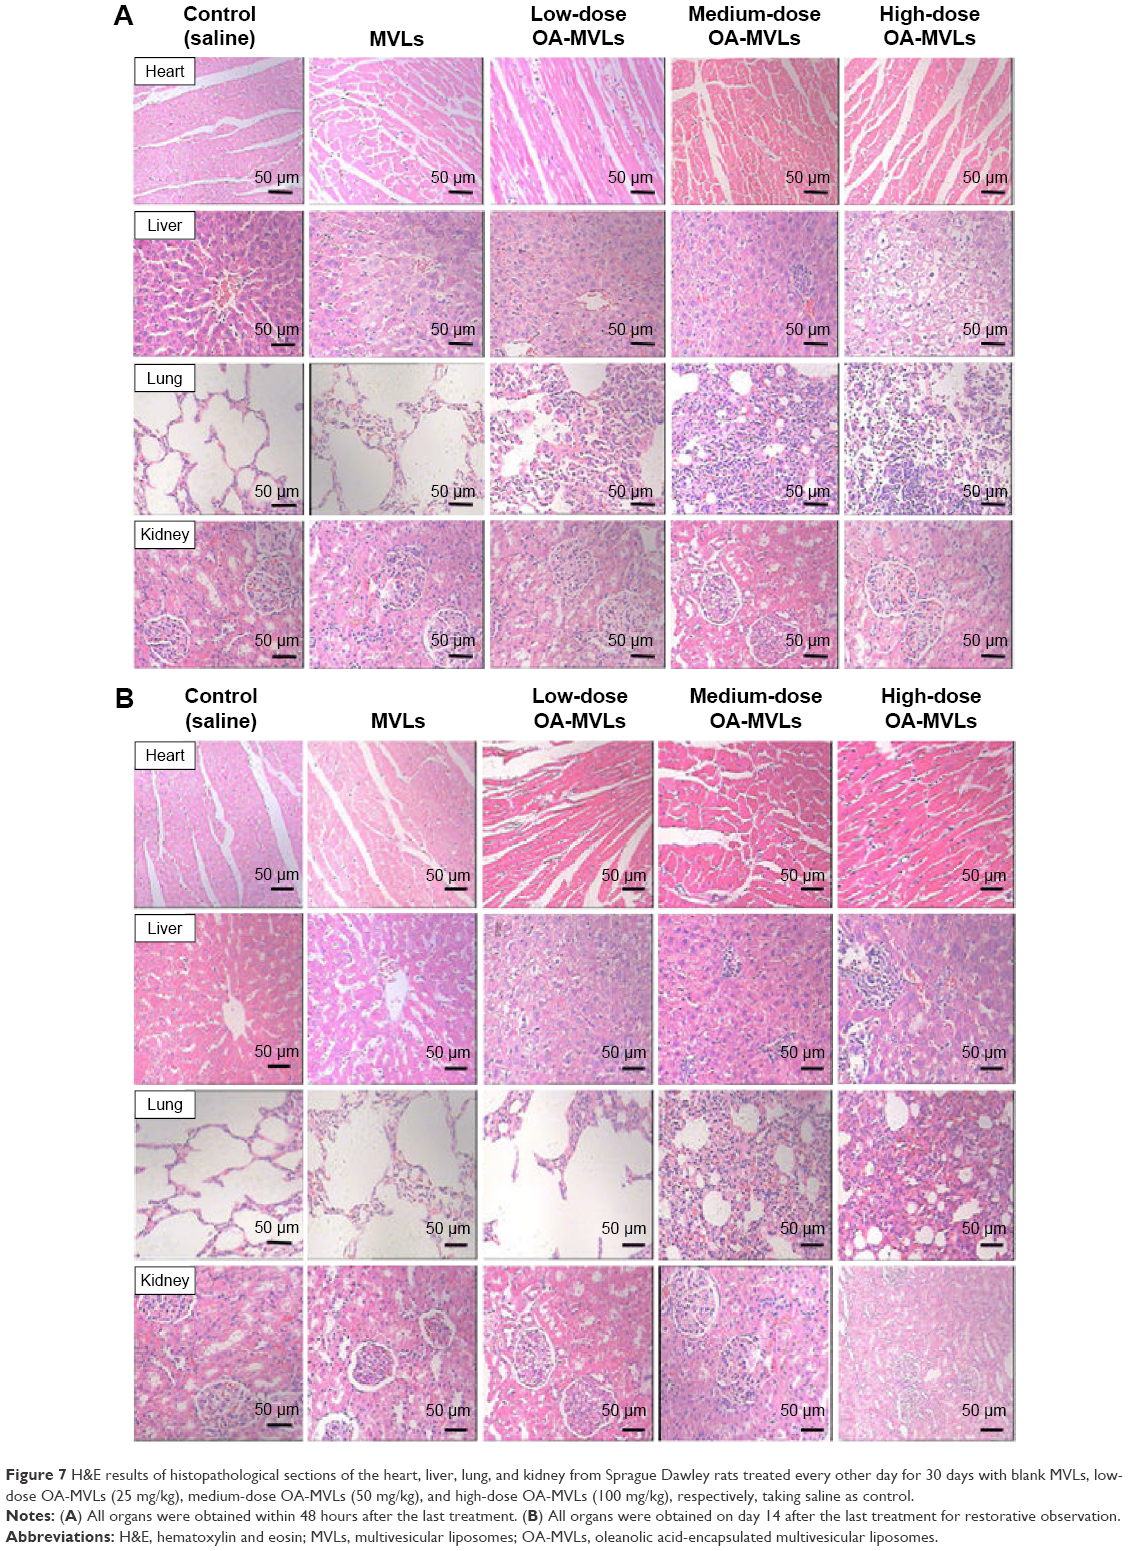 | Figure 7 H&E results of histopathological sections of the heart, liver, lung, and kidney from Sprague Dawley rats treated every other day for 30 days with blank MVLs, low-dose OA-MVLs (25 mg/kg), medium-dose OA-MVLs (50 mg/kg), and high-dose OA-MVLs (100 mg/kg), respectively, taking saline as control. |
The result in both part A and part B indicated that the heart from control group showed normal architecture with a clear boundary and red-dyed myocardial cell cytoplasm which was arranged closely. Meanwhile, no histological changes were observed in the heart tissue from the rats treated with blank MVLs, low-dose OA-MVLs (25 mg/kg), medium-dose OA-MVLs (50 mg/kg), and high-dose OA-MVLs (100 mg/kg).
The histopathological result from the controlled liver sections (Figure 7A and B) showed the normal appearance of liver with central vein, sinusoids, and hepatocytes in a clearly conserved form. Generally, in both part A and part B, the mice from low-dose OA-MVLs (25 mg/kg) group showed mild edema of hepatocyte but had little effect on liver morphology. At medium dose of 50 mg/kg of OA-MVLs, foci of cellular swelling of liver with few inflammatory cells infiltration were seen, but liver morphology was mainly normal. At the highest dose of 100 mg/kg, widespread hepatocellular empty cytoplasm presented a balloon sample change, and severe hepatocellular edema was evident (Figure 7A). However, all the changes were eventually recovered, and hepatocellular edema relieved with a small amount of inflammatory cells in the medium- and high-dose groups compared to the normal appearance after the 14-day restorative observation (Figure 7B).
During the histopathological analysis of the lung sections stained with H&E, the control group exhibited a normal structure of pulmonary alveoli and arterioles, whereas tiny histopathological changes were observed in the groups of low and medium doses of formulations. At the highest dose of 100 mg/kg, wide alveolar septa and capillary expansion, with a mass of inflammatory cells infiltration, were evident (Figure 7A). But all the histological changes almost recovered to the normal status except in the high-dose OA-MVLs groups (Figure 7B) with a small amount of inflammatory cells.
The results from the kidney section indicated that all the groups showed normal glomerulus and renal tubule structure without histological changes (Figure 7A and B). No histological changes were observed in the kidney tissue from the rats in both part A and part B, which was consistent with the previous detection of blood biochemical parameters of the kidney function.
These results indicated that blank MVLs and OA-MVLs showed no obvious hepatic toxicity or kidney dysfunction with 30-day treatment at low and medium dose. However, high-dose OA-MVLs produced slightly hepatic toxicity. Therefore, the formulation of medium-dose OA-MVLs may be a better choice in our further study in light of toxicity, but it also needs to be confirmed by the results from the antitumor activity study.
Antitumor efficacy of OA-MVLs against H22 murine hepatoma
After we have demonstrated the inhibitory effect of OA-MVLs on the proliferation of human HepG2 hepatoma cells in vitro, we further determined the antitumor efficacy of OA-MVLs at low, medium, and high doses and OA solution at 0.5 mL volume by ip injection in murine H22 hepatoma-bearing mice in vivo, compared to the control mice which were treated with same volume of saline.
The H22 tumor-bearing mice were sacrificed by administering CO2 on day 17 posttreatment, and the results are shown in Figure 8. The tumor images are shown in Figure 8A; there was obvious difference among different groups. The average tumor weights are shown in Figure 8B; they were 2.51±0.32, 1.98±0.21, 1.58±0.35, 1.22±0.37, and 0.70±0.36 g for the mice treated with saline (a), OA solution (b), low-dose OA-MVLs (25 mg/kg, c), medium-dose OA-MVLs (50 mg/kg, d), and high-dose OA-MVLs (100 mg/kg, e), respectively. The average tumor inhibitory rates were 21.12%, 37.05%, 51.36%, and 71.95% for b, c, d, and e compared to the control group treated with saline, respectively. There was a significant difference between a and b (P<0.05), a and c (P<0.01), a and d (P<0.01), a and e (P<0.001), b and c (P<0.05), b and d (P<0.01), b and e (P<0.001), c and d (P<0.01), and d and e (P<0.01). The difference between OA group and medium-dose OA-MVLs group indicated that the tumor inhibition effect was obviously enhanced after the OA was formulated into MVLs. Furthermore, these results also demonstrated that the effect of tumor inhibition of OA-MVLs was dose-dependent with high dose showing greater antitumor activity.
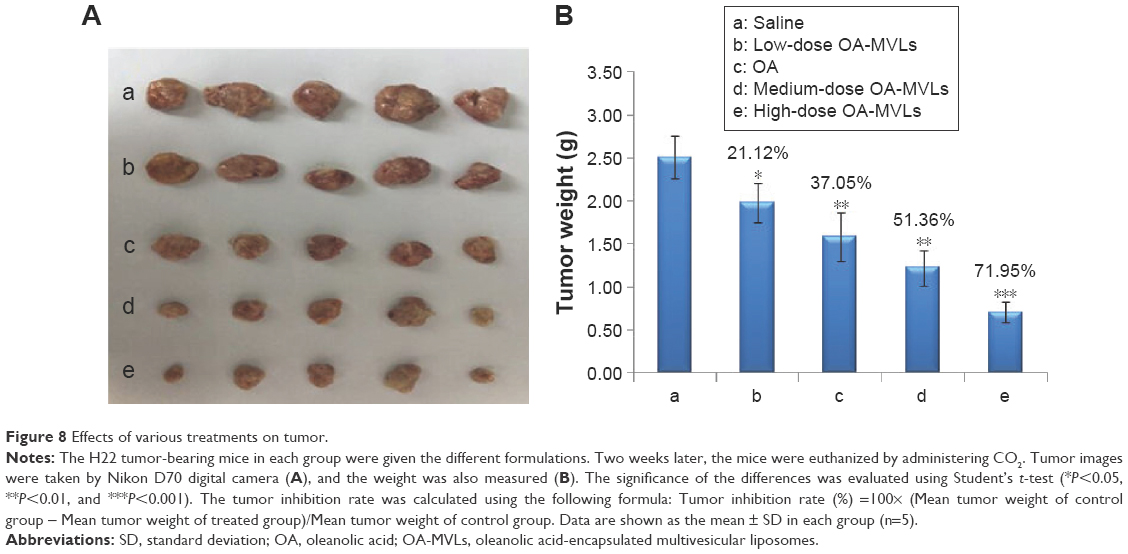 | Figure 8 Effects of various treatments on tumor. |
In order to further confirm the antitumor activity, all the tumor sizes of the mice in the part B mentioned earlier were monitored every day, and the death date was also recorded for survival rate analysis. As shown in Figure 9A, only control group mice treated with saline showed no therapeutic effect. The tumor growth inhibition was the greatest in the mice treated with high-dose OA-MVLs compared to the other groups of mice treated with saline (P<0.001 from day 13), OA solution (P<0.001 from day 21), low-dose OA-MVLs (P<0.001 from day 14), and medium-dose OA-MVLs (P<0.05 from day 17). Tumor volume was suppressed by both OA solution and medium-dose OA-MVLs, but there was a significant difference between the two groups from day 13 posttreatment (P<0.05). Meanwhile, there were huge differences between saline and OA solution (P<0.001 from day 13) and saline and low-dose OA-MVLs (P<0.05 from day 14). Furthermore, medium-dose OA-MVLs had greater tumor inhibition effect compared to low-dose OA-MVLs (P<0.001 from day 13).
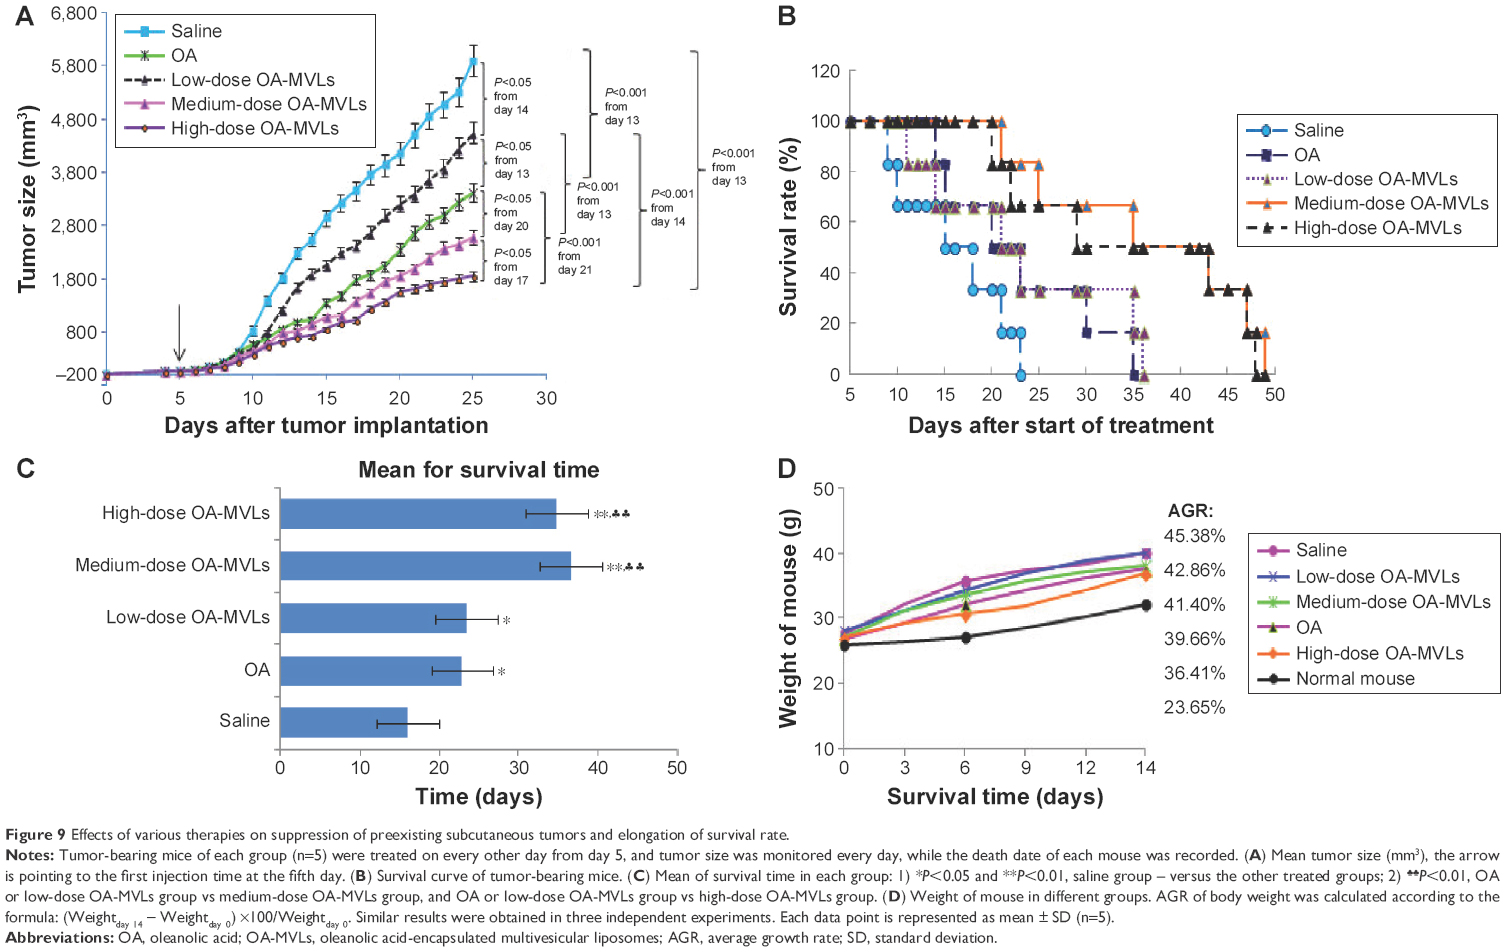 | Figure 9 Effects of various therapies on suppression of preexisting subcutaneous tumors and elongation of survival rate. |
The data in Figure 9B and C showed the survival time for all mice. And the results showed that all treatment groups including OA and low-, medium- and high-dose OA-MVLs had significantly increased survival time compared to that of saline-treated group (P<0.05 or P<0.01). However, there was no significant difference between the high-dose OA-MVLs group and the medium-dose OA-MVLs group (P>0.05), and between OA group and low-dose OA-MVLs group (P>0.05). Both medium-dose OA-MVLs and high-dose OA-MVLs had significantly increased median survival time compared to that of OA group or low-dose OA-MVLs group (P<0.01).
For the toxicity study, we measured the weight of each mouse including the normal mice without tumor at days 0, 3, 6, 9, 12, and 14. As shown in Figure 9D, compared to the normal mouse group whose average growth rate was 23.65%, all of the other mice treated with saline, OA, and low-, medium-, and high-dose OA-MVLs had significantly increased body weight with an AGR of 45.38%, 39.66%, 42.86%, 41.40%, and 36.41%, respectively. Actually, the difference should have been smaller because the normal mice did not bear any tumor. Nevertheless, it indicates that the OA-MVLs even at high dose (100 mg/kg) did not induce body weight loss.
These results indicated that formulation of OA-MVLs significantly decreased the tumor weight and prolonged the survival time of tumor-bearing mice without increased toxicity in terms of body weight change.
Pathological analysis of tumor tissues by H&E assay
The results of pathological study of tumor tissues by H&E staining (Figure 10A and B) showed that the tumor cells in the OA- and OA-MVLs-treated mice had typical necrosis, that is, nuclear fragmentation, contraction, and dissolution. The rate of necrosis in cell populations was 15% for saline (control), 60% for OA, 50% for low-dose OA-MVLs, 80% for medium-dose OA-MVLs, and 95% for high-dose OA-MVLs.
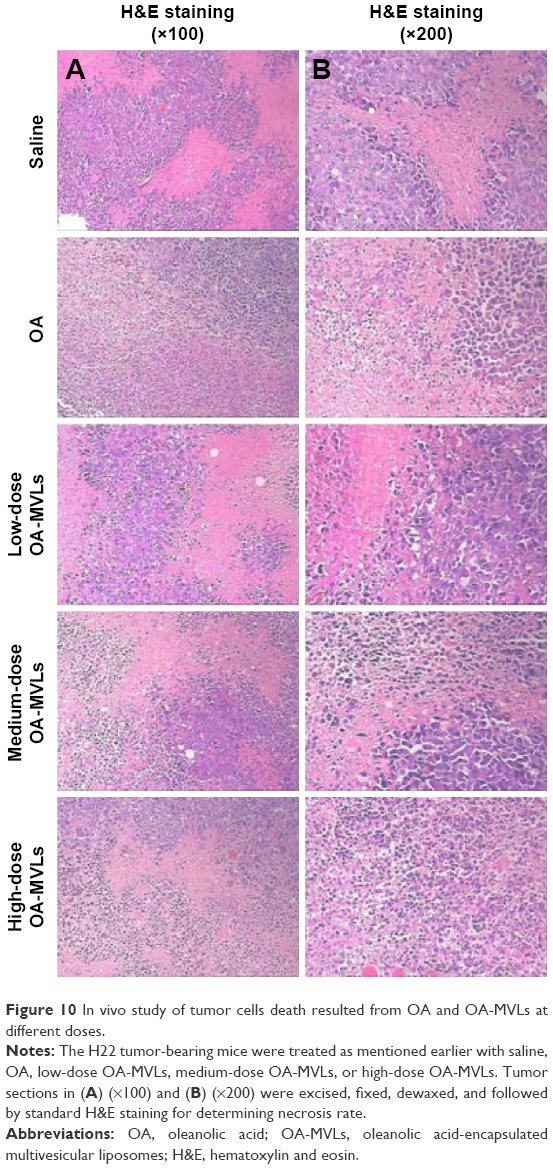 | Figure 10 In vivo study of tumor cells death resulted from OA and OA-MVLs at different doses. |
The results were consistent with the data of tumor growth inhibitory effect in the different groups, suggesting that OA-MVLs could induce H22 tumor cell necrosis leading to the tumor growth inhibition.
Discussion
In the present study, we have developed a novel drug delivery system made of OA-MVLs for enhancing its antitumor effect and studied its characteristics and safety in vitro and in vivo. As we know, there are many variable factors that affect the formation of OA-MVLs. Meanwhile, characteristics of solution, lipid composition, process parameters, and other factors also have an impact on drug release from OA-MVLs. Therefore, we determined the optimal preparation by means of prediction experiments and central composite design. The optimized formulation of OA-MVLs was spherical, and the particle size was in accordance with a normal distribution. In addition, these MVLs could act as a high-loading drug depot with an encapsulation efficiency of 82.3%±0.61%. The in vitro study showed that OA-MVLs were taken up by HepG2 cells at a greater degree than that of OA solution and enhanced the cell growth inhibition of HepG2 cells. The in vivo study with H22 tumor-bearing mice showed that OA-MVLs displayed better antitumor efficacy than that of OA solution.
This drug delivery system took the advantages of MVLs by having a good slow-release effect. The in vitro release assay showed the sustained release of OA from OA-MVLs, and the drug release rate from OA-MVLs was much slower compared to the free OA solution. This is consistent with a previous study which showed that the MVL particles presented a special structure which looked like a honeycomb and its nonconcentric multiple vesicles were bounded by a single bilayer lipid membrane which could serve as the reservoir for large quantities of bioactive agents and release their drugs in a sustained manner.20 In vivo pharmacokinetic studies indicated that after sc administration of OA-MVLs and OA solution at the same dose, OA from OA solution was quickly removed from the circulation, while OA-MVLs had a slower blood clearance. The average elimination half-life of OA-MVLs (46.44 hours) was significantly longer than that of OA solution (3.59 hours). Meanwhile, the pharmacokinetic parameters indicated that AUC0→t of OA-MVLs was much larger than that of OA solution, which suggested that the bioavailability of OA would be significantly enhanced by MVLs system. The results suggested that OA-MVLs significantly prolonged circulation time of OA in vivo through packaging OA into lipid bilayer and delaying the drug release.
To assess the stability of OA-MVLs, the newly prepared samples were placed at 4°C for 30, 60, and 90 days, and the drug-leakage rate was detected by HPLC. The results indicated that OA-MVLs were stable with an average drug-leakage rate of 2% within 30-day storage. However, the average drug-leakage rate increased to 20% at the end of 60-day storage, and obvious precipitates were formed at the end of 90-day storage with an average drug-leakage rate of 50%. Therefore, for long-term storage, OA-MVLs should be prepared with freeze-drying technology. The cytotoxicity studies revealed that OA-MVLs showed obvious inhibitory effect on the HepG2 cells and could cause apoptosis in HepG2 cells. OA-MVLs were able to enter the nucleus, and the antitumor activity may be associated with the inhibition of DNA synthesis and splitting of DNA.9 Furthermore, with the increase of OA-MVLs concentration, the inhibitory effect on the proliferation of HepG2 cells became more obvious (Table 4). At the same time, we also studied the cellular uptake of OA-MVLs to measure the OA concentrations inside and outside of the HepG2 cells by HPLC. The results showed that with the increase in OA concentration, OA concentrations also increased inside the cells, while the extracellular OA concentrations decreased gradually. On the other hand, with the increase in OA-MVLs concentrations, OA concentrations also increased gradually both inside and outside the cells. These findings strongly suggested that OA-MVLs were uptaken by HepG2 cells and provided the rational for the proliferation inhibition effect against liver cancer cells. In addition, we examined the toxicity of OA-MVLs in SD rats. Neither deaths nor body weight loss of the tested rats was found after OA-MVLs treatment at different doses during experimental period. Furthermore, the results from studies of viscera indexes, blood biochemical parameters, and histopathology indicated that OA-MVLs caused no obvious hepatic toxicity or kidney dysfunction in SD rats. In addition, we found that OA-MVLs did not cause hemolysis by in vitro hemolysis assay.
To investigate the in vivo antitumor activity of OA-MVLs, which is more related to its clinical application in cancer therapy, we used OA-MVLs at low, medium, and high doses by ip administration against murine H22 HCC, and their antitumor activity was compared to the OA solution group and saline-treated group (control). The ip administration was chosen because the solution of OA-MVLs is unclear and it could not be used for intravenous injection. The dose selection was based on previous reports from the literature.16,28,29 Our results showed that OA-MVLs were more effective for inhibiting tumor growth (Figure 9A) and prolonging survival times (Figure 9B) in a dose-dependent manner, compared to the saline and OA solution. The enhanced antitumor activity of OA-MVLs may be due to the slow-release effect which was confirmed by both release profile in vitro and plasma pharmacokinetic studies in vivo. Taking together, this OA-MVLs drug delivery system offers a new strategy for using OA in cancer therapy, and it may be suitable for carrying other lipophilic chemotherapeutic drugs to enhance their anticancer activity and/or reduce drug toxicity. Further studies should be conducted to optimize this nanoparticle system and confirm the antitumor efficiency against various cancers. For example, the solubility of OA in oil, which substantially influences the nanoparticle properties, should be optimized to maximize the anticancer efficacy and to minimize the host toxicity. The instruments and aseptic preparation conditions should also be optimized to maximize the benefits of this drug delivery system.
Conclusion
We have successfully prepared a novel controlled-release drug delivery system made of OA-MVLs. OA-MVLs with high encapsulation were prepared by double-emulsion method according to the formulation optimized by central composite design and showed remarkable sustained-release effect and prolonged circulation time. OA-MVLs at low and medium doses were not toxic to the tested rats and may be suitable to be developed as anticancer agents. Furthermore, we demonstrated that OA-MVLs significantly enhanced cell growth inhibition against human HepG2 HCC cells in vitro and potentiated the antitumor efficacy and prolonged the survival rate of mice bearing HCC in vivo. Because of the simplicity of preparation, OA-MVLs may be used for treatment of other kinds of cancers. Our study demonstrated that MVLs not only could encapsulate water-soluble substances but also could carry fat-soluble drug with high efficiency. Therefore, it could provide a new strategy for the poorly soluble drugs and OA-MVLs may serve as a promising sustained-release drug delivery system in cancer therapy.
Acknowledgments
The authors are thankful for the financial support of the National Natural Science Foundation of China (81202479), the Collaborative Fund of Sichuan Province Science and Technology Agency, Luzhou Government, Luzhou Medical University (2014JC0126, 2014JC0800), the Collaborative Fund of Luzhou Government and Luzhou Medical University (2013LZLY-J54), and the Major Cultivation Item of Sichuan Province Educational Department (14CZ0018). They also thank Mr Pei Jing and Miss Shuangli Xiao for their helpful work.
Disclosure
The authors report no conflicts of interest in this work.
References
Wang X, Ye XL, Liu R, et al. Antioxidant activities of oleanolic acid in vitro: possible role of Nrf2 and MAP kinases. Chem Biol Interact. 2010;184(3):328–337. | ||
Alvarado HL, Abrego G, Garduño-Ramirez ML, Clares B, Calpena AC, García ML. Design and optimization of oleanolic/ursolic acid-loaded nanoplatforms for ocular anti-inflammatory applications. Nanomedicine. 2015;11(3):521–530. | ||
Raphael TJ, Kuttan G. Effect of naturally occurring triterpenoids glycyrrhizic acid, ursolic acid, oleanolic acid and nomilin on the immune system. Phytomedicine. 2003;10(6–7):483–489. | ||
Yim TK, Wu WK, Pak WF, Ko KM. Hepatoprotective action of an oleanolic acid-enriched extract of Ligustrum lucidum fruits is mediated through an enhancement on hepatic glutathione regeneration capacity in mice. Phytother Res. 2001;15(7):589–592. | ||
Martín R, Carvalho-Tavares J, Hernández M, Arnés M, Ruiz-Gutiérrez V, Nieto ML. Beneficial actions of oleanolic acid in an experimental model of multiple sclerosis: a potential therapeutic role. Biochem Pharmacol. 2010;79(2):198–208. | ||
Teodoro T, Zhang LL, Alexander T, Yue J, Vranic M, Volchuk A. Oleanolic acid enhances insulin secretion in pancreatic beta-cells. FEBS Lett. 2008;582(9):1375–1380. | ||
Hsu HY, Yang JJ, Lin CC. Effects of oleanolic acid and ursolic acid on inhibiting tumor growth and enhancing the recovery of hematopoietic system postirradiation in mice. Cancer Lett. 1997;111(1–2):7–13. | ||
Umehara K, Takagi R, Kuroyanagi M, Ueno A, Taki T, Chen YJ. Studies on differentiation-inducing activities of triterpenes. Chem Pharm Bull. 1992;40(2):401–405. | ||
Zhu YY, Huang HY, Wu YL. Anticancer and apoptotic activities of oleanolic acid are mediated through cell cycle arrest and disruption of mitochondrial membrane potential in HepG2 human hepatocellular carcinoma cells. Mol Med Rep. 2015;12(4):5012–5018. | ||
Torre LA, Bray F, Siegel RL, Ferlay J, Lortet-Tieulent J, Jemal A. Global cancer statistics, 2012. CA Cancer J Clin. 2012;65(2):87–108. | ||
Fattovich G, Stroffolini T, Zagni I, Donato F. Hepatocellular carcinoma in cirrhosis: incidence and risk factors. Gastroenterology. 2004;127(Suppl 1):35–50. | ||
Jäger S, Winkler K, Pfüller U, Scheffler A. Solubility studies of oleanolic acid and betulinic acid in aqueous solutions and plant extracts of Viscum album L. Planta Med. 2007;73(2):157–162. | ||
Jin IJ, Ko YI, Kim YM, Han SK. Solubilization of oleanolic acid and ursolic acid by cosolvency. Arch Pharm Res. 1997;20(3):269–274. | ||
Jeong DW, Kim YH, Kim HH, et al. Dose-linear pharmacokinetics of oleanolic acid after intravenous and oral administration in rats. Biopharm Drug Dispos. 2007;28(2):51–57. | ||
Gao DW, Tang SN, Tong Q. Oleanolic acid liposomes with polyethylene glycol modification: promising antitumor drug delivery. Int J Nanomed. 2012;7:3517–3526. | ||
Zhang KC, Lv SW, Li XY, et al. Preparation, characterization, and in vivo pharmacokinetics of nanostructured lipid carriers loaded with oleanolic acid and gentiopicrin. Int J Nanomed. 2013;8:3227–3239. | ||
Chen YJ, Liu J, Yang XL, Zhao XL, Xu HB. Oleanolic acid nanosuspensions: preparation, in-vitro characterization and enhanced hepatoprotective effect. J Pharm Pharmacol. 2005;57(2):259–264. | ||
Yang R, Huang X, Dou JF, Zhai GX, Su LQ. Self-microemulsifying drug delivery system for improved oral bioavailability of oleanolic acid: design and evaluation. Int J Nanomed. 2013;8:2917–2926. | ||
Liu LX, Wang XC. Improved dissolution of oleanolic acid with ternary solid dispersions. AAPS PharmSciTech. 2007;8(4):267–271. | ||
Ye Q, Asherman J, Stevenson M, Brownson E, Katre NV. DepoFoam technology: a vehicle for controlled delivery of protein and peptide drugs. J Control Release. 2000;64(1–3):155–166. | ||
Spector MS, Zasadzinski JA, Sankaram MB. Topology of multivesicular liposomes, a model biliquid foam. Langmuir. 1996;12(20):4704–4708. | ||
Mantripragada S. A lipid based depot (DepoFoam technology) for sustained release drug delivery. Prog Lipid Res. 2002;41(5):392–406. | ||
Langston MV, Ramprasad MP, Kararli TT, Galluppi GR, Katre NV. Modulation of the sustained delivery of myelopoietin (Leridistim) encapsulated in multivesicular liposomes (DepoFoam). J Control Release. 2003;89(1):87–99. | ||
Shen Y, Ji YX, Xu SJ, Chen DQ, Tu JS. Multivesicular liposome formulations for the sustained delivery of ropivacaine hydrochloride: preparation, characterization, and pharmacokinetics. Drug Deliv. 2011;18(5):361–366. | ||
Toliyat T, Jorjani M, Khorasanirad Z. An extended-release formulation of desferrioxamine for subcutaneous administration. Drug Deliv. 2009;16(7):416–421. | ||
Ramprasad MP, Anantharamaiah GM, Garber DW, Katre NV. Sustained-delivery of an apolipoprotein E–peptidomimetic using multivesicular liposomes lowers serum cholesterol levels. J Control Release. 2002;79(1–3):207–218. | ||
Ramires PA, Giuffrida A, Milella E. Three-dimensional reconstruction of confocal laser microscopy images to study the behaviour of osteoblastic cells grown on biomaterials. Biomaterials. 2002;23(2):397–406. | ||
Liu J, Lu YF, Zhang Y, Wu KC, Fan F, Klaassen CD. Oleanolic acid alters bile acid metabolism and produces cholestatic liver injury in mice. Toxicol Appl Pharmacol. 2013;272(3):816–824. | ||
Huang ZQ, Li HL, Sun LB, Cheng QL. Study on inhibitive effect of oleanolic acid on transplanted hepatocarcinoma in mice. Med Plant. 2011;2(3):52–54. | ||
Fan LH, Li D, Liu ML, Fan PH. Investigation on normal reference range and values of blood physiological and biochemical indexes in clean SD rat. Natl Med Front China. 2011;6(19):33–63. |
 © 2016 The Author(s). This work is published and licensed by Dove Medical Press Limited. The
full terms of this license are available at https://www.dovepress.com/terms
and incorporate the Creative Commons Attribution
- Non Commercial (unported, 3.0) License.
By accessing the work you hereby accept the Terms. Non-commercial uses of the work are permitted
without any further permission from Dove Medical Press Limited, provided the work is properly
attributed. For permission for commercial use of this work, please see paragraphs 4.2 and 5 of our Terms.
© 2016 The Author(s). This work is published and licensed by Dove Medical Press Limited. The
full terms of this license are available at https://www.dovepress.com/terms
and incorporate the Creative Commons Attribution
- Non Commercial (unported, 3.0) License.
By accessing the work you hereby accept the Terms. Non-commercial uses of the work are permitted
without any further permission from Dove Medical Press Limited, provided the work is properly
attributed. For permission for commercial use of this work, please see paragraphs 4.2 and 5 of our Terms.