Back to Journals » Neuropsychiatric Disease and Treatment » Volume 14
EEG correlates of induced anxiety in obsessive–compulsive patients: comparison of autobiographical and general anxiety scenarios
Authors Kamaradova D, Brunovsky M ![]() , Prasko J
, Prasko J ![]() , Horacek J
, Horacek J ![]() , Hajda M, Grambal A, Latalova K
, Hajda M, Grambal A, Latalova K ![]()
Received 24 March 2018
Accepted for publication 16 May 2018
Published 27 August 2018 Volume 2018:14 Pages 2165—2174
DOI https://doi.org/10.2147/NDT.S169172
Checked for plagiarism Yes
Review by Single anonymous peer review
Peer reviewer comments 3
Editor who approved publication: Dr Roger Pinder
Dana Kamaradova,1 Martin Brunovsky,2 Jan Prasko,1 Jiri Horacek,2 Miroslav Hajda,1 Ales Grambal,1 Klara Latalova1
1Department of Psychiatry, University Hospital Olomouc, Olomouc, Czech Republic; 2National Institute of Mental Health, Klecany, Czech Republic
Background: The underlying symptomatology of obsessive–compulsive disorder (OCD) can be viewed as an impairment in both cognitive and behavioral inhibition, regarding difficult inhibition of obsessions and behavioral compulsions. Converging results from neuroimaging and electroencephalographic (EEG) studies have identified changes in activities throughout the medial frontal and orbital cortex and subcortical structures supporting the cortico-striato-thalamo-cortical circuit model of OCD. This study aimed to elucidate the electrophysiological changes induced by autobiographical and general anxiety scenarios in patients with OCD.
Methods: Resting-state eyes-closed EEG data were recorded in 19 OCD patients and 15 healthy controls. Cortical EEG sources were estimated by standardized low-resolution electromagnetic tomography (sLORETA). The changes in the emotional state were induced by two different scenarios: the autobiographical script related to patient’s OCD symptoms and the script triggering general anxiety.
Results: During the resting state, we proved increased delta activity in the frontal, limbic and temporal lobe and the sub-lobar area in OCD patients. In a comparison of neural activities during general anxiety in OCD patients and the control group, we proved an increase in delta (parietal, temporal, occipital, frontal and limbic lobes, and sub-lobal area), theta (temporal, parietal and occipital lobes) and alpha-1 activities (parietal lobe). Finally, we explored the neural activity of OCD patients during exposure to the autobiographic scenario. We proved an increase in beta-3 activity (left frontal lobe).
Conclusion: Our study proved differences in neural activation in OCD patients and healthy controls during imagination of general anxiety. Exposure to the autobiographic OCD scenario leads to activation of left frontal brain areas. The results show the possibility of using specific scenarios in OCD therapy.
Keywords: anxiety, obsessive–compulsive disorder, autobiographical script, electroencephalography, cognitive-behavior therapy
Introduction
Patients suffering from obsessive–compulsive disorder (OCD) typically have intrusive thoughts (obsessions). To reduce their discomfort, they neutralize these thoughts through stereotyped behaviors or neutralizing thoughts (compulsions).1,2 Similar intrusive thoughts occasionally occur in healthy individuals as well.3 Unlike OCD patients, healthy persons do not consider them to be a threat and do not tend to neutralize them. It is typical for OCD that a particular obsessive thought is usually linked to a particular repetitive compulsion. Thus, OCD may be viewed as impaired self-regulation (a cognitive component) and behavioral abnormities.4–6
Despite the fact that the etiology of OCD has yet to be resolved, existing hypotheses on the etiopathogenesis of OCD take account of abnormal activity in cortico-striatal-thalamo-cortical (CSTC) circuits.7,8 More recent studies9 widen the CSTC concept about the role of medial and lateral orbitofrontal cortex, amygdalo-cortical circuitry and dorsal anterior cingulate cortex.
Abnormal working and imbalanced connections between fronto-striatal networks could explain OCD symptoms and neuropsychological insufficiencies such as excessive awareness of error,10,11 abnormal reward processing,12,13 cognitive and behavioral inflexibility14,15 and difficulty to inhibit prepotent responses.11,16,17
Many EEG studies in OCD have documented prevailing changes in the frontal and orbitofrontal regions.18–24 They are less consistent when evaluating particular abnormalities in individual bands. Different studies have shown both reduced and increased power in slow-frequency bands (delta, theta)18,20–22 and fast-frequency bands (alpha, beta).18–21 There may be several explanations for this inconsistency. Different methods analyzed EEG data. Some studies used fast Fourier transform (FFT)18,20 that allows quantifying the power of electric brain activity measured from every single electrode, the rest used LORETA (eg, sLORETA)19–21,24 that computes the 3D distribution of electrical neuronal activity from EEG. Studies also differ in the choice of reference electrodes: both Cz and earlobes were used. Another factor influencing results may be the use of medication. Some of the studies excluded patients using psychotropics.18,20,21,24 Also, we included both drug-free and medicated patients (benzodiazepines were excluded). Previous LORETA research of OCD patients showed that drug-free patients and those using SSRIs did not differ from each other in absolute or relative power.22
However, EEG abnormalities detected in these regions are by no means specific for OCD. Changes in slow activity in the frontal regions have been reported in patients suffering from schizophrenia,25,26 depression27,28 and social phobia.29
OCD differs from other anxiety disorders in the way of treatment (eg, need of higher doses of antidepressants)30 and involve some other neuronal structures (eg, cortico-basal ganglia loops).31 Anxiety symptom in OCD is very heterogeneous, and anxiety may not be the most prominent symptom. For example, in a patient with symmetry-related OCD, the anxiety may only be a minor symptom.32
A method of inducing emotion by written autobiographic scenarios has been used over the decades. Studies proved its affectivity in inducing both sad and happy states of mood.33,34 Nowadays this method is widely used during the cognitive–behavioral therapy (CBT) as exposure to the imagination. During this therapy, patients are asked to imagine the worrying situation and its consequences. The essence of this method is to prevent the avoidant behavior.35 Exposure therapy proved the efficacy in the treatment of OCD patients.36,37 Personalized scenarios are useful in autobiographical recall and generation of personally relevant emotional memories.38 Personalized script proved effectiveness also in stimulating patients physiological arousal.39
Previous studies examined brain activation during exposition to different types of stimuli in anxious patients. In OCD patients, there is a different brain activation to threat stimuli40 and that this reaction is disorder-specific.41,42 For example, van den Heuvel in his study41 of OCD patients showed different brain activation during exposition to color naming OCD-related words, but not panic-related words. Also we in our study focused on differences in response to OCD specific (autobiographic) and non-specific (general) threat (anxiety) stimuli in OCD patients and healthy controls. We hypothesize based on previous studies that:
- there will be differences in the frontal and orbitofrontal regions in delta and theta frequencies in OCD patients in comparison with healthy controls in resting conditions;
- the specific personal scenario will induce the brain activity in different areas than general anxiety scenario.
Methods
The present study is cross-sectional. We evaluated OCD patients treated at a psychotherapy center of the Department of Psychiatry, University Hospital Olomouc, between January and November 2014.
Protocol of the study
The study comprised 19 OCD patients and 15 healthy controls. Healthy controls were selected from the hospital staff and volunteers who were recruited through a social networking website to match the study group for age. Patients included were 18–60 years old who had suffered from OCD for at least 6 months and had been on regular stable medication for no less than 4 weeks. The exclusion criteria were an organic brain disease, a history of substance abuse, suicide risk and the use of psychiatric drugs affecting EEG signals (except antidepressants and mood stabilizers). Patients who used benzodiazepines <24 hours before entering the study were also excluded. The participants received detailed information about the character and principles of the study as well as its potential risk and benefits. All of them gave written consent to participation. The study was approved by the University Hospital Olomouc Ethics Committee and was conducted according to the most recent revision of The Declaration of Helsinki and Good Clinical Practice.43
The OCD patients were recruited from a group receiving cognitive behavioral therapy at a psychotherapy center of the Department of Psychiatry, University Hospital Olomouc. The patients treated for OCD were in a stable condition and had undergone group sessions for at least 3 weeks. OCD diagnosis was confirmed by three independent psychiatrists (outpatient psychiatrist, and junior and senior doctors). Furthermore, it was confirmed by the Mini-International Neuropsychiatric Interview (M.I.N.I.).44 Basic demographic and clinical data were obtained while interviewing the participants. Following this, participant competed for other assessment measures. The severity of OCD and affective symptomatology was assessed by both objective and subjective inventories and scales. The levels of anxiety were measured by the Beck Anxiety Inventory (BAI)45 and Hamilton Anxiety Rating Scale (HAM-A);46 the severity of depression was quantified using the Beck Depression Inventory-II (BDI-II)47,48 and Hamilton Depression Rating Scale (HAM-D).49 The severity of OCD symptomatology was rated with the Yale-Brown Obsessive Compulsive Scale (Y-BOCS).50 Senior doctors did all the assessments. Except Y-BOCS, healthy controls fulfilled all named questionnaires. Subsequently, the patient and the psychiatrist cooperated to write an autobiographical scenario potentially triggering OCD-related anxiety.
Electroencephalography
Electroencephalography was carried out at the Department of Psychiatry, University Hospital Olomouc, using the Walter Graphtek PL-Winsor 3.0 standard 21-channel EEG amplifier with 19 Ag/AgCl surface electrodes (Fp1, Fp2, F7, F3, Fz, F4, F8, T3, C3, Tz, C4, T4, T5, P3, Pz, P4, T6, O1 and O2) placed according to the 10/20 international system. Data were recorded at a sampling rate of 200 Hz; the ear electrodes linked together (A1 + A2) were used as reference electrodes; during monitoring, an impedance of <5 kO was achieved for all electrodes. The low- and high-pass filters were set at 0.15 and 70 Hz, respectively. Throughout monitoring, alertness was repeatedly checked. If signs of decreased alertness appeared in the EEG, participants were kept awake by acoustic stimulation. Before the analysis itself, all EEG segments containing eye, movement and muscle artifacts detected by visual inspection were removed. The entire frequency spectrum (1.5–30 Hz) was divided into seven frequency bands as described by Kubicki et al51: delta (1.5–6 Hz), theta (6.5–8 Hz), alpha-1 (8.5–10 Hz), alpha-2 (10.5–12 Hz), beta-1 (12.5–18 Hz), beta-2 (18.5–21 Hz) and beta-3 (21.5–30 Hz). Subsequently, computations of the distribution of current density in the 3D Talairach/MNI space were made with a standardized low-resolution brain electromagnetic tomography (sLORETA)/exact LORETA software package. LORETA computes current density at each voxel in the brain as the linear, weighted sum of the scalp electric potentials.52 The Talairach Atlas brain served for reporting locations. This atlas generally distinguishes 12 lobes (anterior lobe, frontal lobe, frontal-temporal space, limbic lobe, medulla, midbrain, occipital lobe, parietal lobe, pons, posterior lobe, sub-lobar, temporal lobe) (Talairach J, Tournoux P: Co-planar stereotaxic atlas of the human brain. Stuttgart: Thieme; 1988).
The course of EEG monitoring
The EEG was recorded for ~30 minutes between 9 and 10 am. During EEG monitoring, the participants, maximally alert and with their eyes closed, were lying in a sound-attenuated room with dimmed lighting. During the initial standard 5-minute resting-state monitoring, patients were asked to relax as much as possible. At that time, baseline resting EEG was recorded, and the participants were supposed to be maximally relaxed to reduce the number of artifacts. In the second part, the participants were exposed to individual scenarios. The first, autobiographic, scenario was compiled by a particular patient in cooperation with the psychiatrist before EEG monitoring. This specific personalized scenario contained the patient’s own OCD-related problems. The patients were usually asked to imagine being exposed to their anxiety-inducing stimuli (obsessions) but without responding to compulsive behavior. For example, “I reach into my handbag and feel something sticky there” or “I leave the house and think that I have not locked the door” etc. Only OCD patients were exposed to this scenario. The second scenario aimed at inducing general anxiety, that is, a type of anxiety potentially experienced by both OCD patients and healthy individuals in that situation. The participants could choose from two possible scenarios, depending on which content they consider as subjectively more threatening.
Scenario 1
I go jogging in the morning. As I enter the park, I suddenly see a big black shadow. A big German Mastiff is approaching me fast. I freeze. I am terribly scared. It is as big as a horse. It has an open mouth showing big fangs and a protruding tongue. As the dog is running, saliva is flying out of its mouth. It does not bark. I just see its cold, staring eyes. I am its prey. I want to run away, but I cannot move. It is leaping toward me. It looks aggressive. I have no chance. It will bite my throat. It will pull me to the ground and tear me to pieces. It will hurt terribly. I can see the blood and shreds of flesh. Oh God, what shall I do? I feel like crying in horror, but all I can do is stare, frozen.
Scenario 2
I am traveling by car sitting in the front passenger seat. It is raining so I am aware that the road may be slippery. I take a look at the speedometer, and it shows 150 kph. I am scared. I try to tell the driver to slow down. However, he says: “Don’t worry. I drive safely.” Suddenly, I can see the brake lights of a vehicle in front. The driver brakes and the car skids, dragging along the crash barrier. I see the rear lights as we are approaching the car. I am sure he will not make it. That makes my hair stand on end. I feel like crying. As in a slow-motion movie, we are getting close to the car ahead of us.
All but one participant selected Scenario 2. The third scenario aimed at producing patients’ neutral feelings (resting state).
Scenario 3
I have some time off. I have just had my lunch. My stomach feels fine. I am relaxing; there is nowhere to rush to. I am sitting in my room and reading a book. I am sitting comfortably and enjoying the book. Moreover, it is nice to concentrate on it.
When reading a scenario, the participants were asked to do their best to evoke a particular emotion. Once they felt that they were successful in experiencing that particular scenario or emotion, they gave a signal to the investigator and 5-minute EEG monitoring was initiated. Exposure to each scenario was followed by a 5-minute break, with the participants being asked to relax. The order of scenarios was randomly assigned.
Statistics
Statistical analysis
Demographic and clinical data were processed with Prism3 (Version 5.0; GraphPad Software, Inc., La Jolla, CA, USA) and STATISTICA 9. Demographic, clinical and quantitative psychopathology data were analyzed using demographic bar charts; means, medians and SDs were calculated, and types of distribution were determined. For qualitative data, frequencies were calculated. Given the normal distribution of data in all assessment scales used, trends in mean scores for individual scales were compared using paired and unpaired t-tests and repeated-measures analysis of variance. The P-value of 0.05 was set as the significance level. Group statistical analysis of individual sLORETA data and localization of changes in electrical activity was carried out with statistical nonparametric mapping (SnPM) of voxel-by-voxel unpaired t-tests (intergroup comparison at the beginning of therapy) and paired t-tests (intragroup comparison before and after therapy) for sLORETA images based on the comparison of log-transformed performance spectra. The results were subjected to corrections for multiple comparisons using a nonparametric single-threshold test applied by the theory of randomization and permutation.53 A statistically significant effect was present if at least one t-value (voxel, Tmax) exceeded the critical values (tcrit) for P=0.05 (significant effect) and P=0.10 (significant trend), with tcrit being set after performing 5,000 randomizations. Voxels with the most significant differences in current density in individual frequency bands were characterized by x, y and z Talairach coordinates.54
Results
Sample
Nineteen OCD patients (15 males) and 15 healthy controls (9 males) (Fisher’s exact test; ns) were enrolled in the study. There was no statistically significant difference between OCD patients and healthy controls in mean age (31.00±8.07 vs 33.33±6.47) (unpaired t-test; t=0.91; df=32; ns) and education level (1 – primary, 10 – secondary, 8 – tertiary education level vs 1 – primary, 6 – secondary and 8 – tertiary education level) (chi-squared test; df=0.54, 2; ns). Mean onset of OCD was 17.68±9.40 years and mean duration of the disorder was 12.47±7.11 years. There were statistically significant differences between OCD patients and healthy controls in HAM-A (9.26±5.94 vs 1.73±1.10) (unpaired t-test; t=4.83; df=32; P<0.0001), HAM-D (8.68±4.77 vs 0.60±0.91) (unpaired t-test; t=6.45; df=32; P<0.0001), BAI (21.21±14.13 vs 2.87±1.64) (unpaired t-test; t=4.99; df=32; P<0.0001) and BDI-II (19.31±13.38 vs 2.60±2.38) (unpaired t-test; t=5.05; df=32; P<0.0001). The mean score in Y-BOCS was 25.68±6.35. Five patients were drug free and fourteen patients were treated with antidepressants. Seven patients received low doses of antipsychotics.
Resting state EEG – comparing patients and healthy controls
Compared with healthy controls, OCD patients showed increased delta activity in the frontal, limbic and temporal lobe, and sub-lobar area (Figure 1) (Table 1). The highest t-values were observed in the medial frontal gyrus (Brodmann area 9).
 | Figure 1 Voxel-wise statistical non-parametric map (SnPM) of resting state sLORETA images in all patients (n=19) compared to healthy controls (n=15) at the 0.05 significance level after the correction for multiple comparisons. Yellow/red shades indicate increased delta sources (red for P<0.1; yellow for P<0.05). Structural anatomy is shown in gray scale (A – anterior; P – posterior; L – left; R – right). |
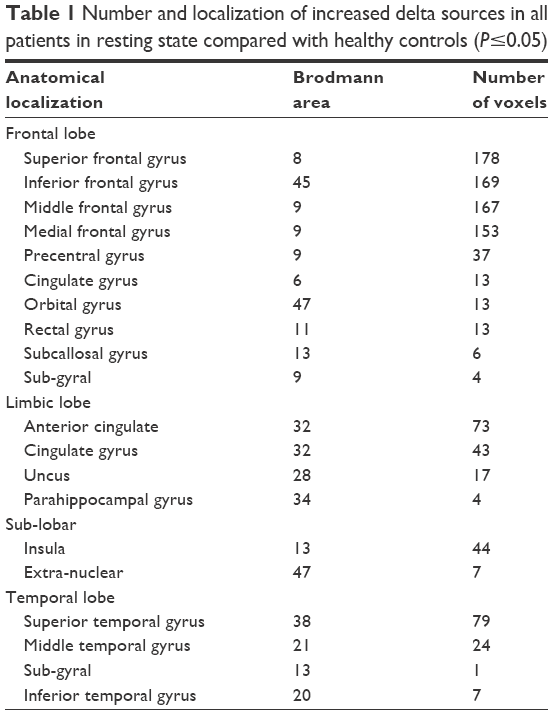 | Table 1 Number and localization of increased delta sources in all patients in resting state compared with healthy controls (P≤0.05) |
General anxiety scenario EEG – comparing patients and healthy controls
In the next part of our research, we focused on differences in neural activity during general anxiety in OCD patients and control group. We compared the differences in activities during exposure to general anxiety scenario minus resting state in OCD patients and healthy controls. There was a significant increase of delta, theta and alpha-1 sources.
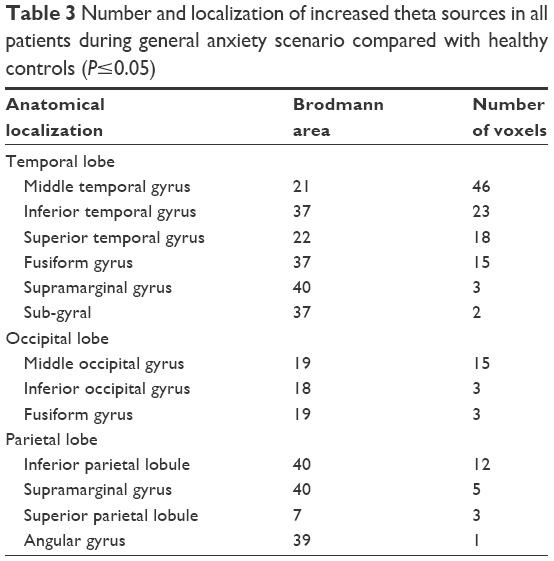
The increase in delta activity was observed in the parietal, temporal, occipital, frontal and limbic lobes, and the sub-lobar area, with highest t-values in the parietal lobe, Brodmann area 7 (Figure 2) (Table 2).
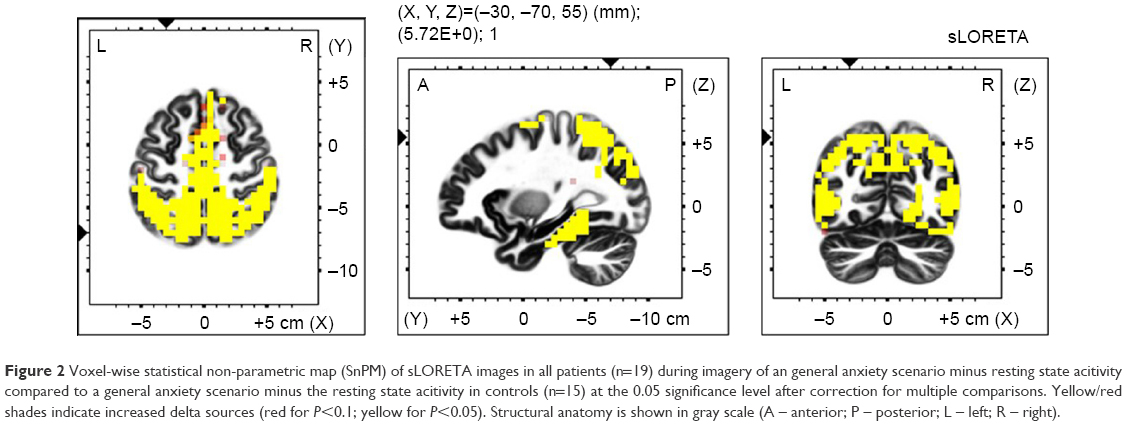 | Figure 2 Voxel-wise statistical non-parametric map (SnPM) of sLORETA images in all patients (n=19) during imagery of an general anxiety scenario minus resting state acitivity compared to a general anxiety scenario minus the resting state acitivity in controls (n=15) at the 0.05 significance level after correction for multiple comparisons. Yellow/red shades indicate increased delta sources (red for P<0.1; yellow for P<0.05). Structural anatomy is shown in gray scale (A – anterior; P – posterior; L – left; R – right). |
 | Table 2 Number and localization of increased delta sources in all patients during general anxiety scenario compared with healthy controls (P≤0.05) |
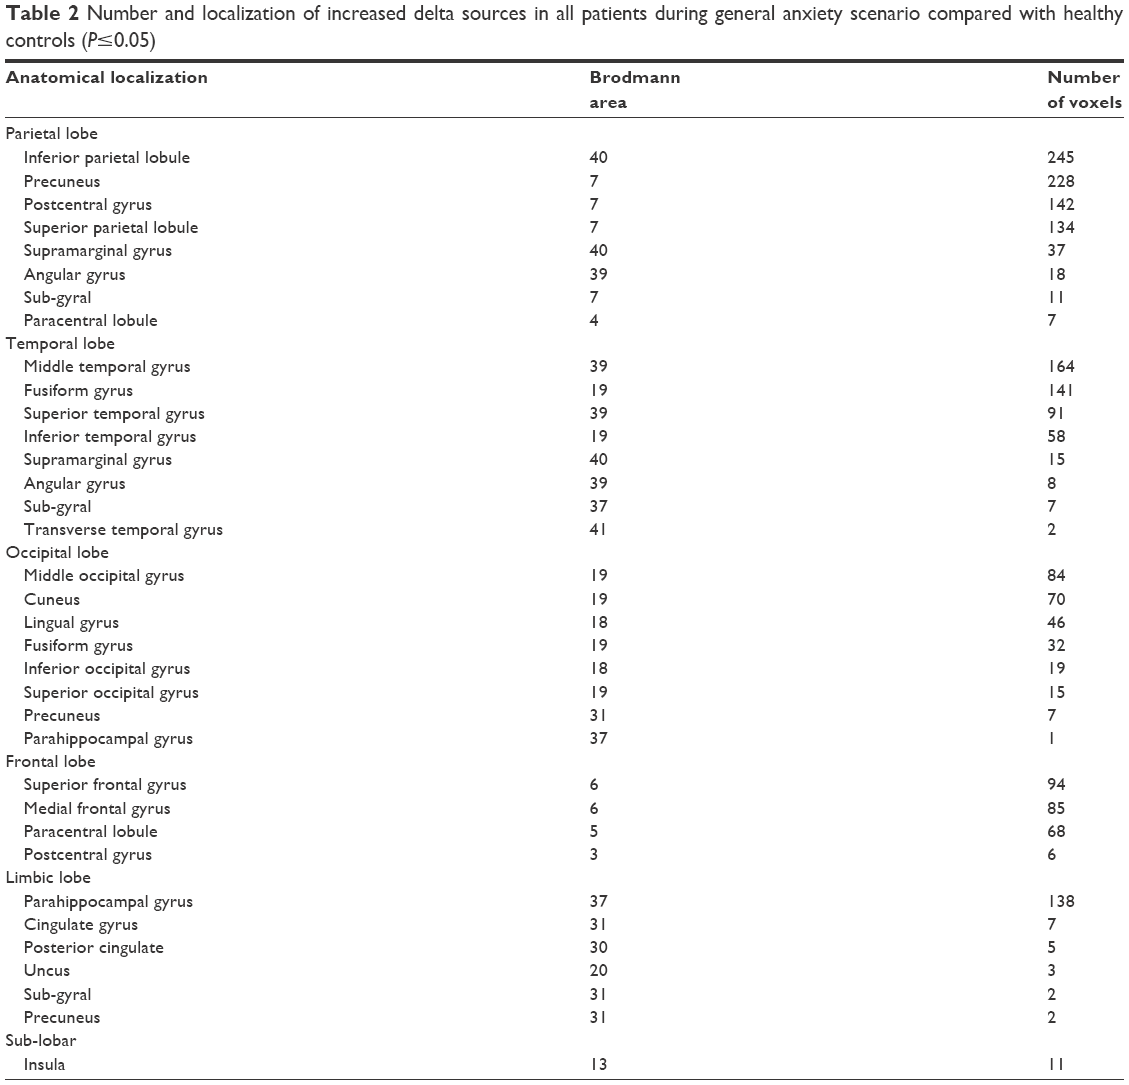
We also proved the increase of theta activity in temporal, parietal and occipital lobes, with maximum t-values in the temporal lobe, Brodmann area 21 (Figure 3) (Table 3). These variances were found only in the right hemisphere.
 | Figure 3 Voxel-wise statistical non-parametric map (SnPM) of sLORETA images in all patients (n=19) during imagery of an general anxiety scenario minus resting state acitivity compared to a general anxiety scenario minus the resting state acitivity in controls (n=15) at the 0.05 significance level after correction for multiple comparisons. Yellow/red shades indicate increased theta sources (red for P<0.1; yellow for P<0.05). Structural anatomy is shown in gray scale (A – anterior; P – posterior; L – left; R – right). |
 | Table 3 Number and localization of increased theta sources in all patients during general anxiety scenario compared with healthy controls (P≤0.05) |
There was also an increase in alpha-1 activity in the parietal lobe, with maximal t-values in Brodmann area 40 (Figure 4) (Table 4).
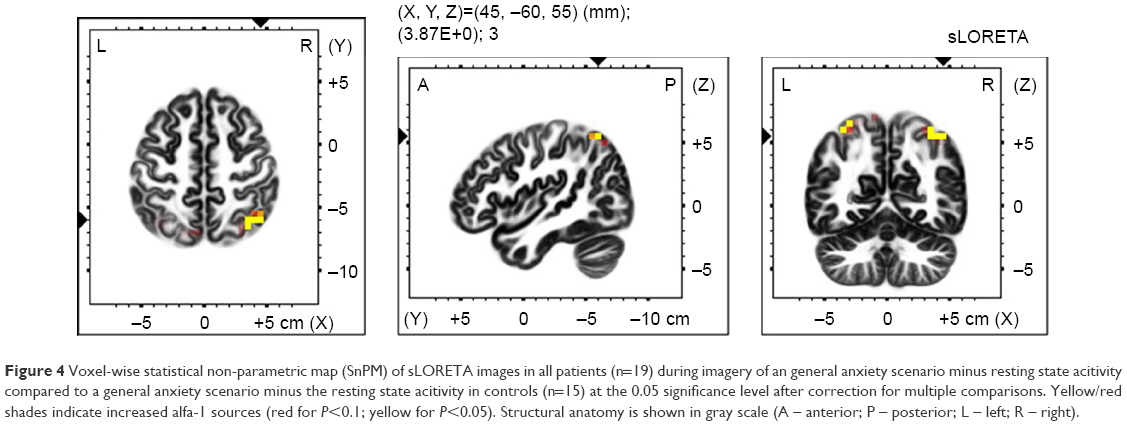 | Figure 4 Voxel-wise statistical non-parametric map (SnPM) of sLORETA images in all patients (n=19) during imagery of an general anxiety scenario minus resting state acitivity compared to a general anxiety scenario minus the resting state acitivity in controls (n=15) at the 0.05 significance level after correction for multiple comparisons. Yellow/red shades indicate increased alfa-1 sources (red for P<0.1; yellow for P<0.05). Structural anatomy is shown in gray scale (A – anterior; P – posterior; L – left; R – right). |
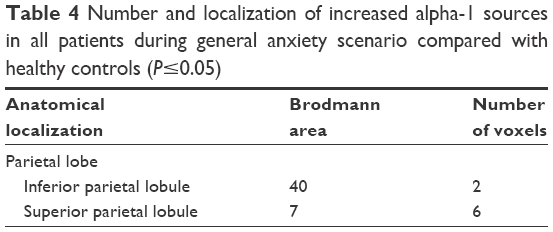 | Table 4 Number and localization of increased alpha-1 sources in all patients during general anxiety scenario compared with healthy controls (P≤0.05) |
OCD script vs resting state (A OCD script) vs (B OCD rest)
In the third part of our study, we examine the neural activity during exposure to an autobiographic scenario in patients. Comparing to resting state, there was an increase of beta-3 sources in the left frontal lobe, with maximal t-values in Brodmann area 10 (Figure 5) (Table 5).
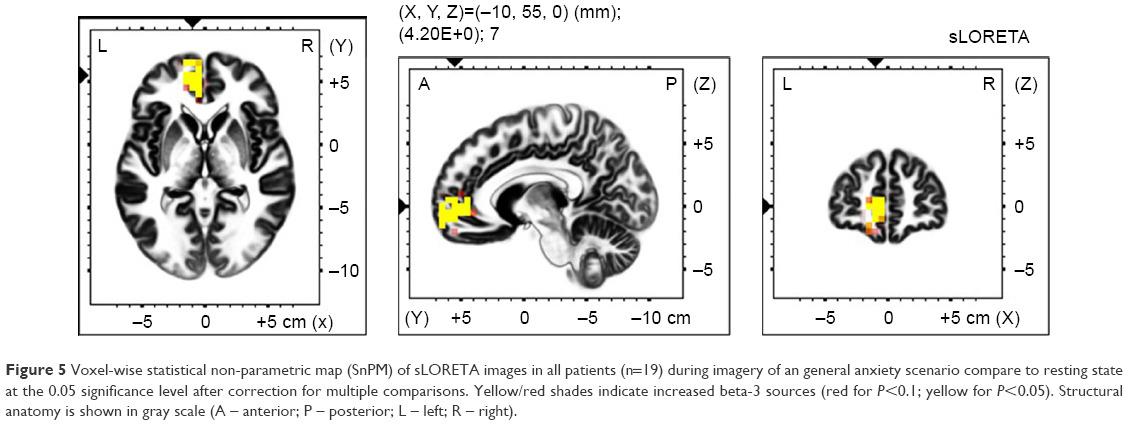 | Figure 5 Voxel-wise statistical non-parametric map (SnPM) of sLORETA images in all patients (n=19) during imagery of an general anxiety scenario compare to resting state at the 0.05 significance level after correction for multiple comparisons. Yellow/red shades indicate increased beta-3 sources (red for P<0.1; yellow for P<0.05). Structural anatomy is shown in gray scale (A – anterior; P – posterior; L – left; R – right). |
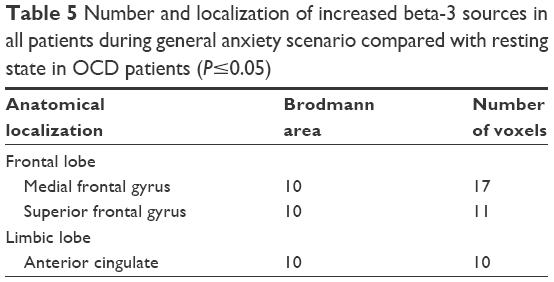 | Table 5 Number and localization of increased beta-3 sources in all patients during general anxiety scenario compared with resting state in OCD patients (P≤0.05) |
We did not find any statistically significant difference between neural activities comparing exposure to the autobiographic scenario and the general anxiety scenario in OCD patients.
Discussion
The study used sLORETA to compare electrical activity in OCD patients and that in healthy controls. Besides comparing signals in both groups during a resting state, the primary objective was to investigate the differences in activities during exposure to autobiographical and general anxiety scenarios.
BAI and HAM-A scores indicate mild anxiety severity.55,56 In the Y-BOCS questionnaire exclusively assessing OCD symptomatology, the patients’ had several disorder on average.50 The mean severity of depressive symptoms slightly increased but in the range of other studies with this population.57,58
Comparison of resting EEG in OCD patients and healthy controls showed increased delta and theta activity in the frontal regions of OCD patients. Our first hypothesis about differences in the frontal and orbitofrontal regions in delta and theta frequencies in OCD patients in comparison with healthy controls in resting conditions was confirmed. This finding is consistent with those by other authors also indicating a higher proportion of slow activities in these areas of the brain.18,20,21,23 Delta activity is generally considered to be linked to cognitive functions. This activity is mainly related to mental efforts and working memory.59 The increase in the frontal regions may be seen, for example, in other severe mental disorders such as schizophrenia25,26 or depression.27,28 A hypothesis has been formulated that it is involved in signal matching and decision making.60 Theta activity is assumed to be linked with information transfer in the hippocampus. This activity is mainly related to mental efforts and working memory.59
In the next part of the present study, both patients and healthy controls were exposed to individual scenarios. Our second hypothesis that the specific personal scenario will induce the brain activity in different areas than general anxiety scenario was also confirmed. During imagery of a general anxiety scenario, healthy controls increased their delta activity mainly in the temporal lobe, whereas OCD patients showed increased beta-3 activity in the occipital lobe (lingual gyrus) and limbic lobe. Increased delta activity is generally connected with attention to internal processing during the performance of mental tasks.61 The temporal lobe areas (in particular the medial temporal lobe) play a crucial role in memorizing. It may thus be speculated that when being assigned a task of imagining a particular scenario and inducing anxiety, healthy controls mainly activated the memory centers. In similar areas of the brain, there was an increase in theta activity linked to episodic memory.62 Conversely, the same situation and comparison showed increased beta-3 activity in the patients’ lingual gyrus and limbic lobe. Beta-3 activity is generally considered excitatory activity.63 The lingual gyrus appears to be functionally connected with the posterior cingulate cortex whose activation may be speculatively associated with threat identification.64
However, the present study found differences in brain activity during exposure to an autobiographical scenario. Unlike the general anxiety scenario, the imagery of the autobiographical scenario increased beta-3 activity in the frontal and limbic lobes. These are a part of the so-called orbitofrontal basal ganglia circuit, currently thought to play a key role in the neurobiology of OCD. According to Buzsáki,59 the circuit is hyperactive even during a resting state in OCD patients, and its activity is intensified upon stimulation, which is consistent with the present findings.
Limitations
There are several limitations of the study. These include the small sizes of both the OCD patients and healthy control groups. We acknowledge that male-to-female ratio of 4:1 is not consistent with the standard distribution of OCD in the population. The male preponderance may be explained by the fact that the present study comprised inpatients taking part in a psychotherapy program who consented to their participation in the research. Another limitation is the use of medication, even though excluded were patients using benzodiazepines, which are known to alter EEG signals. Controls had no medication, which could influence the results of the between-group comparisons. The within-group comparisons in the OCD group are less problematic in this respect. Another limit is associated with the use of sLORETA, which allows only analysis of group data and does not allow each subject analysis. There is no clinical comparison group in this, so the specificity of any effects to OCD cannot be determined by this study.
Another limitation is that the controls had only one exposure (general anxiety situation) and did not have any OCD-specific scenario (they did not have obsessions, and it was not possible to make a specific scenario).
Conclusion
It was shown that in OCD patients, other brain centers are activated by a nonspecific (general anxiety) scenario than by exposure to an autobiographical scenario. A personalized scenario activated centers generally known to be associated with OCD and also linked to the patient’s conscious activity. The study also showed differences in activation of the brain in both healthy individuals and patients. The study underlines the importance of working with specific scenarios when treating OCD patients.
Disclosure
The authors report no conflicts of interest in this work.
References
World Health Organisation (WHO). ICD-10: TheICD-10 Classification of Mental and Behavioural Disorders: Clinical Descriptions and Diagnostic Guidelines. Geneva: World Health Organisation (WHO); 1992. | ||
American Psychiatric Association. Diagnostic and statistical manual of mental disorders. 5th ed. Arlington, VA: American Psychiatric Publishing; 2013. | ||
Salkovskis PM, Harrison J. Abnormal and normal obsessions: a replication. Behav Res Ther. 1984;22(5):549–552. | ||
Bannon S, Gonsalvez CJ, Croft RJ, Boyce PM. Response inhibition deficits in obsessive-compulsive disorder. Psychiatry Res. 2002;110(2):165–174. | ||
Chamberlain SR, Blackwell AD, Fineberg NA, Robbins TW, Sahakian BJ. The neuropsychology of obsessive compulsive disorder: the importance of failures in cognitive and behavioural inhibition as candidate endophenotypic markers. Neurosci Biobehav Rev. 2005;29(3):399–419. | ||
Herrmann MJ, Jacob C, Unterecker S, Fallgatter AJ. Reduced response-inhibition in obsessive-compulsive disorder measured with topographic evoked potential mapping. Psychiatry Res. 2003;120(3):265–271. | ||
Aouizerate B, Guehl D, Cuny E, et al. Pathophysiology of obsessive-compulsive disorder: a necessary link between phenomenology, neuropsychology, imagery and physiology. Prog Neurobiol. 2004;72(3):195–221. | ||
Wood J, Ahmari SE. A framework for understanding the emerging role of corticolimbic-ventral striatal networks in OCD-associated repetitive behaviors. Front Syst Neurosci. 2015;9:171. | ||
Milad MR, Rauch SL. Obsessive-compulsive disorder: beyond segregated cortico-striatal pathways. Trends Cogn Sci. 2012;16(1):43–51. | ||
Ullsperger M, von Cramon DY. The role of intact frontostriatal circuits in error processing. J Cogn Neurosci. 2006;18(4):651–664. | ||
Nakao T, Okada K, Kanba S. Neurobiological model of obsessive-compulsive disorder: evidence from recent neuropsychological and neuroimaging findings. Psychiatry Clin Neurosci. 2014;68(8):587–605. | ||
Remijnse PL, Nielen MM, van Balkom AJ, et al. Reduced orbitofrontal-striatal activity on a reversal learning task in obsessive-compulsive disorder. Arch Gen Psychiatry. 2006;63(11):1225–1236. | ||
Marsh R, Tau GZ, Wang Z, et al. Reward-based spatial learning in unmedicated adults with obsessive-compulsive disorder. Am J Psychiatry. 2015;172(4):383–392. | ||
Gu BM, Park JY, Kang DH, et al. Neural correlates of cognitive inflexibility during task-switching in obsessive-compulsive disorder. Brain. 2008;131(Pt 1):155–164. | ||
Fineberg NA, Chamberlain SR, Hollander E, Boulougouris V, Robbins TW. Translational approaches to obsessive-compulsive disorder: from animal models to clinical treatment. Br J Pharmacol. 2011;164(4):1044–1061. | ||
Roth RM, Saykin AJ, Flashman LA, Pixley HS, West JD, Mamourian AC. Event-related functional magnetic resonance imaging of response inhibition in obsessive-compulsive disorder. Biol Psychiatry. 2007;62(8):901–909. | ||
Demeter G, Racsmány M, Csigó K, Harsányi A, Németh A, Döme L. Intact short-term memory and impaired executive functions in obsessive compulsive disorder. Ideggyogy Sz. 2013;66(1–2):35–41. | ||
Karadag F, Oguzhanoglu NK, Kurt T, Oguzhanoglu A, Ateşci F, Ozdel O. Quantitative EEG analysis in obsessive compulsive disorder. Int J Neurosci. 2003;113(6):833–847. | ||
Sherlin L, Congedo M. Obsessive-compulsive dimension localized using low-resolution brain electromagnetic tomography (LORETA). Neurosci Lett. 2005;387(2):72–74. | ||
Pogarell O, Juckel G, Mavrogiorgou P, et al. Symptom-specific EEG power correlations in patients with obsessive-compulsive disorder. Int J Psychophysiol. 2006;62(1):87–92. | ||
Velikova S, Locatelli M, Insacco C, Smeraldi E, Comi G, Leocani L. Dysfunctional brain circuitry in obsessive-compulsive disorder: source and coherence analysis of EEG rhythms. Neuroimage. 2010;49(1):977–983. | ||
Kopřivová J, Congedo M, Horáček J, et al. EEG source analysis in obsessive-compulsive disorder. Clin Neurophysiol. 2011;122(9):1735–1743. | ||
Kopřivová J, Horáček J, Raszka M, Brunovský M, Praško J. Standardized low-resolution electromagnetic tomography in obsessive-compulsive disorder – a replication study. Neurosci Lett. 2013;548:185–189. | ||
Krause D, Folkerts M, Karch S, et al. Prediction of treatment outcome in patients with obsessive-compulsive disorder with low-resolution brain electromagnetic tomography: a prospective EEG Study. Front Psychol. 2015;6:1993. | ||
Sponheim SR, Clementz BA, Iacono WG, Beiser M. Clinical and biological concomitants of resting state EEG power abnormalities in schizophrenia. Biol Psychiatry. 2000;48(11):1088–1097. | ||
Lavoie S, Schäfer MR, Whitford TJ, et al. Frontal delta power associated with negative symptoms in ultra-high risk individuals who transitioned to psychosis. Schizophr Res. 2012;138(2–3):206–211. | ||
Leuchter AF, Cook IA, Hunter AM, Cai C, Horvath S. Resting-state quantitative electroencephalography reveals increased neurophysiologic connectivity in depression. PLoS One. 2012;7(2):e32508. | ||
Meerwijk EL, Ford JM, Weiss SJ. Resting-state EEG delta power is associated with psychological pain in adults with a history of depression. Biol Psychol. 2015;105:106–114. | ||
Sachs G, Anderer P, Dantendorfer K, Saletu B. EEG mapping in patients with social phobia. Psychiatry Res. 2004;131(3):237–247. | ||
Bandelow B, Zohar J, Hollander E, et al. World Federation of Societies of Biological Psychiatry (WFSBP) guidelines for the pharmacological treatment of anxiety, obsessive-compulsive and post-traumatic stress disorders – first revision. World J Biol Psychiatry. 2008;9(4):248–312. | ||
Graybiel AM, Rauch SL. Toward a neurobiology of obsessive-compulsive disorder. Neuron. 2000;28(2):343–347. | ||
Stein DJ, Fineberg NA, Bienvenu OJ, et al. Should OCD be classified as an anxiety disorder in DSM-V? Depress Anxiety. 2010;27(6):495–506. | ||
Brewer D, Doughtie EB. Induction of mood and mood shift. J Clin Psychol. 1980;36(1):215–226. | ||
Abele A. Recall of positive and negative life events. Studies of mood-inducing effect and production of texts. Z Exp Angew Psychol. 1990;37(2):181–207. | ||
Prasko J, Mozny P, Slepecky M. Kognitivne behavioralni terapie psychickych poruch. Triton. 2007. | ||
Abramowitz JS. Variants of exposure and response prevention in the treatment of obsessive-compulsive disorder: a meta-analysis. Behav Ther. 1996;27(4):583–600. | ||
Gillihan SJ, Williams MT, Malcoun E, Yadin E, Foa EB. Common pitfalls in exposure and response prevention (EX/RP) for OCD. J Obsessive Compuls Relat Disord. 2012;1(4):251–257. | ||
Pitman RK, Orr SP, Forgue DF, de Jong JB, Claiborn JM. Psychophysiologic assessment of posttraumatic stress disorder imagery in Vietnam combat veterans. Arch Gen Psychiatry. 1987;44(11):970–975. | ||
Bond CVA. Personal relevance is an important dimension for visceral reactivity in emotional imagery. Cognition & Emotion. 1998;12(2):231–242. | ||
Admon R, Bleich-Cohen M, Weizmant R, Poyurovsky M, Faragian S, Hendler T. Functional and structural neural indices of risk aversion in obsessive-compulsive disorder (OCD). Psychiatry Res. 2012;203(2–3):207–213. | ||
van den Heuvel OA, Veltman DJ, Groenewegen HJ, et al. Disorder-specific neuroanatomical correlates of attentional bias in obsessive-compulsive disorder, panic disorder, and hypochondriasis. Arch Gen Psychiatry. 2005;62(8):922–933. | ||
Thomas SJ, Gonsalvez CJ, Johnstone SJ. Neural time course of threat-related attentional bias and interference in panic and obsessive-compulsive disorders. Biol Psychol. 2013;94(1):116–129. | ||
EMEA. COMMISSION DIRECTIVE 2005/28/EC of 8 April 2005. Laying down principles and detailed guidelines for good clinical practice as regards investigational medicinal products for human use, as well as the requirements for authorisation of the manufacturing or importation of such products. Available from: https://ec.europa.eu/health//sites/health/files/files/eudralex/vol-1/dir_2005_28/dir_2005_28_en.pdf. Accessed August 13, 2018. | ||
Sheehan DV, Lecrubier Y, Sheehan KH, et al. The Mini-International Neuropsychiatric Interview (M.I.N.I.): the development and validation of a structured diagnostic psychiatric interview for DSM-IV and ICD-10. J Clin Psychiatry. 1998;59(Suppl 20):22–33. | ||
Beck AT, Epstein N, Brown G, Steer RA. An inventory for measuring clinical anxiety: psychometric properties. J Consult Clin Psychol. 1988;56(6):893–897. | ||
Hamilton MC, Schutte NS, Malouff JM. Hamilton anxiety scale (HAMA). Sourcebook of Adult Assessment (Applied Clinical Psychology); 1976:154–157. | ||
Beck AT, Ward CH, Mendelson M, Mock J, Erbaugh J. An inventory for measuring depression. Arch Gen Psychiatry. 1961;4:561–571. | ||
Preiss M, Vaclíř K. Beckova sebeposuzující škála depresivity pro dospělé BDI-II, příručka. Psychodiagnostika: Brno; 1999. | ||
Hamilton M. A rating scale for depression. J Neurol Neurosurg Psychiatry. 1960;23:56–62. | ||
Goodman WK, Rasmussen SA, Price LH. Yale-Brown Obsessive-Compulsive Scale (Y-BOCS). New Haven, CT: Yale University, Department of Psychiatry; 1986. | ||
Kubicki S, Herrmann WM, Fichte K, Freund G. Reflections on the topics: EEG frequency bands and regulation of vigilance. Pharmakopsychiatr Neuropsychopharmakol. 1979;12(2):237–245. | ||
Pascual-Marqui RD. Standardized low-resolution brain electromagnetic tomography (sLORETA): technical details. Methods Find Exp Clin Pharmacol. 2002;24(Suppl D):5–12. | ||
Holmes AP, Blair RC, Watson JD, Ford I. Nonparametric analysis of statistic images from functional mapping experiments. J Cereb Blood Flow Metab. 1996;16(1):7–22. | ||
Talairach J. Tournoux P: Co-planar Stereotaxic Atlas of the Human Brain. Stuttgart: Thieme; 1988. | ||
Hamilton M. The assessment of anxiety states by rating. Br J Med Psychol. 1959;32(1):50–55. | ||
Kamarádová D, Prasko J, Latalova K, et al. Psychometric properties of the Czech version of the Beck Anxiety Inventory – comparison between diagnostic groups. Neuro Endocrinol Lett. 2015;36(7):706–712. | ||
Mckay D, Danyko S, Neziroglu F, Yaryura-Tobias JA. Factor structure of the Yale-Brown Obsessive-Compulsive Scale: a two dimensional measure. Behav Res Ther. 1995;33(7):865–869. | ||
O’Connor KP, Aardema F, Robillard S, et al. Cognitive behaviour therapy and medication in the treatment of obsessive-compulsive disorder. Acta Psychiatr Scand. 2006;113(5):408–419. | ||
Buzsáki G. Theta oscillations in the hippocampus. Neuron. 2002;33(3):325–340. | ||
Başar-Eroğlu C, Başar E, Demiralp T, Schürmann M. P300-response: possible psychophysiological correlates in delta and theta frequency channels. A review. Int J Psychophysiol. 1992;13(2):161–179. | ||
Harmony T, Fernández T, Silva J, et al. EEG delta activity: an indicator of attention to internal processing during performance of mental tasks. Int J Psychophysiol. 1996;24(1–2):161–171. | ||
Klimesch W, Schimke H, Schwaiger J. Episodic and semantic memory: an analysis in the EEG theta and alpha band. Electroencephalogr Clin Neurophysiol. 1994;91(6):428–441. | ||
Rangaswamy M, Porjesz B, Chorlian DB, et al. Resting EEG in offspring of male alcoholics: beta frequencies. Int J Psychophysiol. 2004;51(3):239–251. | ||
Maltby N, Tolin DF, Worhunsky P, O’Keefe TM, Kiehl KA. Dysfunctional action monitoring hyperactivates frontal-striatal circuits in obsessive-compulsive disorder: an event-related fMRI study. Neuroimage. 2005;24(2):495–503. |
 © 2018 The Author(s). This work is published and licensed by Dove Medical Press Limited. The
full terms of this license are available at https://www.dovepress.com/terms
and incorporate the Creative Commons Attribution
- Non Commercial (unported, 3.0) License.
By accessing the work you hereby accept the Terms. Non-commercial uses of the work are permitted
without any further permission from Dove Medical Press Limited, provided the work is properly
attributed. For permission for commercial use of this work, please see paragraphs 4.2 and 5 of our Terms.
© 2018 The Author(s). This work is published and licensed by Dove Medical Press Limited. The
full terms of this license are available at https://www.dovepress.com/terms
and incorporate the Creative Commons Attribution
- Non Commercial (unported, 3.0) License.
By accessing the work you hereby accept the Terms. Non-commercial uses of the work are permitted
without any further permission from Dove Medical Press Limited, provided the work is properly
attributed. For permission for commercial use of this work, please see paragraphs 4.2 and 5 of our Terms.