Back to Journals » ClinicoEconomics and Outcomes Research » Volume 12
Economic Evaluation of Single versus Combination Immuno-Oncology Therapies: Application of a Novel Modelling Approach in Metastatic Melanoma
Authors Gibson EJ, Begum N, Koblbauer I, Dranitsaris G, Liew D, McEwan P ![]() , Yuan Y, Juarez-Garcia A, Tyas D, Pritchard C
, Yuan Y, Juarez-Garcia A, Tyas D, Pritchard C ![]()
Received 15 November 2019
Accepted for publication 26 March 2020
Published 6 May 2020 Volume 2020:12 Pages 241—252
DOI https://doi.org/10.2147/CEOR.S238725
Checked for plagiarism Yes
Review by Single anonymous peer review
Peer reviewer comments 2
Editor who approved publication: Prof. Dr. Dean Smith
Eddie J Gibson,1 Najida Begum,1 Ian Koblbauer,1 George Dranitsaris,2 Danny Liew,3 Phil McEwan,4 Yong Yuan,5 Ariadna Juarez-Garcia,6 David Tyas,6 Clive Pritchard1
1Wickenstones Ltd, Abingdon, UK; 2Augmentium Pharma Consulting Inc., Toronto, ON, Canada; 3School of Public Health and Preventive Medicine, Monash University, Melbourne, VIC, Australia; 4Health Economics and Outcomes Research Ltd, Cardiff, UK; 5Bristol-Myers Squibb, Lawrenceville, NJ, USA; 6Bristol-Myers Squibb, Uxbridge, UK
Correspondence: Clive Pritchard
Wickenstones Ltd., Units 24-26, 127 Olympic Avenue, Milton Park, Abingdon, Oxfordshire OX14 4SA, UK
Tel + 441865 959735
Email [email protected]
Background: Existing economic model frameworks may not adequately capture the atypical treatment response patterns in immuno-oncology (I-O) compared with conventional therapies and thus may fail to represent the full clinical value associated with disease dynamics and improved survival.
Objective: A cost-effectiveness analysis (CEA) of the I-O Regimen (nivolumab/ipilimumab) versus ipilimumab alone in advanced melanoma was carried out by applying a 5-state partitioned survival model (PSM) as a case study, to explore the I-O treatment response and clinical outcomes. The findings were compared with those of a conventional 3-state PSM.
Materials and Methods: The case study extends the conventional 3-state PSM, by separating the pre-progression state into non-responders and responders, and the post-progression state into normal and I-O progression to account for delayed treatment effects preceding clinical response. Model states were populated using patient-level data (where possible), mapping from the best overall response (BOR), and survival analysis with flexible and traditional parametric methods. Survival functions were applied to progression-free survival (PFS) and overall survival (OS) endpoints across treatment arms using the 4-year follow-up data (data available at the time of the research; since then 5-year follow-up data have been published) from the CheckMate 067 trial. Information on BOR was used as a means of differentiating the I-O treatment response in addition to the outcomes of progression-free and progressed disease. A UK National Health Service and personal social services (NHS/PSS) perspective over a lifetime horizon was used with outcomes discounted at 3.5% annually.
Results: The 5-state PSM generated an increase in quality adjusted life years (QALYs) in both treatment arms and gave a more granular description of patients’ health profiles compared with the traditional 3-state PSM. The incremental QALY increased by 13% (from 2.62 to 2.95 QALYs) and the incremental cost decreased by 12% (£ 29,125 to £ 25,678) with the 5-state model. In both models, the Regimen had an incremental cost-effectiveness ratio (ICER) relative to ipilimumab alone within the lower bound of the National Institute for Health and Care Excellence (NICE) reference range (£ 20,000 per QALY gained).
Conclusion: A 5-state economic model, incorporating relevant I-O health states, can be more informative to gain insight into treatment response and progression differences that are not commonly captured in existing economic models. Clinical trial endpoints, including those relating to treatment response, which are not directly reported in ongoing I-O trials, can be mapped on to the proposed modelled health states (although assumptions are required to do so). Improvements in reporting treatment response in future I-O clinical trials could help to further validate and improve the proposed model framework.
Keywords: immunotherapy, cost-effectiveness, melanoma, CheckMate 067
Introduction
Health technology assessment (HTA) processes aim to provide early guidance about the appropriate use of new technologies within the health-care system and thus avoid delays in access to innovative medicines. This trend means that the analysis of effectiveness and cost-effectiveness, particularly for new classes of drugs, draws to a considerable extent, if not solely, on data collected as part of Phase II or III clinical trial programmes (head to head trials or pooled analysis from a number of trials). However, decision makers are concerned with long-term (frequently lifetime) costs and patient outcomes, such as life expectancy and quality adjusted life years (QALYs).1 In this context, analytical issues including the extrapolation of clinical benefit beyond the time horizon of the clinical trial and the structure of economic model health states to capture treatment modalities are critical to obtaining robust estimates of effectiveness and cost-effectiveness.2,3
Immuno-oncology (I-O) agents are an evolving treatment modality that harnesses the immune system to fight cancer. I-O has already been successfully used in the treatment of various tumour types with limited therapeutic options, including melanoma, squamous and non-squamous lung cancer and renal cell carcinoma.4 In I-O, treatment response kinetics differ fundamentally from those observed with conventional therapies. Whereas the latter exhibit early clinical benefit with limited durability, I-O responses can show atypical survival patterns with durable response in a subset of patients, examples being tumour flares preceding clinical response (also referred to as pseudo-progression),5,6 and prolonged biological effects occurring even after treatment discontinuation.6–9 Emerging response patterns include hyperprogressive disease (HPD) (anecdotal occurrences of rapid progression) potentially caused by the deleterious effects of I-O. The prevalence and predictive factors (which may include treatment in elderly populations >65 years) of HPD remain unknown, raising concerns about our growing understanding of I-O treatments.4
In recent years, techniques of survival analysis and approaches to structuring economic models have come under increased scrutiny with the introduction of I-O agents in the treatment of cancer. Developing a well-established basis for modelling in I-O, so that clinical trial and long-term observational data can be represented in a more meaningful way, requires an understanding of emerging treatment patterns and the paradigm shift of toxicity and response compared with conventional therapies. In oncology, economic model structures are frequently based around the traditional clinical trial metrics of progression-free survival (PFS) and overall survival (OS), where OS (notwithstanding its statistical challenges) is still considered to be the gold standard in evaluating clinical efficacy (including I-O agents). OS and PFS are directly implemented into and form the basis for the characteristic 3-state partitioned survival model (PSM) with “pre-progression”, “progressive disease” and “death” health states (Figure 1), in which response patterns unique to I-O are not captured explicitly. While the 3-state model is straightforward to implement and widely accepted, there is a case for rethinking this approach in light of observed I-O response patterns.5
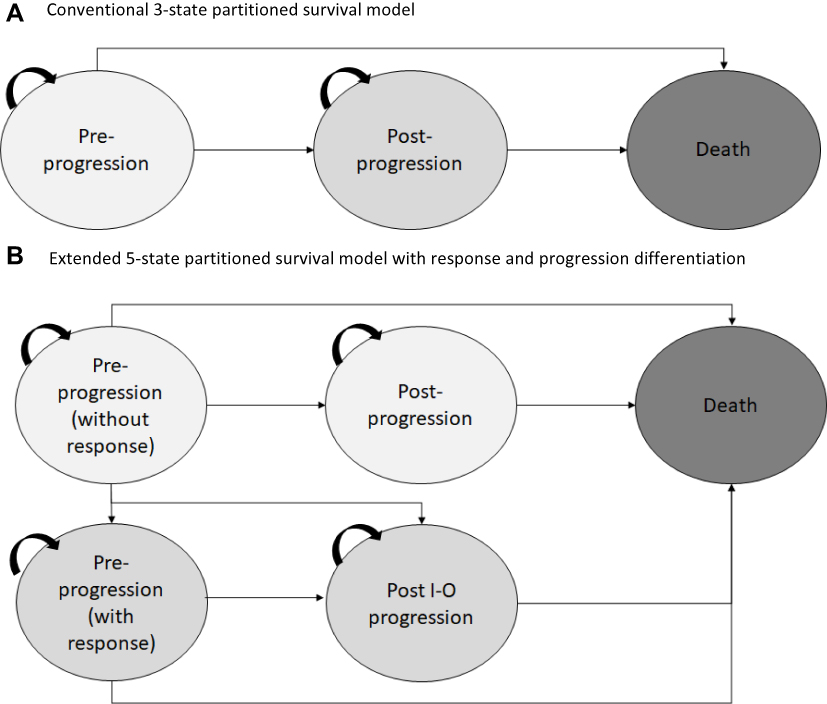 |
Figure 1 Model schematic for the (A) conventional three-state partitioned survival model commonly used in oncology (B) extended five state model proposed with additional health states to differentiate levels of response and progression types to capture I-O treatment response and disease dynamics. |
As part of an ongoing investigation into innovative economic modelling approaches, this paper complements previous studies on the extrapolation of clinical benefit beyond the clinical trial period7 and a comparison of cohort models8 with a patient level simulation (PLS).10 Throughout the research, the case study of malignant melanoma has been used as it is the condition in which the longest follow-up trial data in I-O is available (with ipilimumab).11 The current study builds particularly on Gibson et al (2018) who compared a 3-state PSM and extensions thereof with a Markov model and found that the PSM-based approaches generated results more closely comparable with existing trial data endpoints than the Markov model,8 as expected given the way in which clinical data was reported. The 5-state extended model was structurally more informative than 3-state or 4-state models8 and is here used to evaluate the cost-effectiveness of the Regimen (nivolumab/ipilimumab) versus ipilimumab, by comparing the clinical and economic model outcomes with those of the conventional 3-state PSM from a United Kingdom (UK) National Health Service and personal social services (NHS/PSS) perspective.
Materials and Methods
Patient Population and Trial Data
The CheckMate 067 trial (ClinicalTrials.gov number NCT01844505) is a Phase III double-blind clinical trial of 945 treatment-naïve patients with metastatic melanoma who were randomly assigned 1:1:1 to the following groups:
- 3mg/kg of nivolumab (n=316) every 2 weeks (plus matched ipilimumab placebo)
- 3mg/kg of ipilimumab (n=315) every 3 weeks for four doses (plus matched nivolumab placebo)
- 1mg/kg of nivolumab plus 3mg/kg of ipilimumab (n=314) every 3 weeks for four doses followed by 3mg/kg of nivolumab every 2 weeks
Consistent with the dosing schedules from the trial, treatment continued until disease progression as defined by Response Evaluation Criteria in Solid Tumours (RECIST 1.1), although treatment could be continued in patients with clinical benefit and without substantial adverse events (AEs). Treatment was also discontinued in the event of unacceptable toxicity or withdrawal from the study. Full details of the trial have been reported elsewhere.11 Both models presented here are populated with data from the CheckMate 067 study but are intended as illustrative examples of the methods rather than being concerned with the features of the particular technologies included in the Checkmate 067 study.
Model Overview
The conventional 3-state and an extended 5-state version of the PSM (Figure 1A and B) were developed in Microsoft Excel 2010 to capture treatment response and disease dynamics of the Regimen versus ipilimumab. The models simulate the long-term clinical and economic outcomes of I-O management in advanced melanoma patients over a lifetime horizon of 40 years.
The models consider a UK NHS/PSS perspective, consistent with the NICE reference case (and to facilitate comparison with other technologies) and capture direct costs, life years gained (LYG) and QALYs. Both costs and outcomes were discounted at 3.5% annually.12 Additionally, to assess clinical value, trial endpoints for OS (years 1–4), PFS (years 1–4), and best overall response (BOR) at the mean time to response were extracted from the models and compared with those reported in the CheckMate 067 trial (Table 1).13
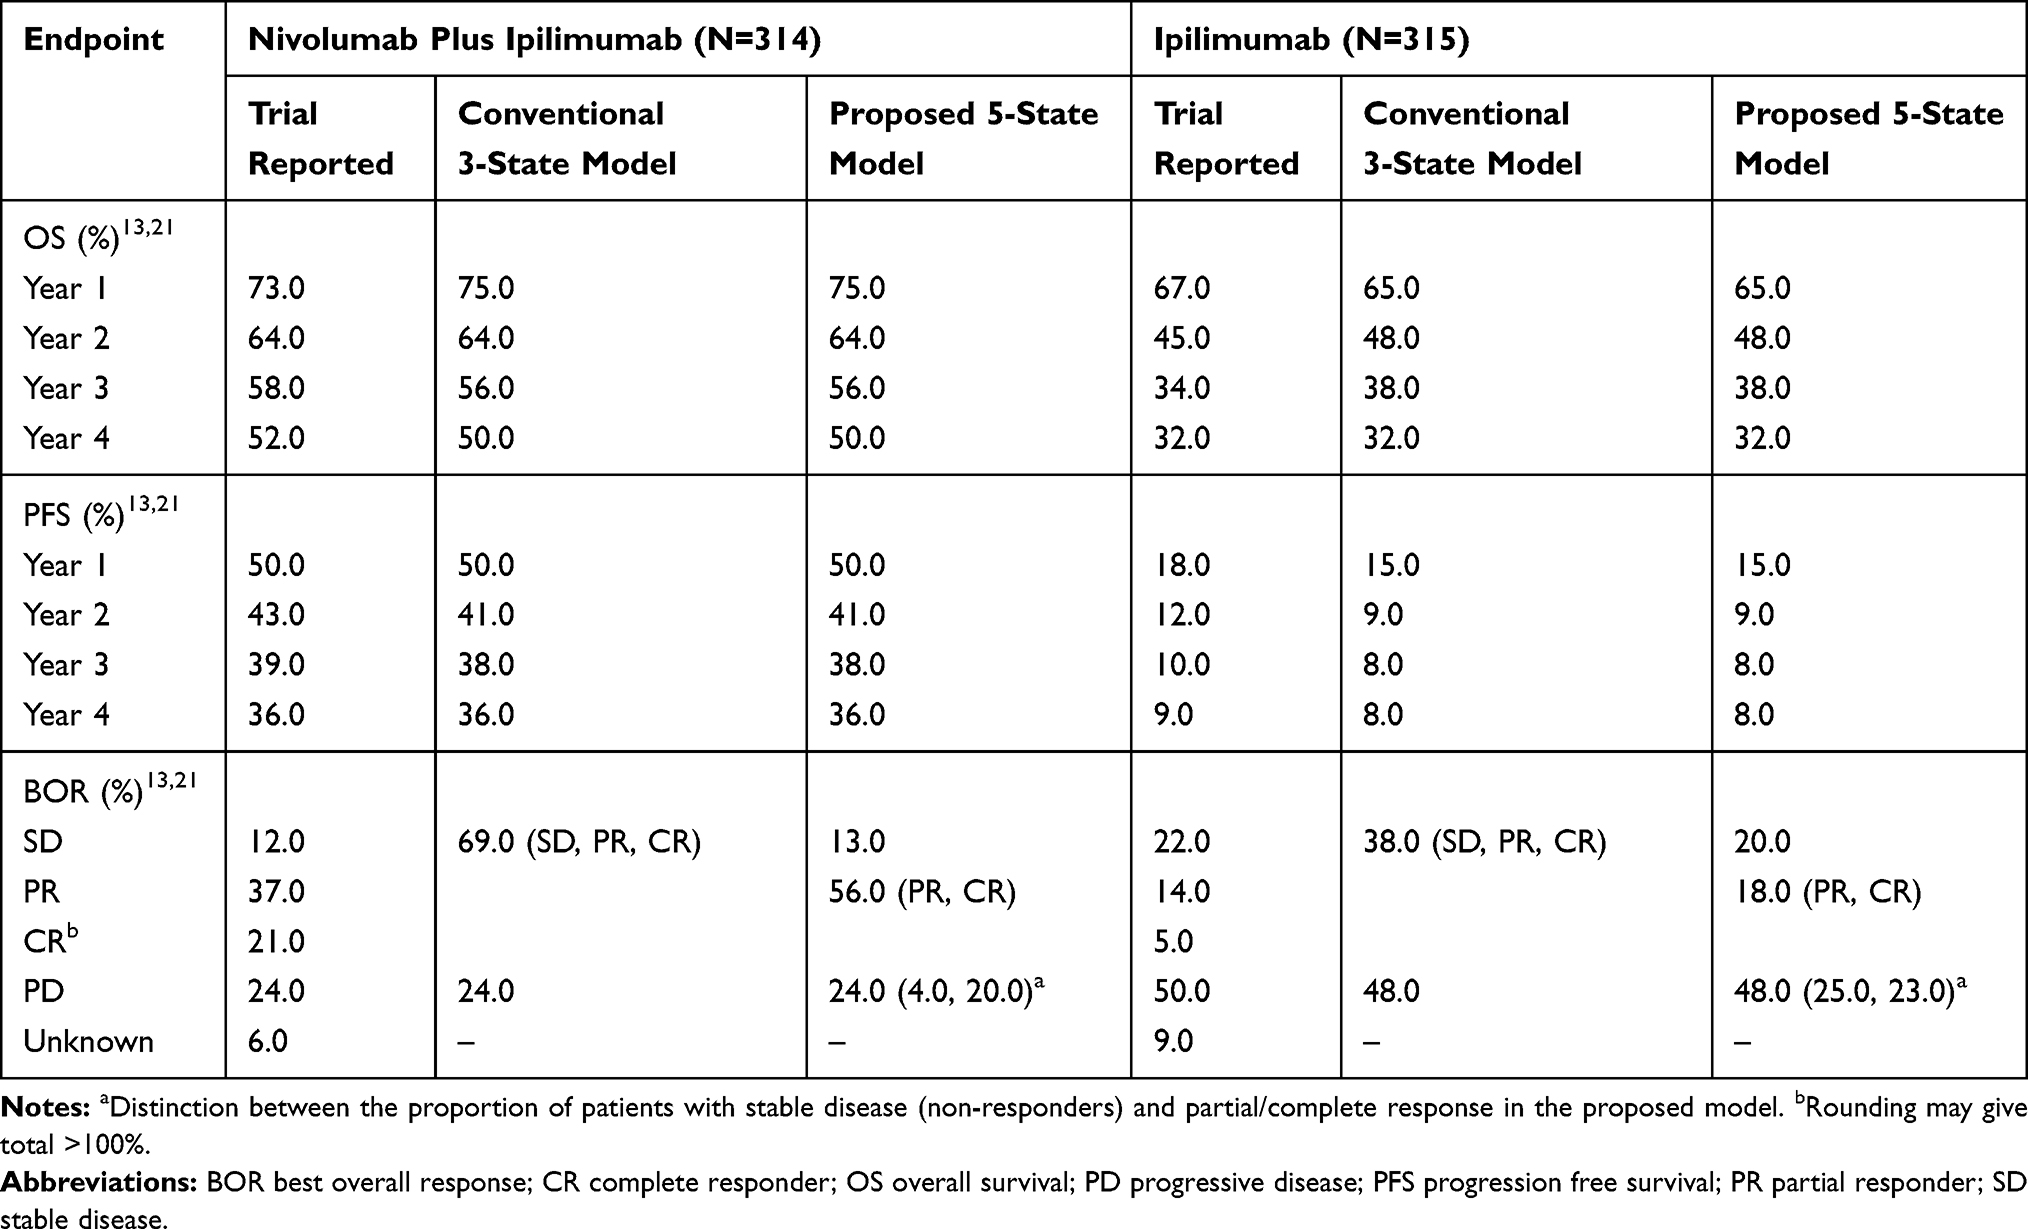 |
Table 1 Summary of the Reported Trial Endpoints Compared to Those Generated by the Proposed Five-State and Three State Partitioned Survival Model |
Model Structure
The conventional 3-state PSM consists of pre-progression (PP), post-progression (PsP) and death states, without distinction between non-responders and responders. This could misrepresent the clinical benefit of I-O compared with traditional therapies (eg, chemotherapy) as I-O responses suggest that patients receiving this form of therapy have a more nuanced disease trajectory than one represented by progression-free and progressed states. Here, an extension to the conventional approach was developed with five states to account for the treatment response in I-O. The pre-progression state was divided into non-responders (PP1) where the disease remains unchanged (but without progression) and responders (PP2) where there is a clinical improvement in the disease. The progression state was divided into normal progression (PsP1) to capture progression of non-responders and I-O progression (PsP2) for progression in responders as presented in Figure 1.5
The clinical endpoints for PFS and OS are mapped directly to PP and death health states, with PsP being the difference between OS and PFS. In the extended model, further assumptions on patients’ response status to differentiate proportions with stable disease (SD), partial response (PR) and complete response (CR) within the clinical endpoints (specifically for PFS) were determined by the best overall response (BOR) classification based on patient-level data from the CheckMate 067 trial. Those classified as PP1 were those who had SD with no clinical change in lesions while the PP2 group consisted of those with PR or CR. PsP1 consisted of progression of non-responders with SD and the PsP2 state was made up of those with PR/CR who progressed. All patients entered the PP state in the 3-state PSM and PP1 state in the 5-state model, where patients were treated until discontinuation or progression.
The base case population represents the CheckMate 067 trial with an assumed maximum treatment period of two years consistent with previous publications.12 In the models, monthly cycles and a half-cycle correction were applied.
Survival Estimation
The risks of underlying progression and death were based on patient level trial data and 4-year follow-up summary K-M data available at the time of research (the Guyot algorithm was used to recreate the K-M plots) 14 from the CheckMate 067 trial15 (since the research was initiated recent 5-year data has been published16). To assess the most suitable survival distribution on which to base extrapolation beyond the period of follow-up in the trial, both OS and PFS endpoints from each treatment arm were interpolated by applying traditional parametric and flexible approaches (other approaches including mixture cure models can be applied although assumptions on the cured rates need to be established).17 It should be noted that the median OS has not been reached in the Regimen which may impact the interpretation of the extrapolations presented and future analyses (still not reached in the 5-year data).18
Traditional parametric methods using Weibull, exponential, Gamma, log-normal and log-logistic functions, as well as flexible parametric survival models using restricted cubic splines (RCS) with 1–7 knots, were fitted to both OS and PFS in each treatment arm. Goodness of fit for each predicted survival model was based on visual inspection against the K-M plots, statistical tests for Akaike information criterion (AIC) and Bayesian information criterion (BIC) and clinical validity. The extrapolated survival estimates were validated against available long-term external data11 and adjusted for background mortality based on UK lifetables 2015–2017.19
For PFS, the RCS with one knot was found to provide the best fit in both treatment arms. For OS, the log-logistic function was deemed most suitable in the combination treatment arm, and RCS with one knot was found to provide the best fit in the ipilimumab arm (Figure 2A and B present selected model fits).
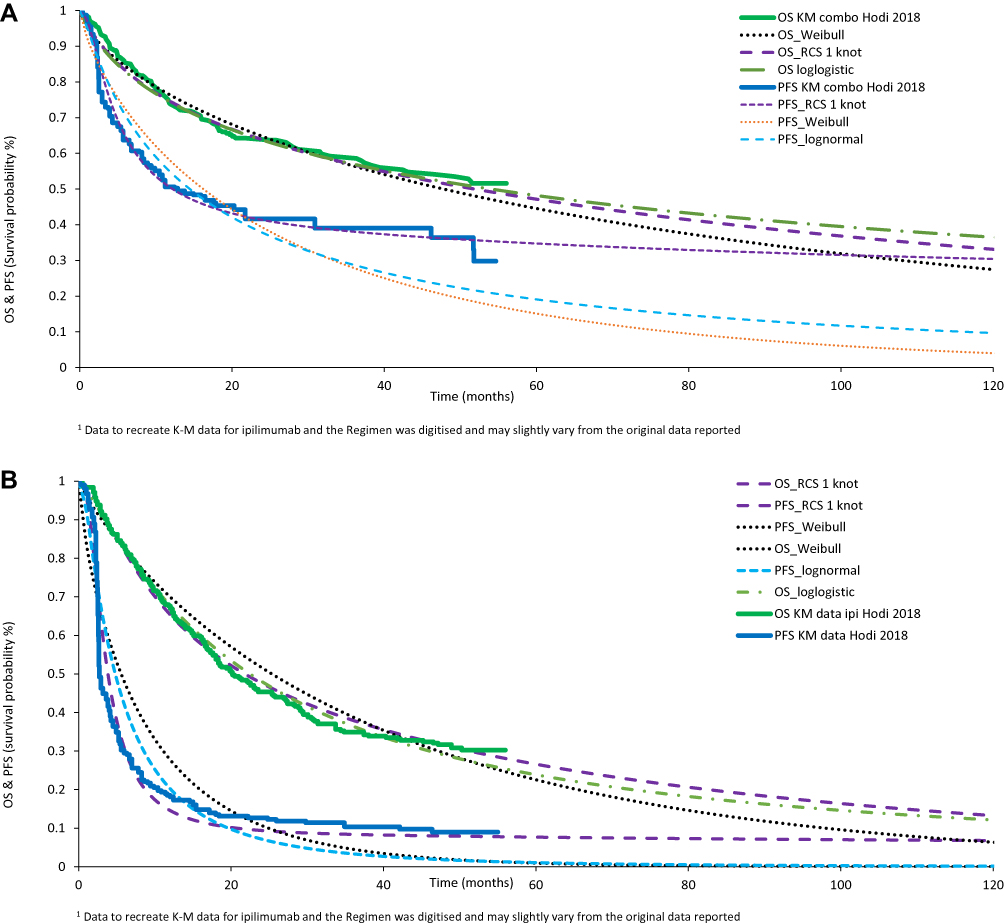 |
Figure 2 Comparison of the observed and selected (including best fit) survival curves with (A) Regimen (nivolumab/ipilimumab) and (B) ipilimumab for overall survival and progression-free survival. |
Data Sources
The manufacturer provided individual patient level data from the CheckMate 067 trial, including BOR data on which the health state definitions were based. For convenience, data on health-care costs were the same as those used in the manufacturer’s submission to NICE appraisal TA400 (although the submission is used as a reference and not for comparative purposes here).14
Costs
Resource use prior to death in this analysis uses a four-part structure based on time since treatment initiation (first year, second year, third and subsequent years) and proximity to death. One-off costs were associated with treatment initiation and end-of-life care while costs for pre-progression and post-progression in the first, second and third and later years were based on monthly costs. Drug costs and costs associated with adverse events were determined by patients’ on treatment/off treatment status (Table 2). Resource use and unit costs associated with AEs were provided by the manufacturer and appropriately uprated. The models assume a maximum time on treatment of two years. Following treatment discontinuation, patients can move on to best supportive care (BSC) which has a zero-intervention cost, although other costs associated with management of the disease (which could include alternative lines of treatment) still apply (eg palliative costs are captured in the health state costs).14 This approach is recognised as a simplification but is considered a reasonable approximation to clinical practice. Unit costs were drawn from standard sources (eg NHS Reference Costs, PSSRU Costs of Health and Social Care and the British National Formulary). Costs were uprated from 2014/15 to 2015/16 prices using the Hospital and Community Health Services (HCHS) pay and prices index (Table 2).15 All drug costs are at current list prices which do not consider confidential discounts, such as Patient Access Schemes.16,17 This means that the CEA may not reflect the analysis used by UK health care decision makers who benefit from these discounts.
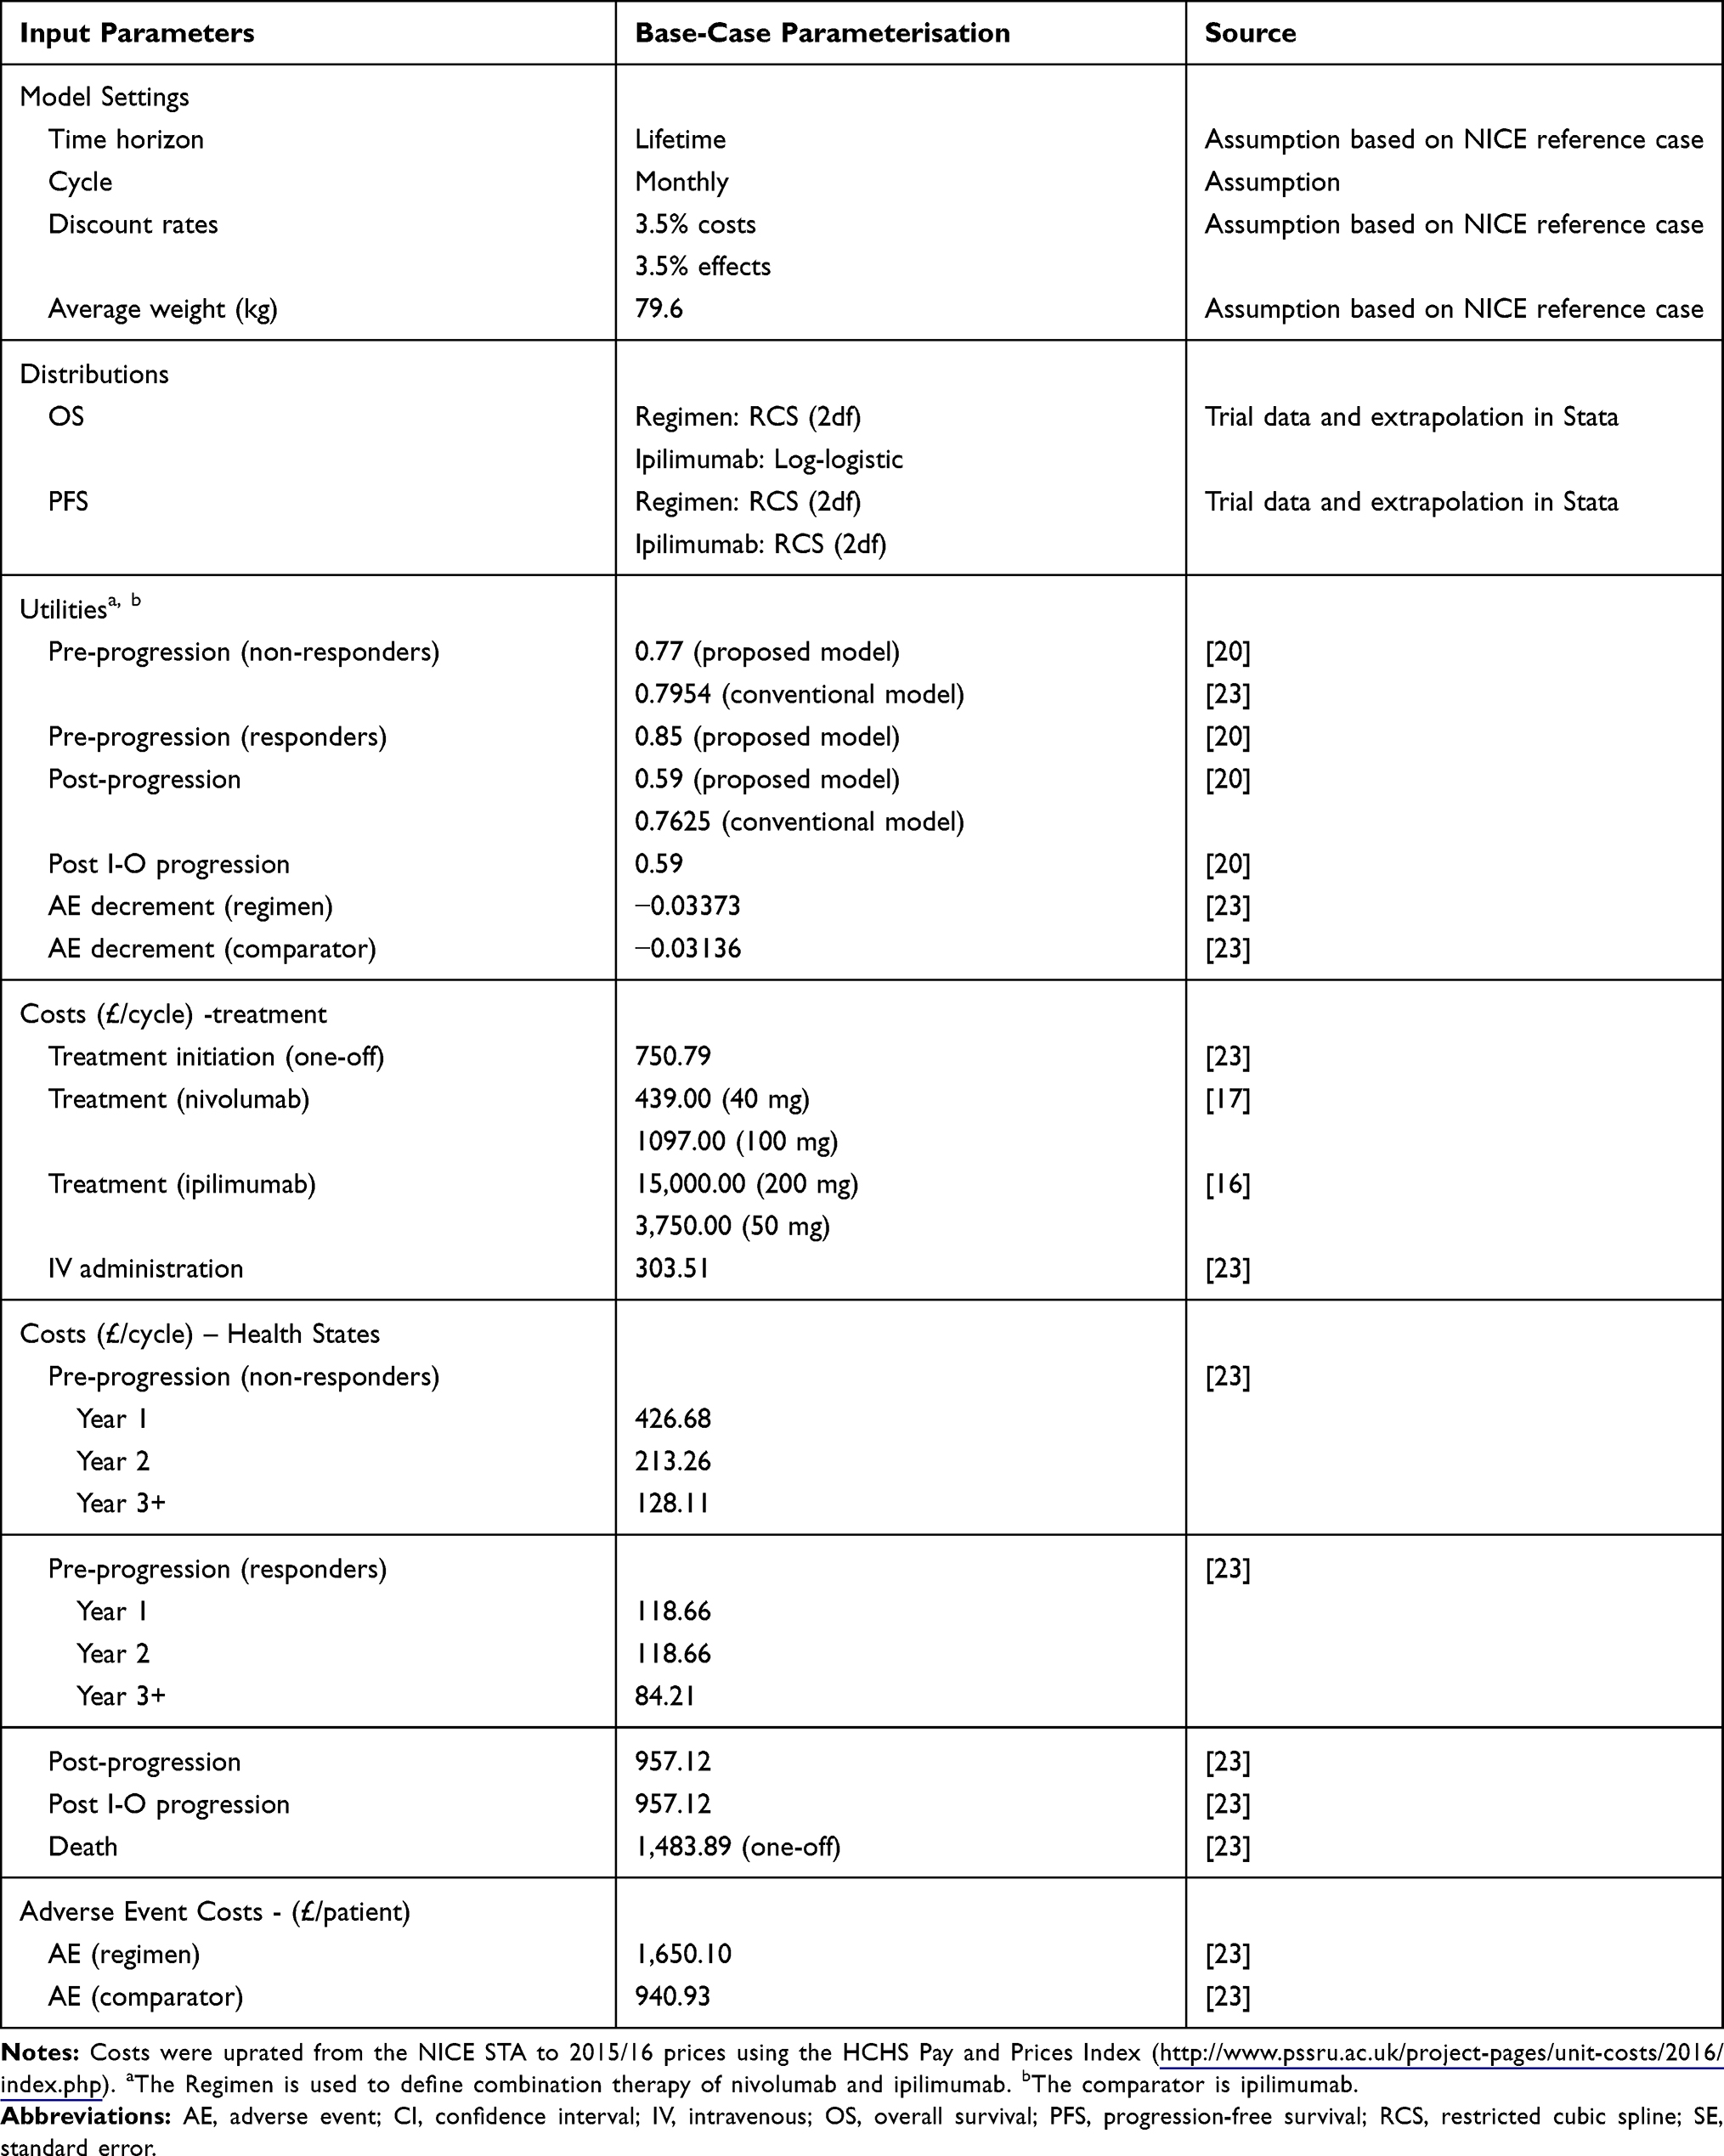 |
Table 2 Key Model Input Parameters and Respective Confidence Intervals Used to Populate the Best Fit Five-State Cost-Effectiveness Model |
Utility Values
Health-related quality of life estimates suitable for calculating QALYs were drawn from the literature and mapped to the modelled health states, without differentiation between patients on and off treatment or between treatment arms. In the absence of literature for specific health states defined in the proposed models, proxies based on closely related health states were used to estimate economic outcomes (Table 1).
Beusterien et al (2009) reported a set of universal utility values relating to clinical response states for PR, SD and PD in advanced melanoma for the general UK population to capture the variation in utilities with treatment response. These values were applied to the 5-state PSM, where the utility estimate for SD (0.770) was allocated to the PP1 health state while the PR utility value (0.850) was assigned to the PP2 state. The progressive disease (PD) utility value (0.590) was assigned to normal (PsP1) and I-O progression (PsP2) states in the absence of information to differentiate between progression in responders and non-responders.20
For the conventional 3-state PSM, the utility values of 0.7954 and 0.7625 were applied to PP and PsP respectively, consistent with the reported outcomes used in the manufacturer’s submission.18 The ability to use a more granular set of utilities is a potential advantage of the 5-state model. However, any comparison of the magnitude of QALY gains between the two models needs to be carried out with caution given the different literature sources used for utilities.
Results
Clinical Trial Outcomes
The OS and PFS endpoints taken from the CheckMate 067 trial were applied to both the 3-state and 5-state models, and corresponding outcomes between models were identical as presented in Table 1. The modelled survival outcomes for the Regimen in each of the first 4 years were 75%, 64%, 56% and 50% for OS and 50%, 41%, 38% and 36% for PFS. For the ipilimumab arm, modelled survival outcomes over the 4 years were 65%, 48%, 38% and 32% for OS and 15%, 9%, 8% and 8% for PFS. When compared with the reported OS trial results (73%, 64%, 58% and 52%), the modelled Regimen results demonstrate a slightly closer alignment with the trial than those in the ipilimumab arm did with the corresponding OS results from the trial (67%, 45%, 34% and 32%) across all 4 years (although both were comparable).
The treatment response outcomes for BOR with the 5-state model provide a more granular breakdown compared with the 3-state model. With the Regimen, the proportion of patients with non-progressive disease was 69% (SD/PR/CR), made up of 13% with SD and 56% with PR/CR, when compared against the trial BOR results. The model results were 8% higher than the trial outcomes for SD and 3% lower for PR/CR. With the Regimen, 24% of patients had PD in both the trial and the model. For the ipilimumab arm, the model predicts 38% with non-progressive disease, composed of 20% with SD and 18% with PR/CR. The model outcomes were lower than the trial outcomes by 9% and 5%, respectively, for SD and PR/CR. For progressive disease, the model understates trial outcomes by 4%.
Incremental Modelled Costs and Outcomes
In the base-case analysis over a lifetime horizon for the 5-state model, the Regimen generated a mean of 5.72 QALYs (discounted) and an associated mean total lifetime cost of £114,402. In patients treated with ipilimumab, the model estimated a mean of 2.76 QALYs and an associated cost of £88,724. The incremental cost of £25,678 and incremental health gain of 2.95 QALYs gave an incremental cost-effectiveness ratio (ICER) of £8,703 per QALY gained for the Regimen versus ipilimumab (Table 3). The conventional 3-state PSM generated an incremental cost with the Regimen of £29,125 (£118,664 versus £89,740) and incremental health gain of 2.62 QALYs (5.32 versus 2.70 QALYs), giving an ICER of £11,119.
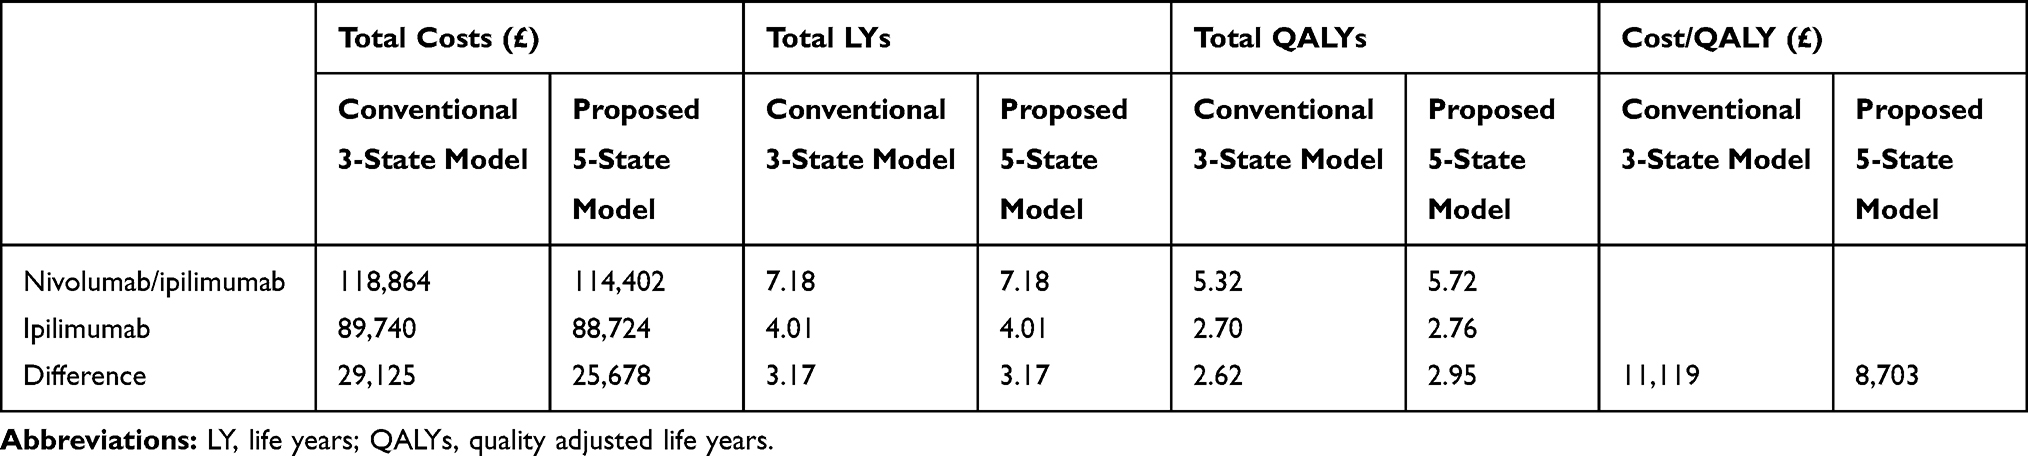 |
Table 3 Aggregated Cost-Effectiveness Results for the Base Case of the Conventional Three-State and Proposed Five-State Models |
Sensitivity Analyses
The robustness of the ICER generated by the 5-state model to changes in input parameters is illustrated by the results of the probabilistic sensitivity analysis (PSA) presented as a scatter plot in Figure 3. Incremental costs and QALYs for the combination therapy versus ipilimumab lie within a relatively narrow range in the north east quadrant of the cost-effectiveness plane (increased costs and increased QALYs). The mean probabilistic ICER across the 1000 simulations is £7,920. The probability that combination therapy is cost-effective becomes one at a willingness to pay of around £11,000 or greater per QALY.
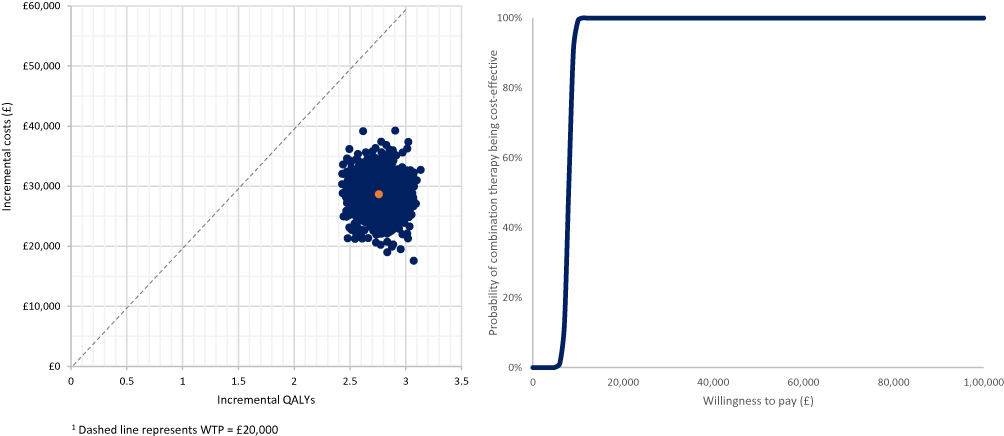 |
Figure 3 Probabilistic sensitivity analysis results for the (A) cost-effectiveness scatter plot and (B) cost-effectiveness acceptability curve. |
Discussion
This study continues an ongoing research programme into innovative modelling which was prompted by treatment response patterns observed with I-O that differ from traditional therapies. The conventional 3-state PSM is extended into a 5-state model by differentiating between non-responders and responders within pre-progression and post-progression health states. Patient-level data and recent 4-year follow-up data21 from the CheckMate 067 trial were applied to both models which were compared in terms of clinical and economic model outcomes to assess their suitability and ability to model disease dynamics. Clinical endpoints of PFS, OS and BOR and common economic outcomes of LYs, QALYs and costs were considered in the evaluation.10
The modelled outcomes for OS and PFS with the Regimen were more closely comparable with the reported trial endpoints than those in the ipilimumab arm over 4 years. This is driven by the best fits from the survival analysis. It should be noted that the current understanding in I-O is still evolving. As more follow-up data becomes available (an example being extrapolation of the CheckMate 067 trial based on 2-year data8,10 compared with the updated extrapolations for 4-year data presented here) and further updates become available or are expected (5-year follow-up data reported OS of 52% and 26% and PFS of 36% and 8% for the Regimen and ipilimumab arms, respectively),18 extrapolations should be updated to ensure they capture the disease dynamics. At 5 years, extrapolations with optimal goodness of fit for OS of 49% and 26% and PFS of 36% and 8% are comparable with the reported data.18 This is supported by Ouwens et al22 who conclude that standard parametric methods underestimate long-term I-O OS data, where more research into mature OS data is needed to improve our understanding of the realism of OS projections. Here, it is important to recognise that, although assumptions were applied to transition from the conventional 3-state to the proposed 5-state PSM, it is the granularity in the data as seen in the BOR that can be useful in addition to the OS and PFS predictions, to assess if clinical benefit has been captured by respective modelling frameworks submitted as part of economic evaluations. The difference in QALYs generated by the two models was driven by the disaggregated utilities (lower utility for post-progression) in an attempt to map to the 5-state PSM and allow a distinction between non-responders and responders within the pre-progression and post-progression states. This differs from the conventional 3-state PSM where patients are grouped together making it less transparent to capture treatment response in the same health states. The cost-effectiveness ratios (although not the primary focus of this study) are consistent with previous analysis23 where the base case ICER for the Regimen relative to ipilimumab alone is within the lower bound of NICE’s reference range (£20,000 per QALY gained).
When considering the potential to generalise the approach presented here to other therapies and disease areas, both its theoretical aspects (the ability to represent I-O responses in a more meaningful way versus its potential for greater complexity) and empirical attributes need to be considered. As observed elsewhere,24 the decision to opt for a simpler or a more complex model “is an empirical issue, the answer to which is unknown without undertaking a more complex model”. As the I-O landscape develops, the need to capture response dynamics more accurately in the form of economic models is important to demonstrate the best clinical value in I-O treatments. Although increased granularity in model frameworks may better capture I-O, data to populate the models is not readily available from trial data. Survival analyses conducted to account for additional model aspects (in this case I-O response) affects the validity of estimates generated, with suitable/applicable model structures being dependent on clinical trial design.9
Model Validity
The purpose of the current research was not to derive a definitive model structure for application in I-O. Rather, the aim was to explore innovative model structures informed by guidance on structural design of models emphasizing patient heterogeneity, including heterogeneity in response, as a critical factor in model selection.24 Since each health state in a cohort model is assumed to contain a homogeneous group of patients, an approach to capturing heterogeneity is to increase the number of health states in the model. As discussed in an earlier paper on the same programme of research8 as that reported here, restricting treatment response to pre- and post-progression may lack sufficient granularity to capture the nuances of treatment responses observed in I-O. On theoretical grounds, therefore, a 5-state model potentially has advantages over the 3-state model in providing a more valid representation of the natural history of disease, treatments, and their effects.25
Empirically, the robustness of the model has been addressed by following good practice in the modelling of patient survival, the key driver of costs and QALYs, as captured by the Kaplan–Meier curves for OS and PFS from CheckMate 067, and in extrapolating beyond the trial period. This involved a systematic approach to selection of the most appropriate survival curve from a number of conventional and more flexible candidate functions.8 After being originally tested on data from the CheckMate 066 study with favourable results,7 the 5-state model was chosen as the preferred approach to estimate cost-effectiveness on the basis of CheckMate 067.
Initial cost-effectiveness estimates based on two-year trial data have been updated using four-year data and a revised approach to survival extrapolation adopted following the observation of extrapolated OS and PFS curves crossing.8 Model results show a good convergence with trial observations (Table 1) while extrapolated survival beyond the trial period has been validated against longer-term observations on ipilimumab in metastatic melanoma.11 The approach to costing was similar to that used in the manufacturer's submission to NICE technology appraisal TA400 and, as noted above, the results generated by the models reported here are broadly comparable with those obtained by the Evidence Review Group in NICE appraisal TA400.
Limitations
For the proposed 5-state PSM investigated, there are limitations associated with the approach to the mapping of clinical trial data on to health states using BOR, as uncertainty is introduced with additional health states and when applying appropriate cost and utility values. While using data from a single clinical trial has the advantage that it exploits a consistent set of data on response to treatment in addition to progression and survival, it assumes a close correspondence between recorded response and the notable features of disease dynamics under I-O. Further validation is needed to establish these links using measures which may not form a routine element of clinical trial reports while successful implementation of an increased set of health states relies on the availability of individual patient level data, thus limiting the applicability of the approach for HTA. Caution should also be applied when interpreting the results of this exploratory analysis bearing in mind that enabling increased discrimination in utilities has involved the use of different sources of evidence which might conflict for reasons unrelated to variation in the quality of life across health states. A rounded assessment should therefore be made, assessing the validity of a range of modelled outcomes, not simply QALYs.
Given that I-O disrupts the traditional model for drug development, specific challenges exist when considering and incorporating unique I-O endpoints into clinical trial designs. Preclinical development cannot mimic the human immune system representative of oncology patients. Uncertainty in toxicity and efficacy cannot therefore be anticipated accurately,1,4 raising the question of whether more information should be collected in I-O trials to support treatment benefits and help validate the ratio of non-responders to responders. A deeper understanding of the immune response under different forms of I-O therapy in different conditions could contribute to the design of approaches to data collection in clinical trials and overcome some of the limitations associated with the measures traditionally reported.
A further caveat is that the modelling approach presented here for the Regimen and monotherapy I-O agents may not be generalisable to other diseases or therapies such as chemotherapy/I-O or small molecule/I-O combinations. It does, however, represent a starting point for further exploration of methods to capture immune effects within the design of economic evaluations. As knowledge about the immune response in different settings continues to emerge, modelling approaches together with data requirements to support those approaches are likely to continue evolving.
Ethics and Consent Statement
The protocol and amendments for the CheckMate 067 trial were reviewed by the institutional review board at each trial site. The study’s Independent Data Monitoring Committee (DMC) was established to provide oversight on the safety and efficacy considerations and provide advice to the sponsor regarding actions the DMC deemed necessary for the continuing protection of subjects enrolled in the study. The trial was conducted in accordance with the provisions of the Declaration of Helsinki and with Good Clinical Practice guidelines as defined by the International Conference on Harmonisation. All the patients provided written informed consent before enrolment.
Acknowledgments
The authors would like to thank Michael Lees for initiating this research programme and providing valuable insight at all stages of the research. The authors are also grateful to Bill Malcolm, Helen Johnson and Srividya Kotapati of BMS for their valuable comments on earlier versions of the paper.
Funding
The study was funded by Bristol-Myers Squibb (BMS).
Disclosure
AJG, DT and YY were employed by BMS. EJG, IK, NB and CP were employed by Wickenstones Ltd, who were funded by BMS to undertake the research. GD, DL and PM have received consultancy fees and have been reimbursed for travel expenses to attend advisory board meetings related to this research. DL also reports grants, personal fees from Bristol-Myers Squibb, during the conduct of the study; grants from Pfizer, Abbvie, AstraZeneca, and Edwards Lifesciences, outside the submitted work. The authors report no other conflicts of interest in this work.
References
1. NICE. National Institute for Health and Care Excellence: proposals for increasing capacity within NICE’s technology appraisal [Internet]; 2017. Available from: https://www.nice.org.uk/Media/Default/About/what-we-do/our-programmes/technology-appraisals/increasing-ta-capacity-consultation.pdf.
2. Miller JD, Foley KA, Russell MW. Current challenges in health economic modeling of cancer therapies: a research inquiry. Am Health Drug Benefits. 2014;7:153–162.
3. Jönsson B, Wilking N. Cancer vaccines and immunotherapeutics: challenges for pricing, reimbursement and market access. Hum Vaccines Immunother. 2012;8:1360–1363. doi:10.4161/hv.21921
4. Champiat S, Dercle L, Ammari S, et al. Hyperprogressive disease is a new pattern of progression in cancer patients treated by anti-PD-1/PD-L1. Clin Cancer Res. 2017;23:1920–1928. doi:10.1158/1078-0432.CCR-16-1741
5. Wolchok JD, Hoos A, O’Day S, et al. Guidelines for the evaluation of immune therapy activity in solid tumors: immune-related response criteria. Clin Cancer Res. 2009;15:7412–7420. doi:10.1158/1078-0432.CCR-09-1624
6. Anagnostou V, Yarchoan M, Hansen AR, et al. Immuno-oncology trial endpoints: capturing clinically meaningful activity. Clin Cancer Res. 2017;23:951–959. doi:10.1158/1078-0432.CCR-16-3065
7. Gibson E, Koblbauer I, Begum N, et al. Modelling the survival outcomes of immuno-oncology drugs in economic evaluations: a systematic approach to data analysis and extrapolation. Pharmacoeconomics. 2017:1–14.
8. Gibson EJ, Begum N, Koblhauer I, et al. Modeling the economic outcomes of immuno- oncology drugs: alternative model frameworks to capture clinical outcomes. Clin Outcomes Res. 2018;10:139–154.
9. Chen -T-T. Statistical issues and challenges in immuno-oncology. J Immunother Cancer. 2013;1:18.
10. Gibson EJ, Begum N, Koblbauer I, et al. Cohort versus patient level simulation for the economic evaluation of single versus combination immuno-oncology therapies in metastatic melanoma. J Med Econ. 2019;22.
11. Schadendorf D, Hodi FS, Robert C, et al. Pooled analysis of long-term survival data from phase ii and phase iii trials of ipilimumab in unresectable or metastatic melanoma. J Clin Oncol. 2015;33(17):1–7.
12. NICE. Guide to the Methods of Technology Appraisal. Vol. 2013. London: National Institute for Health and Care Excellence; 2013.
13. Wolchok JD, Chiarion-Sileni V, Gonzalez R, et al. Overall survival with combined nivolumab and ipilimumab in advanced melanoma. N Engl J Med. 2017;377:1345–1356.
14. Guyot P, Ades AE, Ouwens MJNM, Welton NJ. Enhanced secondary analysis of survival data: reconstructing the data from published Kaplan-Meier survival curves. BMC Med Res Methodol. 2012;12.
15. Hodi FS, Chiarion-Sileni V, Gonzalez R, Grob -J-J, Rutkowski P, Cowey CL. Nivolumab plus ipilimumab or nivolumab alone versus ipilimumab alone in advanced melanoma (CheckMate 067): 4-year outcomes of a multicentre, randomised, Phase 3 trial. Lancet Oncol. 2018;19:P1480–1491. doi:10.1016/S1470-2045(18)30700-9
16. Larkin J, Chiarion-Sileni V, Gonzalez R, et al. Combined nivolumab and ipilimumab or monotherapy in untreated melanoma. N Engl J Med. 2015;373:23–34. doi:10.1056/NEJMoa1504030
17. Othus M, Bansal A, Koepl L, Wagner S, Ramsey S. Accounting for cured patients in cost-effectiveness analysis. Value Heal. 2017;20.
18. BMS. Nivolumab combined with ipilimumab or alone outperforms ipilimumab at 5 years in advanced melanoma [Internet]. ESMO2019; Nivolumab Combined with Ipilimumab or Alone Outperforms Ipilimumab at 5 Years in Advanced Melanoma.
19. Office for National Statistics. National life tables, United Kingdom (2015-17 life tables) [Internet]; 2018. Available from: https://www.ons.gov.uk/peoplepopulationandcommunity/birthsdeathsandmarriages/lifeexpectancies/datasets/nationallifetablesunitedkingdomreferencetables.
20. Beusterien KM, Szabo SM, Kotapati S, et al. Societal preference values for advanced melanoma health states in the United Kingdom and Australia. Br J Cancer. 2009;101:387–389.
21. Hodi FS, Chiarion-Sileni V, Gonzalez R, et al. Nivolumab plus ipilimumab or nivolumab alone versus ipilimumab alone in advanced melanoma (CheckMate 067): 4-year outcomes of a multicentre, randomised, phase 3 trial. Lancet Oncol. 2018;19:1480–1492. doi:10.1016/S1470-2045(18)30700-9
22. Ouwens MJNM, Mukhopadhyay P, Zhang Y, Huang M, Latimer N, Briggs A. Estimating lifetime benefits associated with immuno-oncology therapies: challenges and approaches for overall survival extrapolations. Pharmacoeconomics. 2019;37:1129–1138.
23. NICE. Final Appraisal Determination Nivolumab in Combination with Ipilimumab for Treating Advanced Melanoma. 2016:1–24
24. Barton P, Bryan S, Robinson S. Modelling in the economic evaluation of health care: selecting the appropriate approach. J Heal Serv Res Policy. 2004;9:110–118.
25. Brennan A, Chick SE, Davies R. A taxonomy of model structures for economic evaluation of health technologies. Health Econ. 2006;15:1295–1310. doi:10.1002/hec.1148
 © 2020 The Author(s). This work is published and licensed by Dove Medical Press Limited. The
full terms of this license are available at https://www.dovepress.com/terms
and incorporate the Creative Commons Attribution
- Non Commercial (unported, 3.0) License.
By accessing the work you hereby accept the Terms. Non-commercial uses of the work are permitted
without any further permission from Dove Medical Press Limited, provided the work is properly
attributed. For permission for commercial use of this work, please see paragraphs 4.2 and 5 of our Terms.
© 2020 The Author(s). This work is published and licensed by Dove Medical Press Limited. The
full terms of this license are available at https://www.dovepress.com/terms
and incorporate the Creative Commons Attribution
- Non Commercial (unported, 3.0) License.
By accessing the work you hereby accept the Terms. Non-commercial uses of the work are permitted
without any further permission from Dove Medical Press Limited, provided the work is properly
attributed. For permission for commercial use of this work, please see paragraphs 4.2 and 5 of our Terms.