Back to Journals » Psychology Research and Behavior Management » Volume 16
Economic Evaluation Alongside a Randomized Controlled Trial of Mindfulness-Based Cognitive Therapy in Healthy Adults
Authors Nagaoka M ![]() , Koreki A
, Koreki A ![]() , Kosugi T
, Kosugi T ![]() , Ninomiya A, Mimura M
, Ninomiya A, Mimura M ![]() , Sado M
, Sado M ![]()
Received 29 January 2023
Accepted for publication 9 July 2023
Published 20 July 2023 Volume 2023:16 Pages 2767—2785
DOI https://doi.org/10.2147/PRBM.S406347
Checked for plagiarism Yes
Review by Single anonymous peer review
Peer reviewer comments 2
Editor who approved publication: Dr Igor Elman
Maki Nagaoka,1,2 Akihiro Koreki,1– 3 Teppei Kosugi,4 Akira Ninomiya,1,2 Masaru Mimura,2,5 Mitsuhiro Sado1,2,6
1Department of Neuropsychiatry, Keio University School of Medicine, Shinjuku-ku, Japan; 2Mindfulness & Stress Research Center, Keio University, Shinjuku-ku, Japan; 3Department of Psychiatry, National Hospital Organization Shimofusa Psychiatric Medical Center, Chiba, Japan; 4Department of Psychiatry, Gunma Hospital, Takasaki, Japan; 5Keio University Centre for Preventive Medicine, Keio University, Shinjuku-ku, Japan; 6Keio University Health Center, Keio University, Yokohama City, Japan
Correspondence: Mitsuhiro Sado, Keio University Health Center, Keio University, 4-1-1 Hiyoshi, Kouhoku-ku, Yokohama City, Kanagawa, 223-8521, Japan, Tel +81-045-566-1055, Fax +81-045-566-1059, Email [email protected]
Purpose: This study aimed to conduct an economic evaluation of mindfulness-based cognitive therapy (MBCT) in healthy participants by performing cost-utility analysis (CUA) and cost-benefit analysis (CBA).
Patients and Methods: CUA was carried out from a healthcare sector perspective and CBA was from the employer’s perspective in parallel with a randomized controlled trial. Of the 90 healthy participants, 50 met the inclusion criteria and were randomized to the MBCT group (n = 25) or wait-list control group (n = 25). In the CUA, intervention costs and healthcare costs were included, while the mean difference in the change in quality-adjusted life years (QALYs) between the baseline and 16-week follow-up was used as an indicator of effect. Incremental cost-effectiveness ratio (ICER) was produced, and uncertainty was addressed using non-parametric bootstrapping with 5000 replications. In the CBA, the change in productivity losses was reflected as a benefit, while the costs included intervention and healthcare costs. The net monetary benefit was calculated, and uncertainty was handled with 5000 bootstrapping. Healthcare costs were measured with the self-report Health Service Use Inventory. The purchasing power parity in 2019 was used for currency conversion.
Results: In the CUA, incremental costs and QALYs were estimated at JPY 19,700 (USD 189) and 0.011, respectively. The ICER then became JPY 1,799,435 (USD 17,252). The probability of MBCT being cost-effective was 92.2% at the threshold of 30,000 UK pounds per QALY. The CBA revealed that MBCT resulted in increased costs (JPY 24,180) and improved work productivity (JPY 130,640), with a net monetary benefit of JPY 106,460 (USD 1021). The probability of the net monetary benefit being positive was 69.6%.
Conclusion: The results suggested that MBCT may be more cost-effective from a healthcare sector perspective and may be cost-beneficial from the employer’s perspective.
Keywords: mindfulness, healthy individuals, cost-effectiveness, MBCT
Introduction
The literature on well-being continues to grow with an increasing interest in the subject over time.1 The WHO defines health as “a state of complete physical, mental and social well-being and not merely the absence of disease or infirmity.”2 From this, it can be seen that health is an umbrella term for our physical and mental conditions and that well-being is an essential component of health. The relationship between health and well-being is bidirectional: health and well-being both affect one another. Higher levels of well-being are associated with better mental and physical health,3 improved immune system response, higher pain tolerance,4 faster recovery from disease,5,6 increased longevity, and decreased mortality.7–10 Therefore, improving and maintaining the public’s well-being is crucial for health promotion. It is widely acknowledged that evidence-based interventions should be implemented to promote public health. Mindfulness-based interventions (MBIs) are promising candidates for addressing this issue. The rationale is that several studies have confirmed that MBIs effectively alleviate stress and improve well-being in students,11–15 healthcare workers,16,17 and employees.18–24
Originating from ancient Buddhist teachings, mindfulness has evolved over the past few decades into a variety of secular forms targeting health-related outcomes in different settings, including clinical and non-clinical. Among these, the most structured and widely adopted MBIs are mindfulness-based stress reduction (MBSR) and MBCT.25,26 While MBSR has been shown to be moderately effective in reducing stress, anxiety, depression and distress as well as improving quality of life in healthy individuals,27 few studies have investigated the effectiveness of MBCT in these people. Since MBCT was originally developed to prevent relapse of depression, previous research has focused primarily on patients with depressive disorders.28–30 The costs arising from mental disorders are a significant burden on society and preventive interventions to improve public well-being are required. Cost-effectiveness is one of the major arguments in deciding whether to implement such interventions. The fact that all public health decisions involve resource incorporation makes it imperative to evaluate costs as well as effects based on economic assessments in order to make effective use of limited resources. A recent systematic review by Zhang found that MBCT achieved both cost-effectiveness and cost-savings in a variety of diseases including depression, multiple sclerosis, and cancer.31 However, no study that evaluated cost-effectiveness of MBCT in healthy people was included in his review. Health promotion, including enhancing well-being, is necessary even for those who are not ill. The economic assessment of MBCT in healthy individuals serves as an important guide for policymakers when making decisions about investing in preventive interventions and allocating scarce resources. In the current study, therefore, we conducted the cost-utility analysis (CUA) of MBCT in healthy participants because we determined that cost-effectiveness needed to be assessed in line with the standard methodology of health technology assessment, namely the CUA.
Additionally, we recognize that work productivity greatly concerns employers in the economic evaluation of interventions for healthy people. Efforts to boost employee mindfulness have grown rapidly within organizations over the past 10 years,23 and some research has shown that employees with high well-being perform well.32,33 Given that MBCT promotes well-being, it is reasonable to expect that MBCT has a positive impact on productivity. There is also a systematic review of empirical studies of mindfulness conducted in work settings that found mindfulness could potentially increase subjective well-being and job satisfaction, and also improve job performance.23 The authors noted, however, that the overall study quality was poor and that the study design was remarkably heterogeneous. Similar results were found in a meta-analysis which pooled data from 23 studies on workplace mindfulness, but were inconclusive when it comes to productivity.24 Moreover, the meta-analysis included only one MBCT trial, and all participants were pharmaceutical lab technicians. To clarify the effects of MBCT on the productivity of general workers, we conducted a cost-benefit analysis (CBA) using samples from all types of occupations. In summary, this study aimed to perform CEA and CBA in parallel with an eight-week mindfulness-based cognitive therapy (MBCT) and a two-month follow-up randomized controlled trial (RCT).
Methods
Economic evaluation was conducted under RCT by comparing the effectiveness of MBCT to the wait-list control group. The RCT of eight-week MBCT with a two-month follow-up period showed significant improvements in eudaimonic and cognitive aspects of well-being in healthy adults, in addition to improving positive affective aspects of well-being. The complete study design and procedures are described in the clinical trial registration system (ID: UMIN000031885; URL: https://center6.umin.ac.jp/cgi-open-bin/ctr_e/ctr_view.cgi?recptno=R000036376) and published paper.34
Setting and Location
In this wait-list-controlled parallel-group study, we recruited participants through the Mindfulness & Stress Research Center at Keio University. This study was conducted at Keio University Hospital, Tokyo, Japan.
Design
Full information about the study design and participants can be found elsewhere.34 We started recruiting participants in July 2018. Participants applied through a website and completed online questionnaires for the primary screening. Then, as the secondary screening, a psychiatrist or psychologist in the study group interviewed those who had passed the primary screening and determined whether they met the inclusion criteria using the Japanese version of the Structured Clinical Interview for DSM-IV Axis I Disorders.35 Eligible participants provided written informed consent after receiving a detailed description of the study procedures. The previous pilot study showed that the mean Satisfaction With Life Scale (SWLS) scores had a pre/post difference of 3.1 (SD = 3.4). Based on a power of 80% or greater and a significance level of 5% (two-sided), we estimated sample size and determined that 20 participants were needed for each group. Considering a 20% attrition rate, each group needed 25 participants, totaling 50.
Participants
The inclusion criteria were (1) healthy individuals between 20 and 65 years of age, (2) no history of mental illness in the past two years, and (3) a score of 24 or less on the Satisfaction With Life Scale (SWLS),36 indicating low to average subjective well-being. The exclusion criteria were (1) being likely to be difficult to follow up, (2) having previously participated in MBIs similar to this study, and (3) having a severe physical disease.
Randomization and Masking
Of the 90 participants assessed for eligibility, 50 met the inclusion criteria and were randomly allocated to the MBCT group (n = 25) or wait-list control group (n = 25). For randomization, we used a computer-generated random number system administered by the Keio Center of Clinical Research Project Management Office, independent of the present authors, and participants were stratified according to their baseline SWLS scores (≥20, ≤19). The control group was wait-listed to receive MBCT after the intervention period (16 weeks). During the randomization, group allocation was concealed from both researchers and participants. After randomization, the allocation was identified by either immediate or delayed participation in the intervention. Participants were assigned study IDs, separated from personal information, and securely stored in encrypted, anonymized form.
Intervention Group -MBCT
The MBCT was modeled after a guidebook written by Williams and Penman,37 though modified in part to focus on improving the well-being of non-clinical populations. The program is described in detail elsewhere.34 The program consisted of eight weekly 2-h group sessions. After completing the eight sessions, the MBCT group was offered monthly booster sessions over a 2-month follow-up period.
Wait-List Control Group
During the intervention period, for 16 weeks after randomization, no interventions were provided for the wait-list control group. Those in this group were instructed to abstain from participating in any other mindfulness or meditation practices during this time. At the end of the 16-week intervention period, they were offered the MBCT program.
Data Collection
Participants were assessed at four time points: baseline (before randomization), 4- and 8- week post-randomization, and at the 16-week follow-up (2 months after the end of the 8-week MBCT program).
Outcome Measures
Cost-utility analysis (CUA): The mean difference of the change in quality-adjusted life-years (QALYs) from baseline to 16 weeks was used as an indicator of effect. Normally, the calculation of QALYs is based on quality of life scores (utility values) obtained from patients who fill in a generic health-related quality of life (HRQoL) questionnaire. However, we estimated utility scores based on the ICEpop Capability Scale for Adults (ICECAP-A),38 a generic measure of adult capability that has been confirmed as valid and reliable.39,40 ICECAP(s) allow more extensive assessment of quality of life and well-being than the traditional health-related QOL measures like EuroQol 5D (EQ-5D).41 Because this study targeted healthy individuals, we judged that HRQoL measure such as EQ-5D was not suitable for measuring utility values due to the ceiling effect. Furthermore, the outcome of interest here was an improvement in well-being rather than health itself. Therefore, we determined that it is appropriate to use ICECAP instead of EQ-5D to estimate the QALYs. In fact, NICE recommends using capability measures, including ICECAP, in economic analyses where non-health effects are likely to occur.42 Since the ICECAP-A was not included in the original RCT, we used a conversion formula to predict utility scores on the ICECAP-A from scores on the following well-being scales: the Satisfaction with Life Scale (SWLS),36 Flourishing Scale (FS),43 and the Scale of Positive and Negative Experience (SPANE).44 The conversion technique from clinical measures into preference-based measures including EQ-5D and ICECAP-A is called “mapping” and is often used to generate utility values in economic assessments. For example, one study that developed and evaluated mapping formulae using data from patients with substance use disorders showed that both EQ-5D and ICECAP-A could be predicted from commonly used clinical measures, although ICECAP-A had better predictive accuracy.45 Considering the correlation between well-being and capability, it would be reasonable to convert the clinical well-being scales to the ICECAP-A. The conversion formula is shown below, the details of which have been published elsewhere.46

Next, utility scores converted from measures of subjective well-being were used to calculate QALY gains. The area under the curve method was employed for this calculation. The incremental cost-effectiveness ratio (ICER), which is the incremental costs divided by the incremental effectiveness, was computed, and uncertainty was addressed using scatter plots and cost-effectiveness acceptability curves (CEACs). Scatter plots and CEACs were produced with incremental costs and QALYs generated from bootstrapped resamples.
Cost-benefit analysis (CBA): Productivity losses (overall change in productivity) were used as an indicator of benefit. Details of how to assess productivity losses are described in the cost paragraph.
Cost
In both CUA and CBA, costs included intervention costs and healthcare costs.
Intervention Costs
Intervention costs were calculated based on the number of sessions attended and the unit cost of MBCT. The unit cost of MBCT was set at 2700 yen per session per participant, according to the reimbursement of medical fees.
Healthcare Costs
Healthcare costs comprised all incurred costs for outpatient visits, medications, and medical examinations and were measured with the self-report Health Service Use Inventory at baseline (for the past month), and 4-, 8-week, and 16-week follow-up (covering the period since the previous interview). These costs are covered by the National Health Insurance. The unit costs for outpatient visits of JPY 1510 and medical examinations were derived from government-regulated prices.47,48 Medication costs per participant were calculated using the unit prices listed in the drug price standard determined by the Pharmaceuticals and Medical Devices Agency.49 Over-the-counter medicines were not included here.
Productivity Losses
Productivity losses at paid work stemming from absenteeism and presenteeism were assessed using the relevant question items of the World Health Organization Health and Work Performance Questionnaire (WHO-HPQ).50 Absenteeism refers to the absence of an employee from work due to illness or disability, while presenteeism refers to the loss of productivity due to illness or other medical conditions of an employee who is present but not fully functioning.50,51 The following B3, B4, and B6 questions were relevant to absenteeism, while B9 and B11 were about presenteeism.
B3. About how many hours altogether did you work in the past 7 days?
B4. How many hours does your employer expect you to work in a typical 7-day week?
B6. About how many hours altogether did you work in the past 4 weeks (28 days)?
B9. On a scale from 0 to 10, where 0 is the worst job performance anyone could have at your job and 10 is the performance of a top worker, how would you rate the usual performance of most workers in a job similar to yours?
B11. Using the same 0-to-10 scale, how would you rate your overall job performance on the days you worked during the past 4 weeks (28 days)?
Absolute absenteeism: 4xB4 – 4xB3
Relative absenteeism: (4xB4 – 4xB3)/4xB4
Relative hours of work: B3/B4
Absolute presenteeism: 10xB11
Relative presenteeism: B11/B9
Presenteeism costs were calculated using the following formula:

The overall costs stemming from absenteeism and presenteeism were calculated by the formula:

Relative hours of work were calculated using the formula of actual worked hours in the past four weeks divided by expected hours of work in four weeks. The average wage was calculated based on 2019 data from e-stat (www.e-stat.go.jp), a portal site for Japanese government statistics, and adjusted by gender and age category for each participant.
Economic Evaluation
The time frame for economic evaluations was from baseline to 16-week follow-up.
Cost-Utility Analysis
Cost–utility analysis (CUA), a form of cost-effectiveness analysis, in which the incremental cost of an intervention is compared to the incremental health improvement expressed in the unit of QALYs, was conducted. We imputed the missing data on costs and QALYs for both group using LOCF (Last Observation Carried Forward).
Costs
In the base case CUA, costs were generated by combining intervention costs with healthcare costs.
Cost-Benefit Analysis
We performed a cost-benefit analysis (CBA) to assess the balance of costs and benefits from productivity improvements. This analysis was conducted from an employer’s perspective. Participants who were working throughout the study period were included in the CBA.
Costs
Costs were generated using the same method as in the base case of CUA, that is by combining intervention costs with healthcare costs.
Sensitivity Analysis
To assess the robustness of the results, we conducted two types of sensitivity analyses by changing the intervention costs and by excluding healthcare costs in both CUA (sensitivity analyses 1 and 2) and CBA (sensitivity analyses 3 and 4). In sensitivity analyses 1 and 3, intervention costs were computed by multiplying the total number of sessions by labor costs for instructors (JPY 15,000 per instructor) and dividing by the number of participants included in the analysis. These costs were added to the healthcare costs. Sensitivity analyses 2 and 4 were conducted without including healthcare costs.
Statistical Analysis
Both CUA and CBA were conducted using R statistical software, version 4.1.2. CUA was carried out with imputation for the missing data on costs and QALYs using LOCF. The cost-effectiveness of the intervention was evaluated using the ICER, and the net monetary benefit (NMB) was used for the cost-benefit evaluation. NMB is defined as (ΔE) × λ−ΔC (where ΔE is the incremental outcome associated with the intervention, ΔC is the incremental cost, and λ is the WTP (willingness to pay) per unit of outcome gain)). ICER was calculated as the between-group cost difference divided by the between-group effect difference. While the National Institute for Health and Clinical Excellence (NICE) has set a cost-effectiveness threshold in the range of 20,000 and 30,000 UK pounds (£),52 several recent studies have suggested different thresholds of £33,500 and £66,597.53,54 Accordingly, we adopted multiple thresholds of £30,000, £33,500, and £66,000. The costs in JPY were converted into USD and UK pounds based on the purchasing power parity in 2019,55 the year of trial completion: 1 USD was equal to 104.306 JPY and 0.688 UK pounds. To account for the non-normal distribution of the cost data, the mean, mean differences, and 95% confidence intervals (CI) were obtained by nonparametric bootstrapping with 5000 replications.
Results
Participants
Table 1 presents the baseline demographic and clinical characteristics. The average age was 46.8 ± 8.7 years, and 78.0% were women. No significant differences were observed between the groups with respect to the sociodemographic status. As for clinical measures, there were no significant differences, with the exception of SPANE-P and SPANE-B scores.
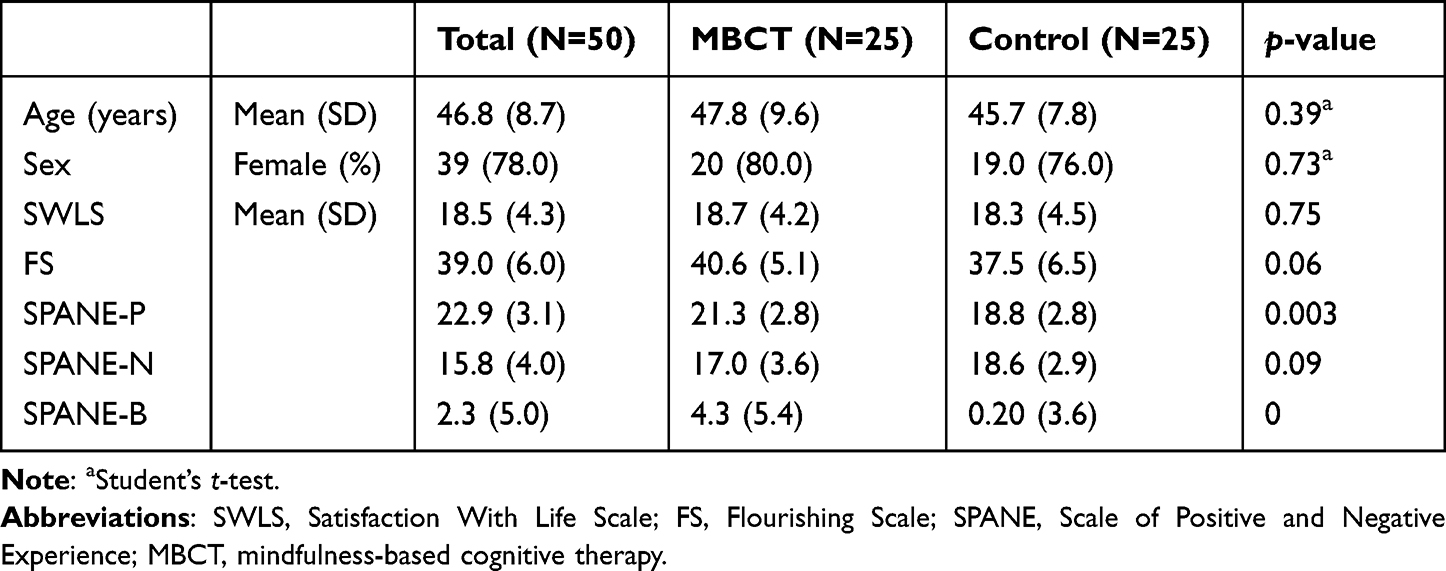 |
Table 1 Baseline Demographic and Clinical Characteristics |
Healthcare Cost
Table 2 summarizes the mean number of outpatient visits and mean healthcare costs. The groups did not differ significantly in terms of healthcare costs. In the intervention group, the total healthcare costs per participant on average were JPY 1587 at baseline and JPY 2530 at the 16-week follow-up. The costs in the wait-list control group were JPY 2940 and JPY 3540 at baseline and 16-weeks respectively.
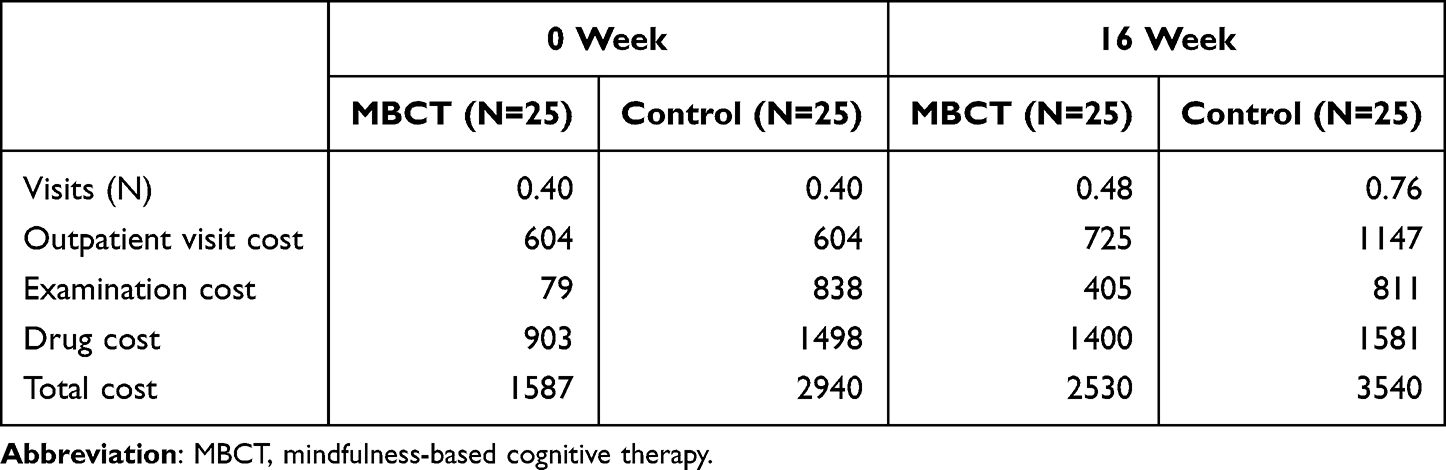 |
Table 2 Mean Number of Outpatient Visits and the Mean Healthcare Costs |
Cost-Utility results
Base Case Analyses
The results of the base-case CUA (n=50) are shown in Table 3. MBCT cost JPY 19,700 (USD 189) more than the wait-list control group and was associated with a significant QALY gain of 0.011 (5000 bootstrapped 95% CI 0.001 to 0.021). The ICER was positive (JPY 1,799,435). The uncertainty around the ICER is presented as a scatter plot (Figure 1). Each point on the scatter plots represents a pair of incremental costs and QALYs from 5000 bootstrapped samples. Figure 1 shows that the majority of bootstrapped ICER were located in the northeast quadrant, suggesting that in terms of cost-utility, MBCT was likely to be costlier and generate more QALYs compared to the wait-list control group. At the WTP ceilings of £30,000 (JPY 4,548,227) per QALY, the probability of the MBCT being cost-effective was 92.2% (Figure 2). At the WTP of £33,500 (JPY5,078,853) and £66,000 (JPY 10,006,099), the probability of MBCT being cost-effective was 93.5% and 97.0%, respectively.
 |
Table 3 Base Case Cost-Utility Analyses |
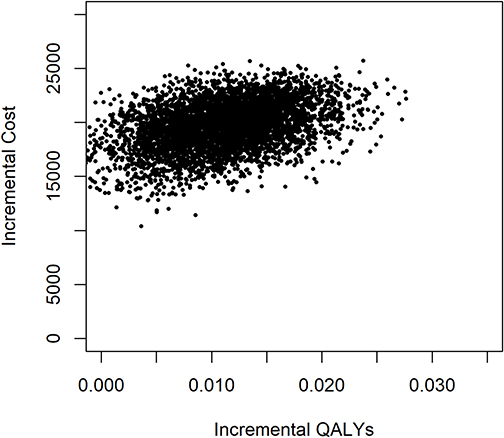 |
Figure 1 Scatter plots of base case cost-utility analyses. |
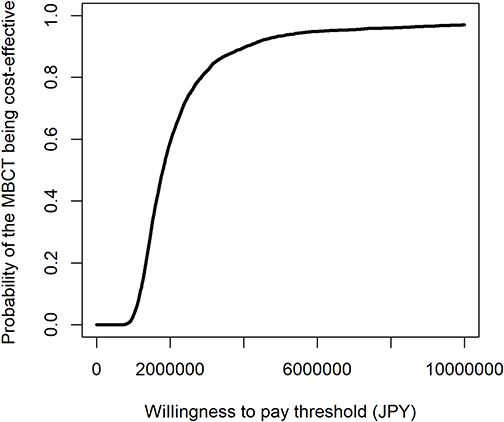 |
Figure 2 Acceptability curves of base case cost-utility analyses. |
Sensitivity Analyses
Sensitivity analyses 1 (n=50) had roughly similar results to the base case analyses (Table 4). MBCT cost JPY 19,983 (USD 192) more than the wait-list control and was associated with a significant QALY gain of 0.011 (5000 bootstrapped 95% CI 0.001 to 0.021). The ICER was positive (JPY 1,865,052).
 |
Table 4 Sensitivity Analyses 1 |
The majority of bootstrapped ICER were located in the northeast quadrant (Figure 3). The probability of MBCT being cost-effective compared with the wait-list control at WTP thresholds of £30,000 (JPY 4,548,227) was 90.1% (Figure 4). At the WTP of £33,500 (JPY5,078,853) and £66,000 (JPY 10,006,099), the probability of MBCT being cost-effective was 91.4% and 95.9%, respectively.
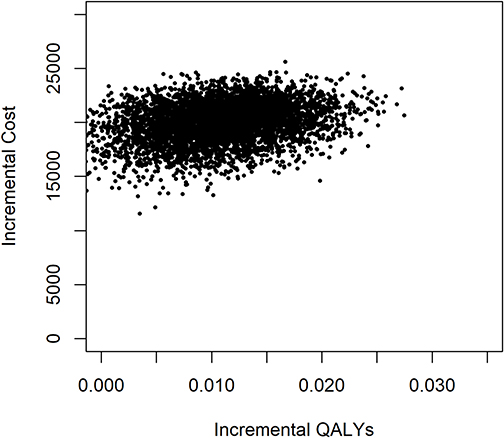 |
Figure 3 Scatter plots of cost-utility sensitivity analyses 1. |
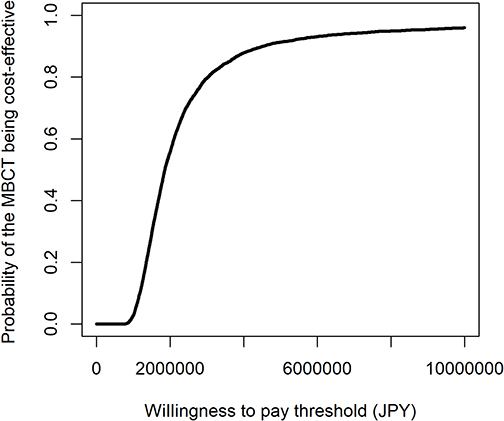 |
Figure 4 Acceptability curves of cost-utility sensitivity analyses 1. |
The results of the sensitivity analyses 2 (n=50) are shown in Table 5. MBCT cost JPY 23,660 (USD 227) more than the wait-list control and was associated with a significant QALY gain of 0.011 (5000 bootstrapped 95% CI 0.001 to 0.021). The ICER was positive (JPY 2,203,457).
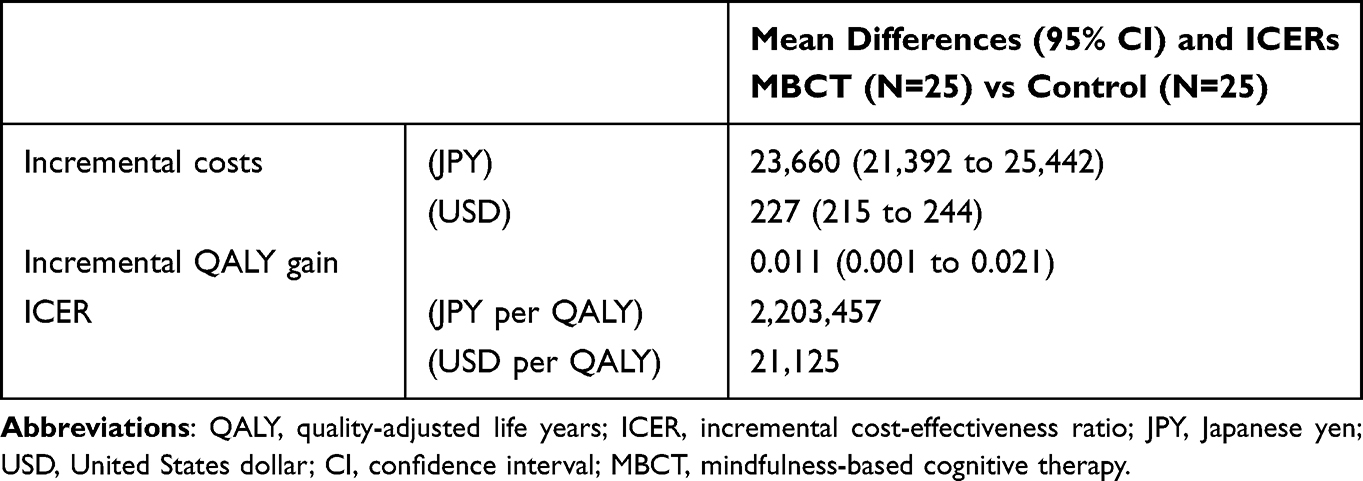 |
Table 5 Sensitivity Analyses 2 |
The majority of bootstrapped ICER were located in the northeast quadrant (Figure 5). The probability of MBCT being cost-effective compared with the wait-list control at £30,000 (JPY 4,548,227) WTP thresholds was 86.9% (Figure 6). At the WTP of £33,500 (JPY5,078,853) and £66,000 (JPY 10,006,099), the probability of MBCT being cost-effective was 89.2% and 95.5%, respectively.
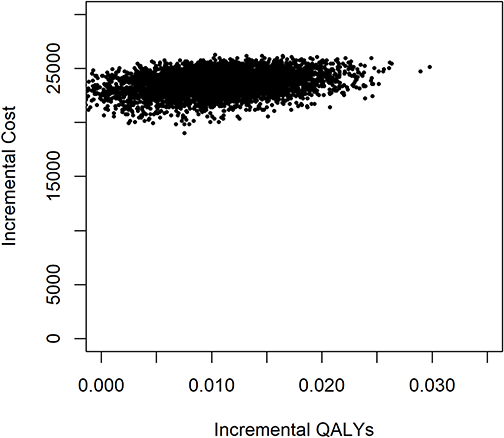 |
Figure 5 Scatter plots of cost-utility sensitivity analyses 2. |
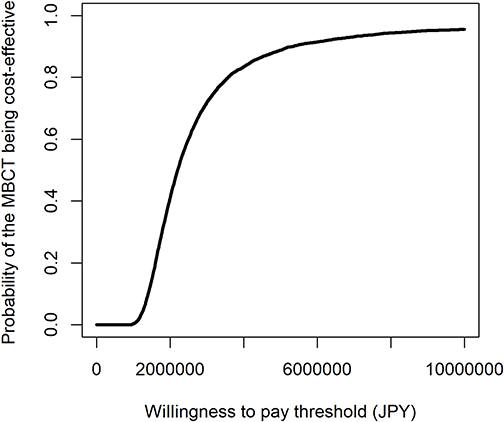 |
Figure 6 Acceptability curves of cost-utility sensitivity analyses 2. |
Cost-Benefit Results
Productivity
Higher absenteeism scores indicate higher levels of absenteeism. As shown in Table 6, at baseline and the 16-week follow-up, both absolute and relative absenteeism scores for MBCT were higher than those of the wait-list control, which implied that MBCT had a higher amount of absenteeism. Unlike absenteeism, higher presenteeism scores indicate lower loss of performance.
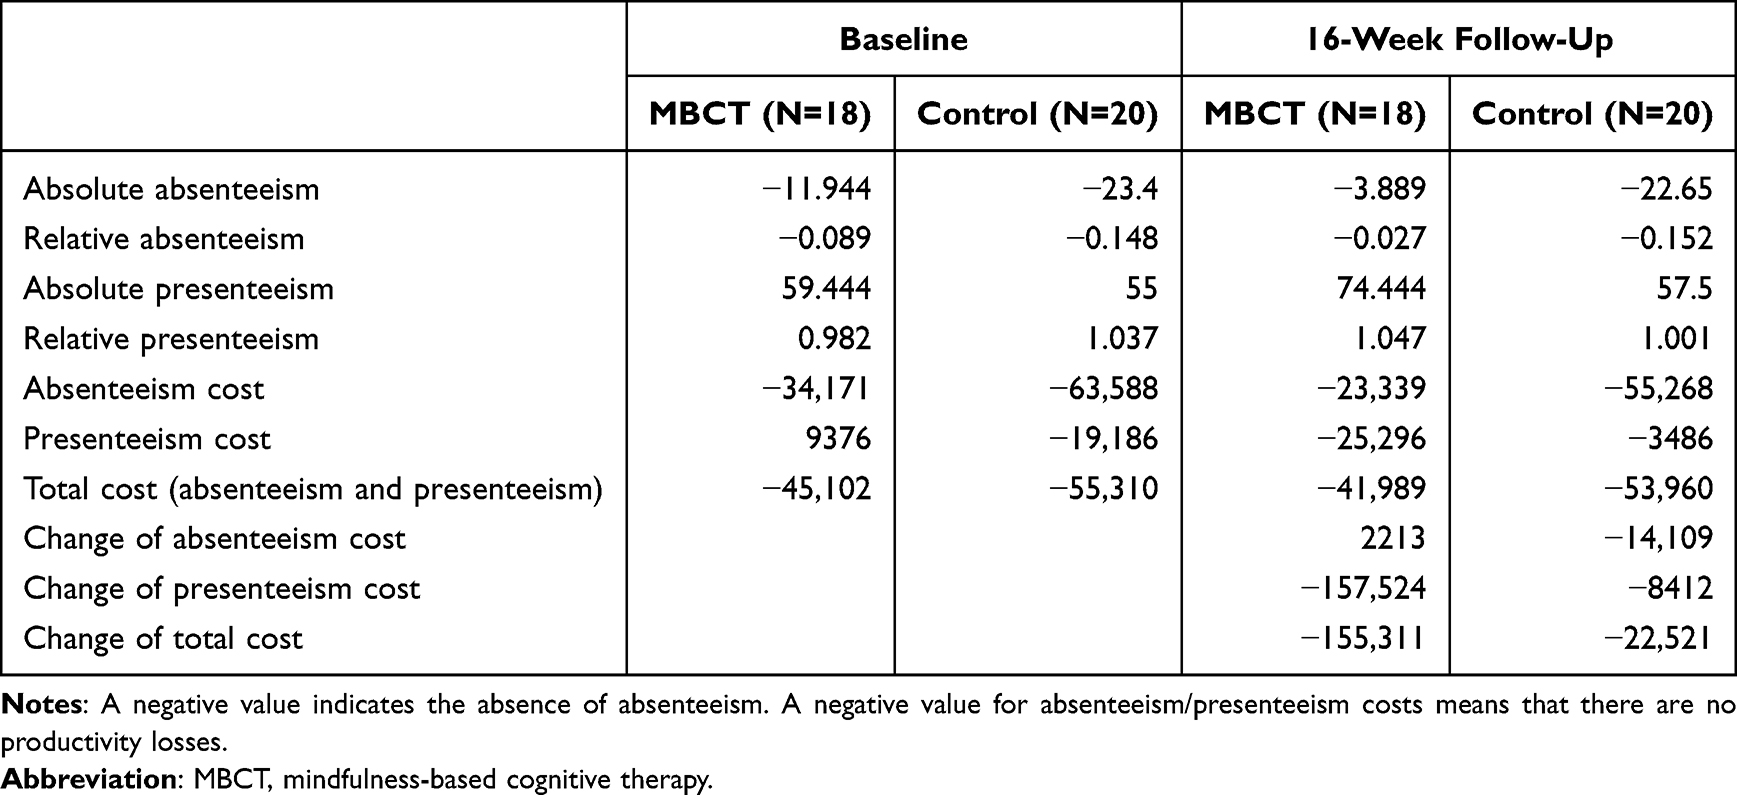 |
Table 6 Mean of Absenteeism, Presenteeism, and Productivity Losses |
In terms of absolute presenteeism, the score for MBCT at both baseline and the 16-week follow-up was higher than that of the wait-list control, which meant that MBCT had a lower amount of lost performance. Regarding relative presenteeism (the ratio of actual performance to the performance of most workers in the same job), the score for MBCT was lower than that of the wait-list control group at baseline and was slightly higher at the 16-week follow-up. Regarding the costs of absenteeism and presenteeism, higher costs indicated lower productivity, and these costs did not differ significantly between groups at any time point. The change in absenteeism costs was JPY 2213 and JPY 14,109 for MBCT and the wait-list control group respectively; the change in presenteeism costs for MBCT and the wait-list control group were JPY −157,524 and JPY −8412, respectively. Although neither the change in absenteeism nor presenteeism costs were statistically different, improvements were greater for the MBCT group than for the wait-list control group in terms of the change in presenteeism costs. Viewed from the change in absenteeism costs, improvements were greater for the wait-list control group than for the MBCT group.
Base Case Analyses
Table 7 summarizes the base-case CBA results, including participants who worked throughout the study period (n = 38). MBCT cost JPY 24,180 (USD 232) more than the wait-list control and was associated with a productivity gain of 130,640 (5000 bootstrapped 95% CI −243,915 to 542,952). The net monetary benefit was positive (JPY 106,460) per participant because of productivity gains.
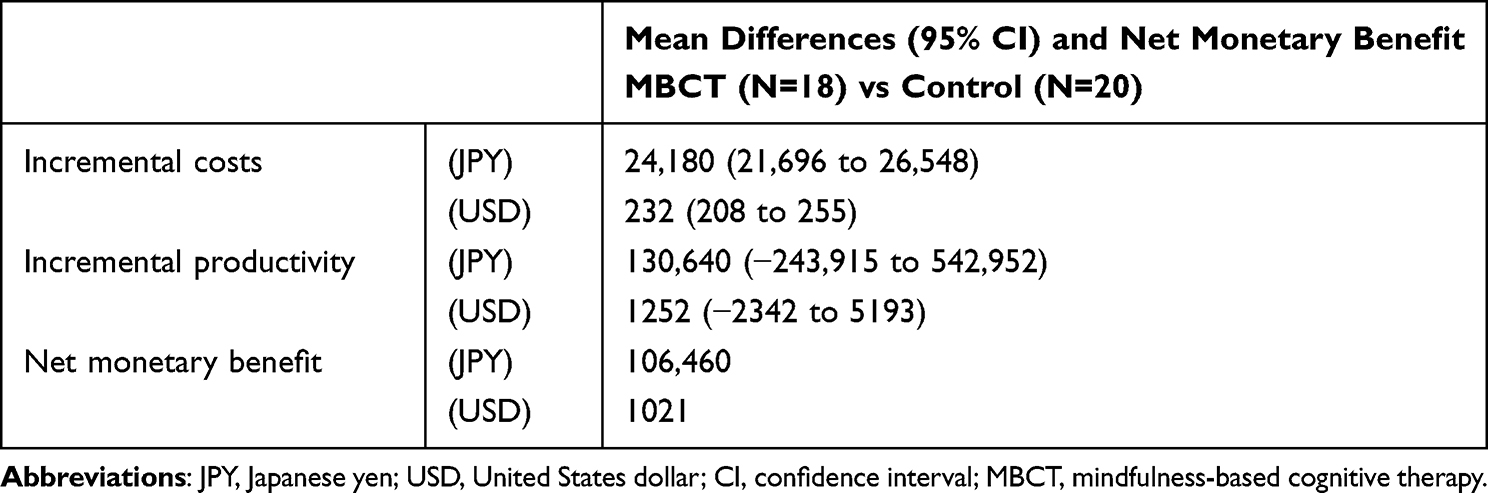 |
Table 7 Base Case Cost-Benefit Analyses |
The uncertainty in the net monetary benefit is shown in Figure 7. The bootstrapped results show that 73.8% of the cost-benefit pairs fell in the northeast quadrant, indicating that on a cost-benefit basis, MBCT is likely to result in higher costs and produce more productivity gains compared to the wait-list control group. 26.2% of the cost-benefit pairs are located in the northwest quadrant, where MBCT is costlier and produces lower productivity gains. The cost-benefit acceptability curve in Figure 8 shows that the probability of net monetary benefit being positive was 69.6%, meaning that the lower the values placed on work productivity gains, the more cost-beneficial MBCT is likely to be, and vice versa.
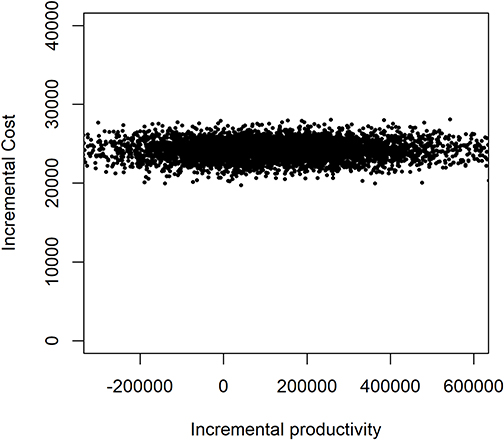 |
Figure 7 Scatter plots of base case cost-benefit analyses. |
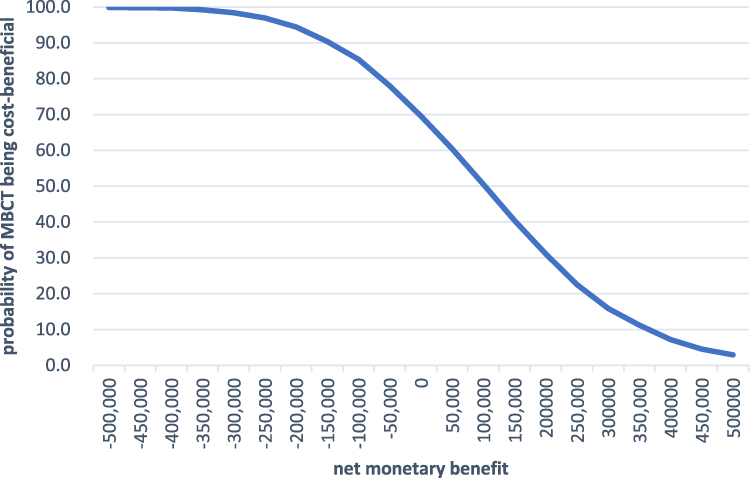 |
Figure 8 Acceptability curves of base case cost-benefit analyses. |
Sensitivity Analyses
Sensitivity analyses 3 (n=38) had roughly similar results to those of the base case CBA. As can be seen in Table 8, MBCT cost JPY 29,191 (USD 280) more than the wait-list control group and was associated with a productivity gain of 132,683. The net monetary benefit was positive (JPY 103,492).
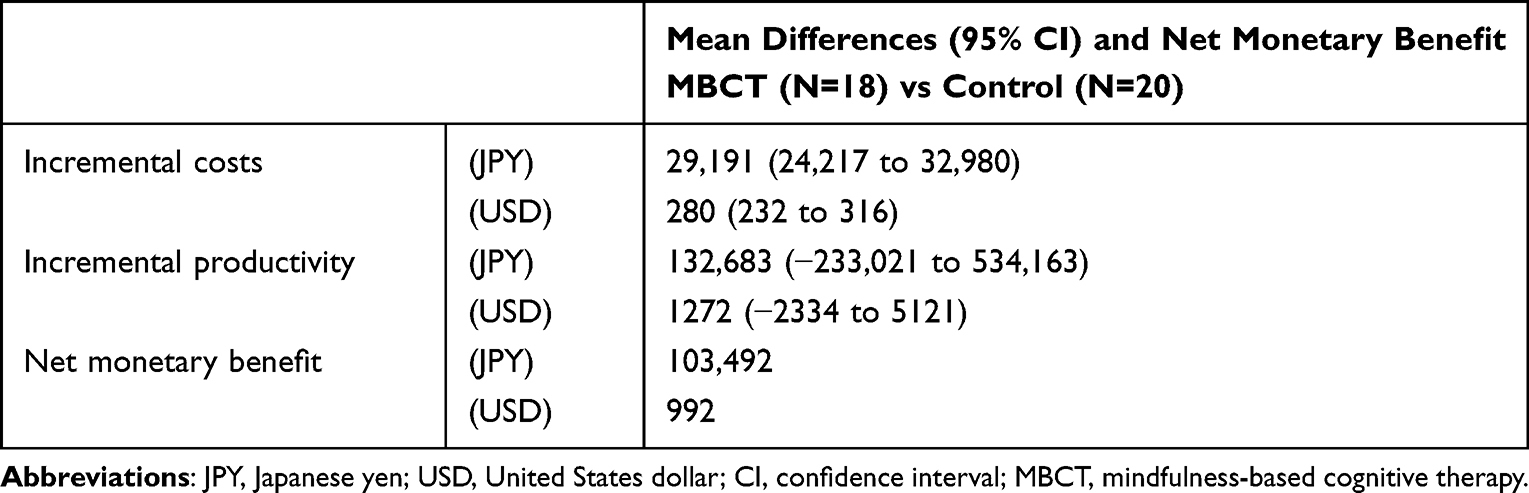 |
Table 8 Sensitivity Analyses 3 |
The bootstrapped results (Figure 9) show that 73.7% of the cost-benefit pairs fell in the northeast quadrant, indicating that on a cost-benefit basis, MBCT is likely to result in higher costs and produce more productivity gains compared to the wait-list control group. Of these, 26.3% are located in the northwest quadrant, where MBCT is costlier and produces lower productivity gains. The cost-benefit acceptability curve (Figure 10) demonstrates that the probability of net monetary benefit being positive was 68.8%.
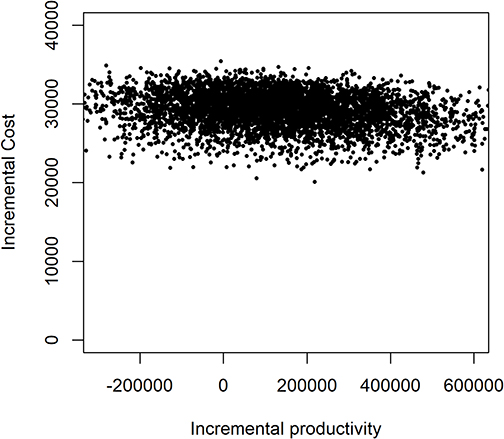 |
Figure 9 Scatter plots of cost-benefit sensitivity analyses 3. |
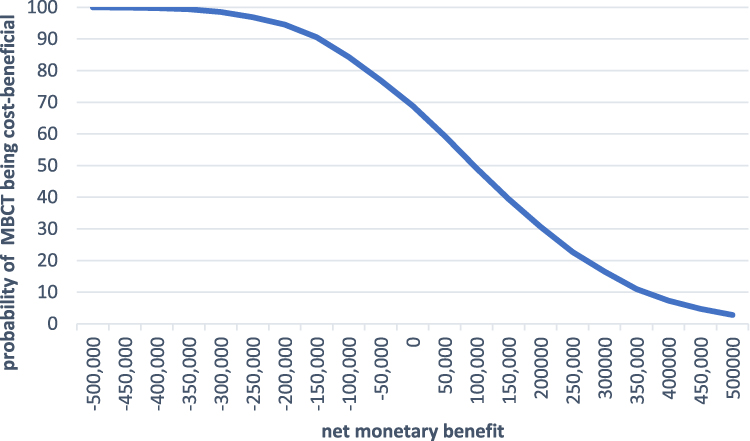 |
Figure 10 Acceptability curves of cost-benefit sensitivity analyses 3. |
The results of the sensitivity analyses 4 (n=38) are shown in Table 9. MBCT cost JPY 24,180 (USD 232) more than the wait-list control group and was associated with a productivity gain of 130,640. The net monetary benefit was positive (JPY 106,460). The bootstrapped results (Figure 11) show that 73.8% of the cost-benefit pairs fell in the northeast quadrant, indicating that on a cost-benefit basis, MBCT is likely to result in higher costs and produce more productivity gains compared to the wait-list control group. The probability of net monetary benefit being positive was 69.6% (Figure 12).
 |
Table 9 Sensitivity Analyses 4 |
 |
Figure 11 Scatter plots of cost-benefit sensitivity analyses 4. |
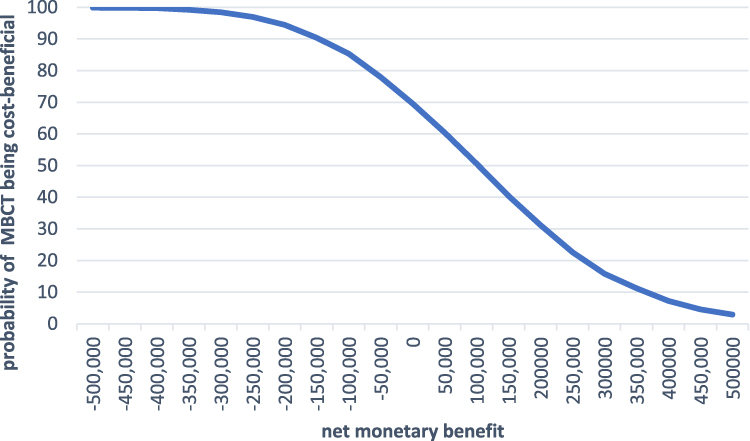 |
Figure 12 Acceptability curves of cost-benefit sensitivity analyses 4. |
Discussion
Overall Findings and Related Literature
This study explored, for the first time, the cost-effectiveness of MBCT in healthy participants. The results of the CUA found that MBCT increased well-being, with a mean ICER of JPY 1,799,435 (USD 17,252). The probability of MBCT being cost effective was 92.2% at £30,000 per QALY gain.
These results indicate the superiority of MBCT over no treatment condition in terms of cost-effectiveness compared with the conventional ICER threshold based on the EQ-5D. With respect to the ICER threshold based on the ICECAP, however, it should be recognized that there is currently no guidance on the criteria by which an intervention is considered cost-effective.56 With that being said, some findings have been accumulated to date. One study,53 which used a deliberative approach to elicit a monetary threshold for an additional year of sufficient capability, indicated that the value with majority support at the workshop was £33,500; however, for a year of full capability, no agreement could be reached on a single value, ranging from £33,500 to £36,150, which was half as large as the value of £66,597 drawn by Himmler et al54 As such, while there remains a certain range in the threshold, this study results appeared to be cost-effective compared to this threshold range of £33,500–66,597. These results from previous studies support the robustness of our study results.
The CBA indicated that MBCT was associated with increased productivity, with an average net monetary benefit of JPY 106,460 (USD 1021) per participant. The probability of the net monetary benefit being positive was 69.6%, suggesting a moderate to high probability of a positive economic benefit for the employer. These results were primarily due to improvements in presenteeism, which is consistent with a previous study suggesting that MBCT improved presenteeism.34 However, owing to the very wide confidence intervals for incremental productivity (−243,915 to 542,952), including zero, this result lacked statistical significance at the 95% level.
Because no other cost-benefit analysis of MBCT has been found, we should refer to the results of other types of interventions. Thiart et al reported that Internet-based cognitive behavioral therapy for schoolteachers with symptoms of insomnia yielded a net monetary benefit of 418 euros (USD 512), with a 66% probability of positive economic return.57 Another CBA of workplace intervention aimed at reducing sitting time showed a net benefit of £1770.32 per employee.58 Although caution should be paid considering the different interventions and target populations from our study, the results of this study showed that MBCT was favorable or equivalent to these references. However, as mentioned earlier, our study did not have sufficient statistical power to detect differences between groups due to the small sample size. Further studies are needed to confirm the robustness of the results.
Strengths
The current study, to the best of our knowledge, is the first economic evaluation of MBCT in healthy individuals. To date, few economic evaluations have scrutinized the effects of MBCT on well-being, and no study has been conducted on healthy participants. This study, with its focus on the well-being of healthy people, makes an important contribution to the field of public health. The second strength concerns the evaluation of work productivity based on a cost-benefit analysis, the results of which would help employers in deciding to implement programs such as MBCT. As costs incurred by presenteeism are much greater than those incurred by absenteeism,59–61 it is crucial to consider presenteeism when assessing labor productivity. With that in mind, we incorporated not only absenteeism but also presenteeism to evaluate work productivity. van Dongen et al showed that mindfulness-based workplace interventions were neither cost-saving nor cost-effective.20 This is different from the results presented here. Given that the study by van Dongen et al used a non-standard form of MBIs and that the participants were all employees of governmental research institutes, it is likely that these discrepancies are related to differences in the format of the intervention and the people studied. In contrast, we provided MBCT, the standard form of MBIs, and the participants in our study included people employed in various industries. Therefore, the results of our study may be more reliable and generalizable.
Limitations
The study had a few limitations. First, the small sample size was a concern. Because only 50 participants were included in the CUA, and 38 in the CBA, the current study was underpowered and inconclusive to detect statistical significance. Second, the ICECAP utility scores presented here were estimated using a conversion formula since no Japanese version of ICECAP existed at the time this study was conducted. If data directly obtained from the study participants were available, the results could have been different. Now that the Japanese version is available, we would like to use it in the future to verify the cost-effectiveness of MBCT. Additionally, because there was no “tariff” for Japanese at the moment, we had to use the UK “tariff” when converting, which might have caused some discrepancies. Therefore, Japanese tariff needs to be developed urgently. Third, the participants were healthy individuals with low to average subjective well-being. Since the participants in our study were not necessarily representative of the general population, it is undeniable that the results were distorted to a specific degree. It would be advisable to include participants with different levels of well-being and scrutinize how their well-being affects cost-effectiveness in order to resolve that distortion. Fourth, research on health promotion requires longer follow-up periods to fully understand the consequences of an intervention’s effects. Although the present study included only 16 weeks of follow-up, at least several years of follow-up would be needed to provide more rigorous information.
Implications for Future Research
First, researchers conducting economic evaluations should consider whether health or well-being should be prioritized in the same study. It is important for researchers to balance health and well-being in health evaluations, particularly when evaluating interventions in the general population. The ICECAP measures a related but distinct concept compared to generic health questionnaires.62 As such, using both the ICECAP and health-related QOL questionnaires are recommended for future research. Second, in a health economic assessment, the coverage of costs to consider depends on the perspective of the analysis. In this study, the CUA was conducted from a healthcare sector perspective and CBA was from an employer’s perspective, while we recognize that analysis from a wider societal perspective is also required. Future studies are expected to evaluate from different perspectives, including different costs, to provide more detailed information. Third, the current study is limited by the small sample. Further studies with larger sample sizes are needed to draw a firm conclusion.
Conclusion
In conclusion, the CUA in both base case and sensitivity analyses, demonstrated that MBCT resulted in increased well-being, and the cost per QALY was lower than the threshold of £30,000 (JPY 4,548,227). From the healthcare sector perspective, the results suggest that MBCT is cost-effective. The CBA revealed that MBCT resulted in increased costs and improved work productivity, with a positive net monetary benefit. From the employer’s perspective, although it depends on how much value is placed on work productivity gains, it is probable that MBCT is cost-beneficial. Despite limitations such as small sample sizes and new measures of QALY, these results will provide some insights for policymakers and employers to determine whether interventions should be introduced to improve public health and employee productivity.
Abbreviations
MBCT, mindfulness-based cognitive therapy; CUA, cost-utility analysis; QALYs, quality-adjusted life years; ICER, incremental cost-effectiveness ratio; CBA, cost-benefit analysis; MBIs, mindfulness-based interventions; RCT, randomized controlled trial; SWLS, Satisfaction with Life Scale; HRQoL, health-related quality of life; ICECAP-A, the ICEpop CAPability measure for Adults; FS: Flourishing Scale; SPANE, Scale of Positive and Negative Experience; CEACs, cost-effectiveness acceptability curves; WHO-HPQ, World Health Organization Health and Work Performance Questionnaire; LOCF, Last Observation Carried Forward; NMB, net monetary benefit; NICE, the National Institute for Health and Clinical Excellence; CI, confidence interval; EQ-5D, EuroQol-5D.
Data Sharing Statement
The data analyzed in this study are available from the corresponding author upon reasonable request.
Ethics Approval and Informed Consent
This study was approved by the Ethics Review Committee of the Keio University School of Medicine, and all methods complied with the Declaration of Helsinki. Informed consent was obtained from all study participants.
Funding
This research received no specific grant from any funding agency, commercial or not-for-profit sectors.
Disclosure
Prof. Dr. Masaru Mimura reports grants and/or personal fees from Biogen Japan, Bayer Pharmaceutical, Daiichi Sankyo, Dainippon-Sumitomo Pharma, Demant Japan, Eisai, Eli Lilly, Fuji Film RI Pharma, Hisamitsu Pharmaceutical, H.U. Frontier, Janssen Pharmaceutical, Mochida Pharmaceutical, MSD, Mylan EPD, Nippon Chemipher, Novartis Pharma, Ono Yakuhin, Otsuka Pharmaceutical, Pfizer, Shionogi, Takeda Yakuhin, Teijin Pharma, Viatris, Fronteo, Tanabe Mitsubishi, and Tsumura, outside the submitted work. The authors report no other conflicts of interest in this work.
References
1. Diener E, Heintzelman SJ, Kushlev K, et al. Findings all psychologists should know from the new science on subjective well-being. Can Psychol. 2017;58(2):87–104. doi:10.1037/cap0000063
2. World Health Organization. Constitution of the World Health Organization. Am J Public Health Nations Health. 1946;36(11):1315–1323. doi:10.2105/ajph.36.11.1315
3. Dolan P, Peasgood T, White M. Do we really know what makes us happy? A review of the economic literature on the factors associated with subjective well-being. J Econ Psychol. 2008;29(1):94–122. doi:10.1016/j.joep.2007.09.001
4. Howell RT, Kern ML, Lyubomirsky S. Health benefits: meta-analytically determining the impact of well-being on objective health outcomes. Health Psychol Rev. 2007;1(1):83–136. doi:10.1080/17437190701492486
5. Lamers SMA, Bolier L, Westerhof GJ, Smit F, Bohlmeijer ET. The impact of emotional well-being on long-term recovery and survival in physical illness: a meta-analysis. J Behav Med. 2012;35(5):538–547. doi:10.1007/s10865-011-9379-8
6. Chida Y, Steptoe A. Positive psychological well-being and mortality: a quantitative review of prospective observational studies. Psychosom Med. 2008;70(7):741–756. doi:10.1097/PSY.0b013e31818105ba
7. Diener E, Chan MY. Happy people live longer: subjective well-being contributes to health and longevity. Appl Psychol Health Well-Being. 2011;3(1):1–43. doi:10.1111/J.1758-0854.2010.01045.X
8. Wiest M, Schüz B, Webster N, Wurm S. Subjective well-being and mortality revisited: differential effects of cognitive and emotional facets of well-being on mortality. Health Psychol. 2011;30(6):728–735. doi:10.1037/a0023839
9. Steptoe A, Deaton A, Stone AA. Subjective wellbeing, health, and ageing. Lancet. 2015;385(9968):640–648. doi:10.1016/S0140-6736(13)61489-0
10. Martín-María N, Miret M, Caballero FF, et al. The impact of subjective well-being on mortality: a meta-analysis of longitudinal studies in the general population. Psychosom Med. 2017;79(5):565–575. doi:10.1097/PSY.0000000000000444
11. Shapiro SL, Schwartz GE, Bonner G. Effects of mindfulness-based stress reduction on medical and premedical students. J Behav Med. 1998;21(6):581–599. doi:10.1023/A:1018700829825
12. Shapiro SL, Brown KW, Thoresen C, Plante TG. The moderation of Mindfulness-based stress reduction effects by trait mindfulness: results from a randomized controlled trial. J Clin Psychol. 2011;67(3):267–277. doi:10.1002/jclp.20761
13. Jain S, Shapiro SL, Swanick S, et al. A randomized controlled trial of mindfulness meditation versus relaxation training: effects on distress, positive states of mind, rumination, and distraction. Ann Behav Med. 2007;33(1):11–21. doi:10.1207/s15324796abm3301_2
14. de Vibe M, Solhaug I, Tyssen R, et al. Mindfulness training for stress management: a randomised controlled study of medical and psychology students. BMC Med Educ. 2013;13(1):107. doi:10.1186/1472-6920-13-107
15. Song Y, Lindquist R. Effects of mindfulness-based stress reduction on depression, anxiety, stress and mindfulness in Korean nursing students. Nurse Educ Today. 2015;35(1):86–90. doi:10.1016/j.nedt.2014.06.010
16. Cohen-Katz J, Wiley SD, Capuano T, Baker DM, Kimmel S, Shapiro S. The effects of mindfulness-based stress reduction on nurse stress and burnout, Part II: a quantitative and qualitative study. Holist Nurs Pract. 2005;19(1):26–35. doi:10.1097/00004650-200501000-00008
17. Shapiro SL, Astin JA, Bishop SR, Cordova M. Mindfulness-based stress reduction for health care professionals: results from a randomized trial. Int J Stress Manag. 2005;12(2):164–176. doi:10.1037/1072-5245.12.2.164
18. Malarkey WB, Jarjoura D, Klatt M. Workplace based mindfulness practice and inflammation: a randomized trial. Brain Behav Immun. 2013;27(1):145–154. doi:10.1016/j.bbi.2012.10.009
19. Huang SL, Li RH, Huang FY, Tang FC. The potential for mindfulness-based intervention in workplace mental health promotion: results of a randomized controlled trial. PLoS One. 2015;10(9):e0138089. doi:10.1371/journal.pone.0138089
20. van Dongen JM, van Berkel J, Boot CRL, et al. Long-term cost-effectiveness and return-on-investment of a mindfulness-based worksite intervention: results of a randomized controlled. J Occup Environ Med. 2016;58(6):550–560. doi:10.1097/JOM.0000000000000736
21. Bartlett L, Lovell P, Otahal P, Sanderson K. Acceptability, feasibility, and efficacy of a workplace mindfulness program for public sector employees: a pilot randomized controlled trial with informant reports. Mindfulness. 2017;8(3):639–654. doi:10.1007/s12671-016-0643-4
22. Fazia T, Bubbico F, Berzuini G, et al. Mindfulness meditation training in an occupational setting: effects of a 12-weeks mindfulness-based intervention on wellbeing. Work. 2021;70(4):1089–1099. doi:10.3233/WOR-210510
23. Lomas T, Medina JC, Ivtzan I, Rupprecht S, Hart R, Eiroa-Orosa FJ. The impact of mindfulness on well-being and performance in the workplace: an inclusive systematic review of the empirical literature. Eur J Work Organ Psychol. 2017;26(4):492–513. doi:10.1080/1359432X.2017.1308924
24. Bartlett L, Martin A, Neil AL, et al. A systematic review and meta-analysis of workplace mindfulness training randomized controlled trials. J Occup Health Psychol. 2019;24(1):108–126. doi:10.1037/ocp0000146
25. Kabat-Zinn J, Lipworth L, Burney R. The clinical use of mindfulness meditation for the self-regulation of chronic pain. J Behav Med. 1985;8(2):163–190. doi:10.1007/BF00845519
26. Teasdale JD, Segal ZV, Williams JM, Ridgeway VA, Soulsby JM, Lau MA. Prevention of relapse/recurrence in major depression by mindfulness-based cognitive therapy. J Consult Clin Psychol. 2000;68(4):615–623. doi:10.1037//0022-006x.68.4.615
27. Khoury B, Sharma M, Rush SE, Fournier C. Mindfulness-based stress reduction for healthy individuals: a meta-analysis. J Psychosom Res. 2015;78(6):519–528. doi:10.1016/j.jpsychores.2015.03.009
28. Kuyken W, Warren FC, Taylor RS, et al. Efficacy of mindfulness-based cognitive therapy in prevention of depressive relapse: an individual patient data meta-analysis from randomized trials. JAMA Psychiatry. 2016;73(6):565–574. doi:10.1001/jamapsychiatry.2016.0076
29. Goldberg SB, Tucker RP, Greene PA, Davidson RJ, Kearney DJ, Simpson TL. Mindfulness-based cognitive therapy for the treatment of current depressive symptoms: a meta-analysis. Cogn Behav Ther. 2019;48(6):445–462. doi:10.1080/16506073.2018.1556330
30. McCartney M, Nevitt S, Lloyd A, Hill R, White R, Duarte R. Mindfulness-based cognitive therapy for prevention and time to depressive relapse: systematic review and network meta-analysis. Acta Psychiatr Scand. 2021;143(1):6–21. doi:10.1111/acps.13242
31. Zhang L, Lopes S, Lavelle T, Ogata K, Liwei J, Meenu C. Economic evaluations of mindfulness - based interventions: a systematic review. Mindfulness. 2022;13:2359–2378. doi:10.1007/s12671-022-01960-1
32. Wright TA, Cropanzano R. Psychological well-being and job satisfaction as predictors of job performance. J Occup Health Psychol. 2000;5(1):84–94. doi:10.1037//1076-8998.5.1.84
33. Bellet C, De Neve JE, Ward G. Does employee happiness have an impact on productivity? Saïd business school WP 2019-13; 2019.
34. Kosugi T, Ninomiya A, Nagaoka M, et al. Effectiveness of mindfulness-based cognitive therapy for improving subjective and eudaimonic well-being in healthy individuals: a randomized controlled trial. Front Psychol. 2021;12(August):700916. doi:10.3389/fpsyg.2021.700916
35. American Psychiatric Association. Diagnostic and statistical manual of mental disorders.
36. Diener E, Emmons RA, Larsen RJ, Griffin S. The satisfaction with life scale. J Pers Assess. 1985;49(1):71–75. doi:10.1207/s15327752jpa4901_13
37. Mark W, Danny P. Mindfulness: A Practical Guide to Finding Peace in a Frantic World. London: Piatkus Books; 2011.
38. Al-Janabi H, Flynn TN, Coast J. Development of a self-report measure of capability wellbeing for adults: the ICECAP-A. Qual Life Res. 2012;21(1):167–176. doi:10.1007/S11136-011-9927-2
39. Keeley T, Al-Janabi H, Lorgelly P, Coast J. A qualitative assessment of the content validity of the ICECAP-A and EQ-5D-5L and their appropriateness for use in health research. PLoS One. 2013;10. doi:10.1371/journal.pone.0085287
40. Goranitis I, Coast J, Al-Janabi H, Latthe P, Roberts TE. The validity and responsiveness of the ICECAP-A capability-well-being measure in women with irritative lower urinary tract symptoms. Qual Life Res. 2016;25(8):2063–2075. doi:10.1007/s11136-015-1225-y
41. Keeley T, Coast J, Nicholls E, Foster NE, Jowett S, Al-Janabi H. An analysis of the complementarity of ICECAP-A and EQ-5D-3 L in an adult population of patients with knee pain. Health Qual Life Outcomes. 2016;14(1):36. doi:10.1186/S12955-016-0430-X
42. Excellence C. Developing NICE Guidelines: The Manual.
43. Diener E, Wirtz D, Biswas-Diener R, et al. New measures of well-being; 2009.
44. Diener E, Wirtz D, Tov W, et al. New well-being measures: short scales to assess flourishing and positive and negative feelings. Soc Indic Res. 2010;97(2):143–156. doi:10.1007/s11205-009-9493-y
45. Peak J, Goranitis I, Day E, Copello A, Freemantle N, Frew E. Predicting health-related quality of life (EQ-5D-5 L) and capability wellbeing (ICECAP-A) in the context of opiate dependence using routine clinical outcome measures: CORE-OM, LDQ and TOP. Health Qual Life Outcomes. 2018;16(1):106. doi:10.1186/s12955-018-0926-7
46. Koreki A, Nagaoka M, Ninomiya A, Mimura M, Sado M. Formulation of a mapping formula to estimate well-being utility from clinical subjective well-being scales. Psychol Res Behav Manag. 2022;15(15):3233–3241. doi:10.2147/PRBM.S383266
47. Japanese Ministry of Health Law. Med Fee Revision FY; 2019. Available from: https://www.mhlw.go.jp/toukei/list/26-19.html.
48. Health Insurance Claims Review & Reimbursement Services. Available from: https://www.ssk.or.jp/seikyushiharai/tensuhyo/kihonmasta/r01/kihonmasta_01.files/s_ALL20200306.zip.
49. The Minister of Health, Labour and Welfare, Japan. Prices of drugs. Available from: https://www.mhlw.go.jp/stf/seisakunitsuite/bunya/0000078916.html.
50. Kessler RC, Barber C, Beck A, et al. The World Health Organization health and work performance questionnaire (HPQ). J Occup Environ Med. 2003;45(2):156–174. doi:10.1097/01.JOM.0000052967.43131.51
51. Kessler RC, Ames M, Hymel PA, et al. Using the World Health Organization Health and Work Performance Questionnaire (HPQ) to evaluate the indirect workplace costs of illness. J Occup Environ Med. 2004;46(6):S23–S37. doi:10.1097/01.JOM.0000126683.75201.C5
52. McCabe C, Claxton K, Culyer AJ. The NICE cost-effectiveness threshold: what it is and what that means. Pharmacoeconomics. 2008;26(9):733–744. doi:10.2165/00019053-200826090-00004
53. Kinghorn P, Afentou N. Eliciting a monetary threshold for a year of sufficient capability to inform resource allocation decisions in public health and social care. Soc Sci Med. 2021;279:113977. doi:10.1016/J.SOCSCIMED.2021.113977
54. Himmler S, van Exel J, Brouwer W. Estimating the monetary value of health and capability well-being applying the well-being valuation approach. Eur J Health Econ. 2020;21(8):1235–1244. doi:10.1007/S10198-020-01231-7
55. OECD. Purchasing Power Parities (PPP) (Indicator); 2022.
56. Proud L, McLoughlin C, Kinghorn P. ICECAP-O, the current state of play: a systematic review of studies reporting the psychometric properties and use of the instrument over the decade since its publication. Qual Life Res. 2019;28(6):1429–1439. doi:10.1007/S11136-019-02114-Y
57. Thiart H, Ebert DD, Lehr D, et al. Internet-based cognitive behavioral therapy for insomnia: a health economic evaluation. Sleep. 2016;39(10):1769–1778. doi:10.5665/sleep.6152
58. Munir F, Miller P, Biddle SJH, et al. A cost and cost-benefit analysis of the stand more at work (SMArT work) intervention. Int J Environ Res Public Health. 2020;17(4):1–9. doi:10.3390/ijerph17041214
59. Hemp P. Presenteeism: at work—But out of it. Harv Bus Rev. 2004;82(10):49–58, 155.
60. Goetzel RZ, Long SR, Ozminkowski RJ, Hawkins K, Wang S, Lynch W. Health, absence, disability, and presenteeism cost estimates of certain physical and mental health conditions affecting U.S. employers. J Occup Environ Med. 2004;46(4):398–412. doi:10.1097/01.JOM.0000121151.40413.BD
61. Iverson D, Lewis KL, Caputi P, Knospe S. The cumulative impact and associated costs of multiple health conditions on employee productivity. J Occup Environ Med. 2010;52(12):1206–1211. doi:10.1097/JOM.0b013e3181fd276a
62. Couzner L, Ratcliffe J, Lester L, Flynn T, Crotty M. Measuring and valuing quality of life for public health research: application of the ICECAP-O capability index in the Australian general population. Int J Public Health. 2013;58(3):367–376. doi:10.1007/S00038-012-0407-4
 © 2023 The Author(s). This work is published and licensed by Dove Medical Press Limited. The
full terms of this license are available at https://www.dovepress.com/terms
and incorporate the Creative Commons Attribution
- Non Commercial (unported, 3.0) License.
By accessing the work you hereby accept the Terms. Non-commercial uses of the work are permitted
without any further permission from Dove Medical Press Limited, provided the work is properly
attributed. For permission for commercial use of this work, please see paragraphs 4.2 and 5 of our Terms.
© 2023 The Author(s). This work is published and licensed by Dove Medical Press Limited. The
full terms of this license are available at https://www.dovepress.com/terms
and incorporate the Creative Commons Attribution
- Non Commercial (unported, 3.0) License.
By accessing the work you hereby accept the Terms. Non-commercial uses of the work are permitted
without any further permission from Dove Medical Press Limited, provided the work is properly
attributed. For permission for commercial use of this work, please see paragraphs 4.2 and 5 of our Terms.