Back to Journals » International Journal of Chronic Obstructive Pulmonary Disease » Volume 12
Echo intensity of the rectus femoris in stable COPD patients
Received 9 June 2017
Accepted for publication 29 August 2017
Published 13 October 2017 Volume 2017:12 Pages 3007—3015
DOI https://doi.org/10.2147/COPD.S143645
Checked for plagiarism Yes
Review by Single anonymous peer review
Peer reviewer comments 2
Editor who approved publication: Prof. Dr. Richard Russell
Xiong Ye,1 Mingjie Wang,2 Hui Xiao2
1College of Clinical Medicine, Shanghai University of Medicine & Health Sciences, 2Department of Respiratory Medicine, Shanghai General Hospital, Shanghai Jiaotong University, Shanghai, China
Objective: The aim of this study was to investigate whether echo intensity of the rectus femoris when measured using ultrasound can distinguish muscles affected by COPD compared with healthy non-COPD affected muscles and whether the severity of ultrasonic abnormalities was associated with health-related quality of life (HRQoL).
Methods: Echo intensity, areas of the rectus femoris, and the thickness of quadriceps muscles were measured using ultrasound in 50 COPD outpatients and 21 age-matched non-COPD controls. The results of the 8-Item Short-Form Health Survey and the functional assessment of chronic illness therapy fatigue scales were used to evaluate HRQoL.
Results: There was a significantly higher echo intensity of the rectus femoris in all stages of COPD patients than in age-matched non-COPD subjects; the quadriceps muscle thickness and cross-sectional area of the rectus femoris significantly decreased in COPD GOLD III–IV only. Furthermore, in our stable COPD patients, echo intensity of the rectus femoris was associated with HRQoL independently.
Conclusion: Quantitative ultrasound distinguishes healthy muscles from those affected by COPD grade I–IV, and quality and quantity of muscles are associated with HRQoL and forced expiratory volume in 1 second. Ultrasonic echo intensity of the rectus femoris may be a useful instrument for assessing disease severity and monitoring the changes of skeletal muscle resulting from disease progression or clinical intervention in patients with COPD.
Keywords: echo intensity, ultrasound, rectus femoris, chronic obstructive pulmonary disease
Introduction
Skeletal muscle dysfunction contributes to impaired physical capacity, reduced health-related quality of life (HRQoL), increased health care utilization and even mortality in COPD patients,1,2 independent of airflow obstruction.3 Quadriceps weakness is demonstrable in one-third of COPD patients,4 provides powerful prognostic information and is associated with HRQoL in patients in all stages of COPD.5 People with COPD are in a “downward disease spiral,” where progressive dyspnea leads to a sedentary lifestyle with consequent muscle deconditioning and further inactivity.6,7 In addition, systemic factors, such as inflammation, oxidative stress, corticosteroid use, hormonal disturbances and nutritional deficits, are involved in the development of muscle weakness.8,9
Quadriceps weakness together with fatigue is the most prominent disabling symptom in many COPD patients and considerably impacts their HRQoL.10,11 Lower limb strength has been demonstrated to correlate with rectus femoris cross-sectional area (RFcsa) as measured by ultrasound (US) and computed tomography in mild-to-severe COPD patients.12,13 US imaging is a radiation-free, safe and easily accessible method which is suitable for the assessment of the size and echo intensity (EI) of skeletal muscle.14,15 The increasing of EI of skeletal muscles can be recognized early and is a key parameter in the diagnosis of chronic neuromuscular disorders,16 and was related to the decrease of muscle strength in middle-aged and elderly people independent of age or muscle size.17 Whether EI of the rectus femoris quantified by US is increased or not and its relevance to the HRQoL and lung function in COPD patients is unclear.
The aim of this study was to investigate the relationship between US of the quadriceps, lung function and HRQoL in subjects with COPD. We hypothesized that differences of the EI levels of the rectus femoris measured by US would be observed in mild-to-severe COPD patients compared with age-matched non-COPD subjects. Furthermore, the EI of the rectus femoris would be associated with HRQoL, as measured by the 8-Item Short-Form Health Survey (SF-8) and the functional assessment of chronic illness therapy fatigue (FACITF) scales.
Materials and methods
Study design
From December 2015 to June 2016, we investigated 50 stable COPD patients and 21 non-COPD controls in the Department of Respiratory Medicine, Shanghai General Hospital, Shanghai, China. All subjects completed structured interview and spirometry and US measurements of the quadriceps muscle. The diagnosis of COPD was performed by lung function tests. Subjects were considered as suffering from COPD if their forced expiratory volume in 1 second (FEV1)/forced vital capacity (FVC) ratio was less than 0.7, after the administration of a reversibility test with 0.4 mg salbutamol. The severity of COPD was classified according to the American Thoracic Society (ATS) guidelines: grade I FEV1≥80% predicted; grade II FEV1≥50% and <80% predicted; grade III FEV1≥30% and <50% predicted; grade IV FEV1<30% predicted. Patients affected by neuromuscular disease or having a history of knee and hip surgery were excluded. All of the participants were living independently, had been clinically stable for at least 4 weeks before the visit and were able to walk without an assistive device. The study was approved by the ethics committee of Shanghai General Hospital (number 2015ky134), and written informed consent was provided by all participants.
Baseline measurements
Specially trained technician performed the interviews and the lung function tests. The questionnaires were validated in other studies.18–20 They included questions about HRQoL (SF-8 and FACITF version 4), respiratory symptoms, heart diseases, hypertension, diabetes, use of medicines and smoking habits.21 Body mass index (BMI) was calculated from weight and height. For spirometry and the 6-minute walk distance (6MWD) test, the ATS guidelines were followed.22,23
SF-8
We used a Chinese version of the SF-8 that was constructed to provide a shorter alternative to the SF-36 and SF-12 for use in general and specific populations, and scored by using the Smart Measurement® Online scoring service, available at http://www.qualitymetric.com. Two summary measures were obtained: physical component summary (PCS) and mental component summary (MCS). A higher score was a better self-reported HRQoL, based on answers about health in the past 4 weeks.
FACITF
FACITF scale is a 13-item self-completed questionnaire, designed for chronic diseases, which has previously been used for COPD patients.24,25 FACITF is assumed from statements that fit the person’s experience during the last 7 days asking about the intensity of fatigue as well as its impact on everyday life. The subjects respond to each item by choosing one of the following five options: not at all (4 scores); a little bit (3 scores); somewhat (2 scores); quite a bit (1 score); very much (0 score). Items seven and eight have to be reversely scored. Overall scores of the FACITF scale range from 0 to 52, with higher scores signifying less fatigue.26
US measurements
The participants were in the supine position with the lower limbs relaxed completely. US scanning was performed with LOGIQ 5A (GE Healthcare Bio-Sciences Corp., Piscataway, NJ, USA) and a linear transducer (10 MHz). All scans were made through the quadriceps muscle halfway along the line from the anterior–superior iliac spine to the superior aspect of the patella.27 To show the best bone echo the transducer is always perpendicular to the targeted muscle. Small adjustments in the angle of the ultrasonic beam will affect muscle echo texture measurements.28 A minimum pressure was maintained at the transducer to avoid distortion of the skin and subcutaneous tissues, using a generous amount of contact gel.14 The gain (86 dB), compression (70 dB), depth (6 cm), time gain compensation (in the neutral position) and focus were kept constant between subjects. Three consecutive images were produced by the same investigator who was blinded to the results of spirometry and questionnaires.
The subcutaneous fat thickness (SFT) of the anterior compartment of the mid-thigh was defined as the distance between the dermis and fascia of the rectus femoris muscle. The inner outline of the rectus femoris was manually traced to calculate RFcsa by a movable cursor on a frozen image, while quadriceps muscle thickness (QMT) was measured as the vertical distance from fascia of the rectus femoris to the underlying femur (Figure 1).
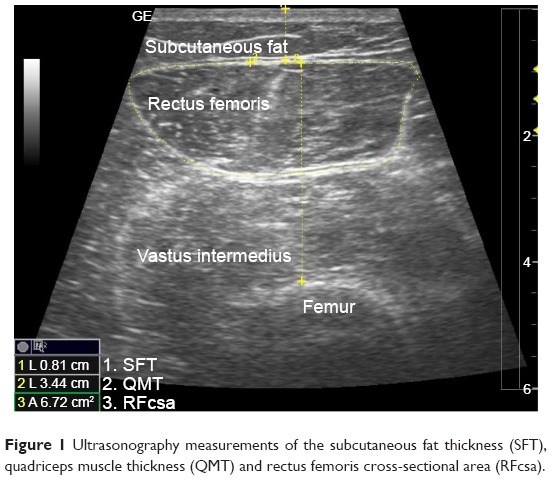 | Figure 1 Ultrasonography measurements of the subcutaneous fat thickness (SFT), quadriceps muscle thickness (QMT) and rectus femoris cross-sectional area (RFcsa). |
Rectus femoris was used only for the analysis of EI. The region of interest was selected within the outline of the rectus femoris to include as much of the muscle as possible without any surrounding fascia.29 EI was defined as the EI in the muscle by using the standard histogram function of Adobe Photoshop 7.0 (Adobe Systems Incorporated, San Jose, CA, USA), expressed as a value between 0 (black) and 255 (white) (Figure 2). EI was measured in three images, and the mean was taken to reduce variation.
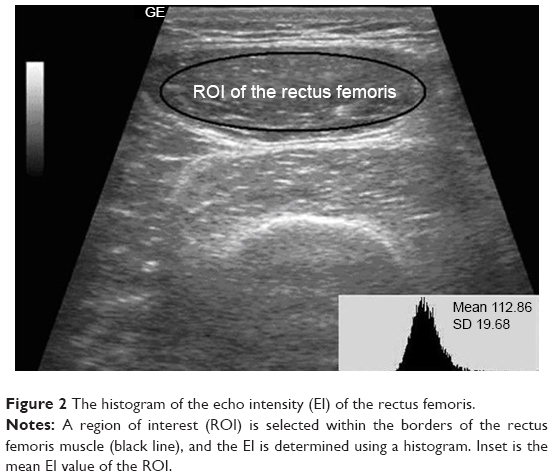 | Figure 2 The histogram of the echo intensity (EI) of the rectus femoris. |
Statistical analyses
Statistical analyses were performed using SPSS 16.0 software (SPSS Inc., Chicago, IL, USA). All values are shown as mean ± standard deviation. Unpaired t-tests were utilized to compare the differences between the two groups, and the analysis of variance (ANOVA) and Kruskal–Wallis test were used to compare more than three groups according to data characteristics. Unitarian comparisons between COPD and non-COPD were assessed using Chi-square tests and independent sample t-test. Paired t-tests were implemented to analyze left–right differences. Correlations between SFT, QMT, RFcsa, EI, PCS, MCS, FACITF, age, BMI and lung function were calculated using Pearson’s correlation coefficients. Multiple linear regression analysis was conducted to evaluate the independent associations of EI, QMT, and RFcsa with PCS in COPD patients. Partial correlation analysis was carried out to determine the effects of QMT, RFcsa, and EI on PCS, controlling for age, height, weight, and SFT. Due to a low number of subjects in GOLD stage III and IV, they were grouped as GOLD ≥III. Statistical significance was defined as P<0.05.
Results
Table 1 summarizes the basic characteristics of the study population. There were no statistically significant differences in age, BMI and gender between COPD and non-COPD subjects. The US measurements, PCS of the SF-8, FACITF and 6MWD of the non-COPD subjects and COPD patients are shown in Figure 3 and Table S1. There were significant differences in EI between non-COPD and GOLD I/II/III-IV COPD patients, respectively, the difference in COPD stage GOLD I compared to GOLD III-IV was also significant (P=0.004). In QMT and RFcsa of the quadriceps with FACITF, non-COPD with GOLD I compared to GOLD ≥III was statistically significant. In PCS and 6MWD, non-COPD compared to GOLD II and GOLD III-IV had significant differences, and GOLD I compared to GOLD III-IV had significant differences also. The SFT, QMT, RFcsa, EI, MCS and PCS showed statistically significant differences between the two genders, while there were no differences in the FACITF (Table S2).
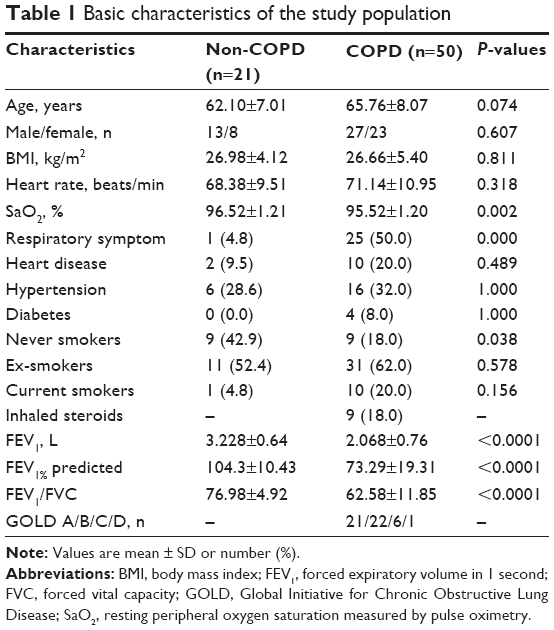 | Table 1 Basic characteristics of the study population |
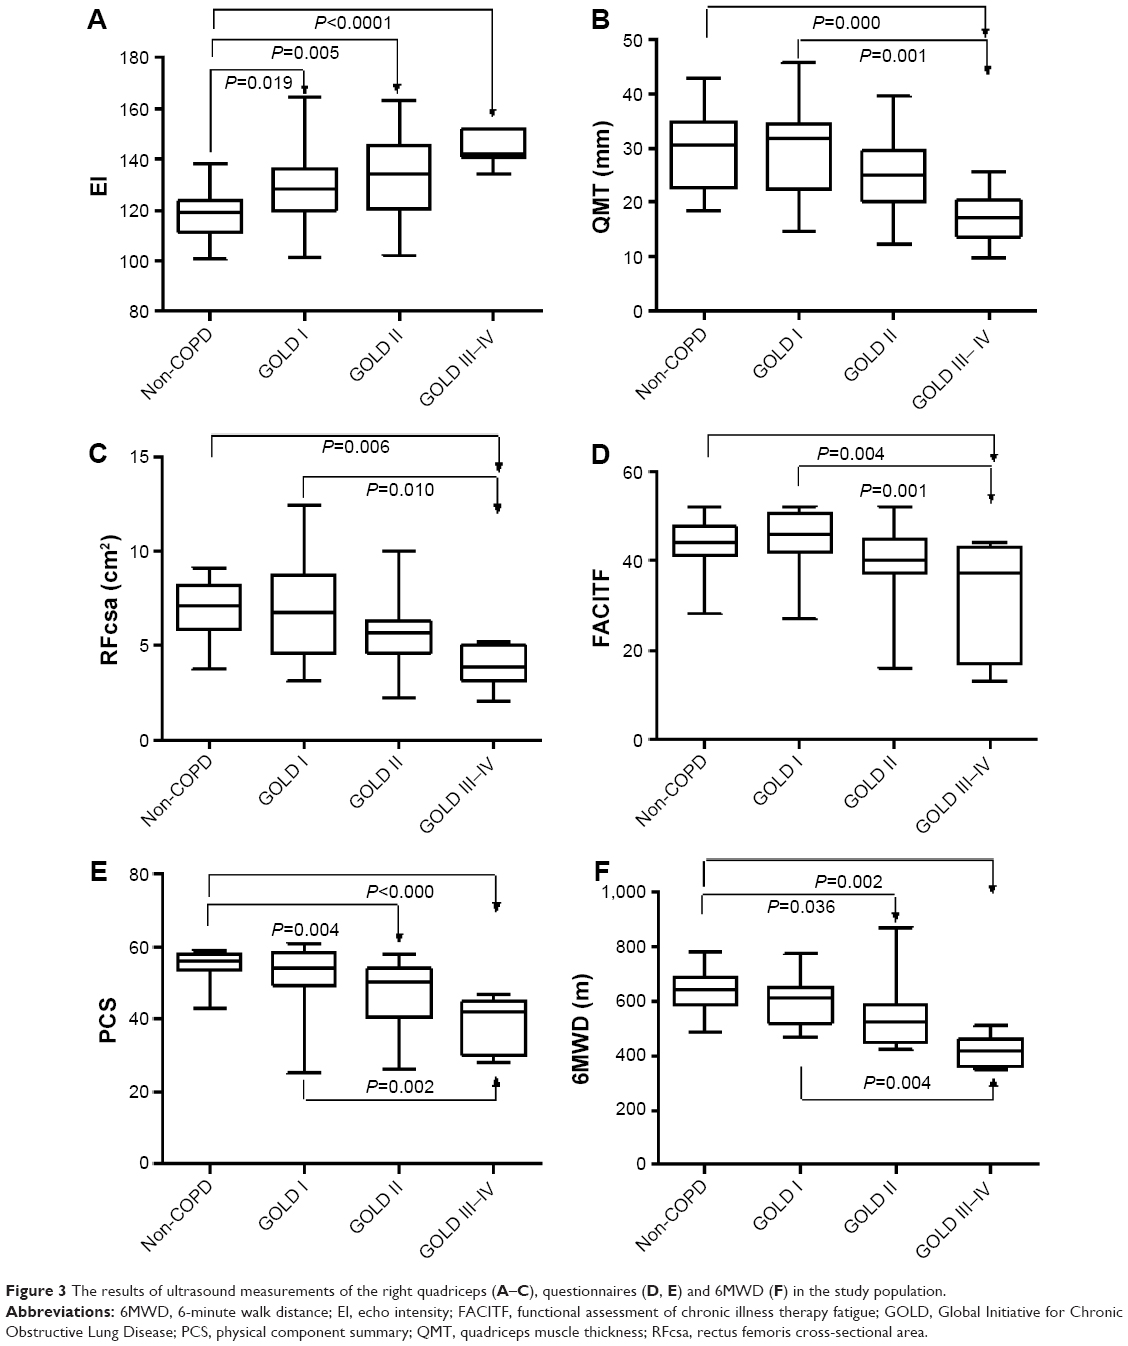 | Figure 3 The results of ultrasound measurements of the right quadriceps (A–C), questionnaires (D, E) and 6MWD (F) in the study population. |
Table 2 displays the correlation coefficients between US quadriceps muscle measures with age, BMI, PCS, MCS, FACITF and 6MWD as control variables in 50 (27 males) stable COPD patients. QMT and RFcsa showed a significant negative correlation with age (r =−0.412; r =−0.477). EI showed significant negative correlations with PCS (r =−0.624, P=0.000) and was not related to age (r =−0.202, P=0.161). Multivariate regression analysis showed that the EI was independently associated with PCS (Table 3). Table 4 shows the partial correlation coefficients between EI, QMT, RFcsa and PCS with age, height, weight, and SFT as control variables; EI showed a significant negative correlation with PCS (r =−0.651, P=0.003). QMT was positively correlated with PCS (r =0.364, P=0.014) but not significantly with EI (r =−0.195, P=0.071). RFcsa was significantly associated with QMT, but not correlated with EI and PCS.
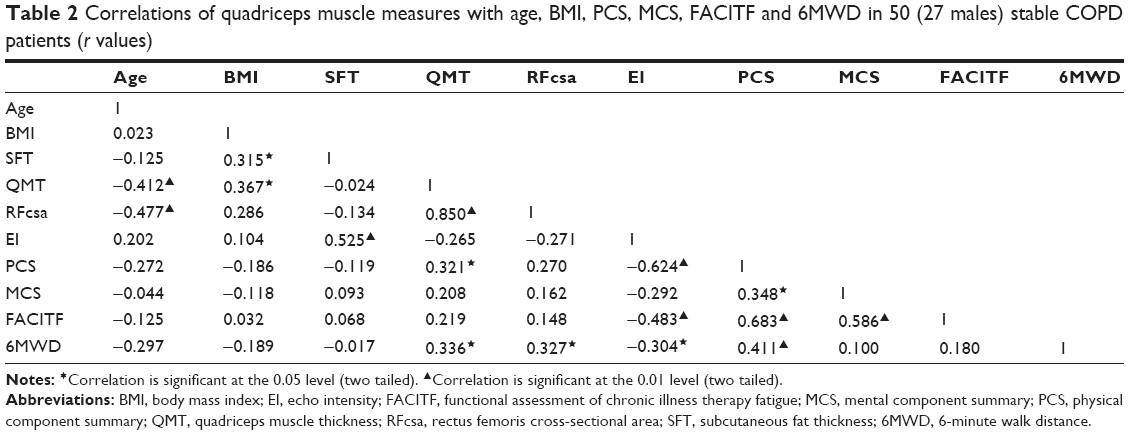 | Table 2 Correlations of quadriceps muscle measures with age, BMI, PCS, MCS, FACITF and 6MWD in 50 (27 males) stable COPD patients (r values) |
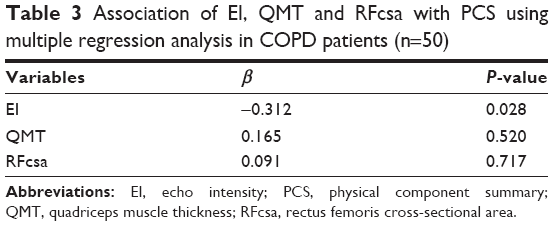 | Table 3 Association of EI, QMT and RFcsa with PCS using multiple regression analysis in COPD patients (n=50) |
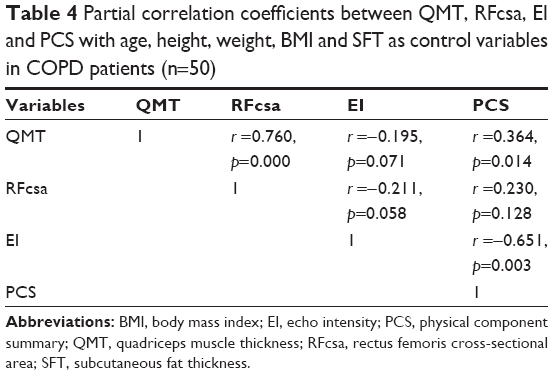 | Table 4 Partial correlation coefficients between QMT, RFcsa, EI and PCS with age, height, weight, BMI and SFT as control variables in COPD patients (n=50) |
Table 5 shows the correlation coefficients among SFT, QMT, RFcsa and EI of the quadriceps, PCS, MCS, FACITF and 6MWD with lung function in 50 (27 males) stable COPD patients. QMT, RFcsa, FACITF and 6MWD showed a significant positive correlation with FEV1, FEV1%, FVC and FEV1/FVC%. EI showed significant negative correlations with FEV1/FVC% (r =−0.413, P<0.01). Table S3 shows the subjects’ characteristics according to PCS above/below 45. There were no significant differences between right and left thigh in US measurements in the study population.
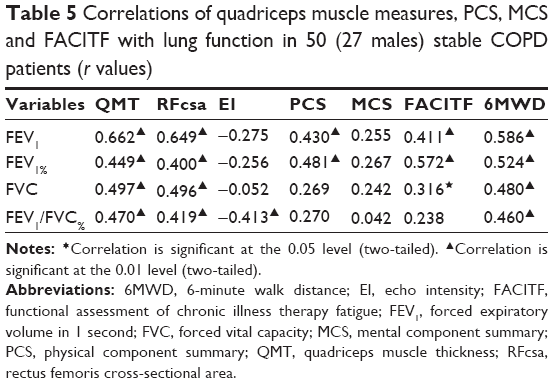 | Table 5 Correlations of quadriceps muscle measures, PCS, MCS and FACITF with lung function in 50 (27 males) stable COPD patients (r values) |
Discussion
The present study showed that the EI of the rectus femoris was substantially increased in all GOLD stages of COPD patients. However, the QMT and RFcsa were significantly decreased in GOLD ≥III only. This suggests that changes in the EI of the rectus femoris may occur earlier than reductions in muscle size in COPD patients. EI was not correlated with age, BMI and the degree of airflow obstruction in our patients. Our results extend those of a previous study on peripheral muscle function in COPD patients by showing that their quadriceps strength and size are lower compared to those of normal subjects.30
It is well known that loss of muscle bulk of the quadriceps is a major change in COPD patients with the decreasing of low limb strength, as well as qualitative changes such as increased intramuscular fibrous and adipose tissue.31–33 To our knowledge, this is the first study that focused on the EI of the rectus femoris in COPD patients and observed the relationship with HRQoL and lung function. Quantitative muscle US is a reliable method to detect structural changes and determine the severity of muscle pathology.14 Image-based measurements of quadriceps muscle structure may help to identify patients with specific muscle phenotypes. Muscle atrophy, intramuscular fibrosis and fatty infiltration enhanced EI on ultrasound images of skeletal muscle that associated with muscle strength, independently of age or muscle size in middle-aged and elderly people.34–36 Muscle EI can be used in the diagnostic evaluation of patients with suspected neuromuscular diseases, guiding a muscle biopsy and in follow-up or intervention studies.37,38 Quadriceps muscle phenotype varies widely in patients with COPD, which cannot be determined without a muscle biopsy.
The SF-8 survey is a good tool for measuring the HRQoL of participants with chronic illness,39 can be expected to be completed in 2–3 minutes and appears to provide a more practical and efficient method for studies in COPD. Our results are consistent with a previous study that COPD patients have a decline in physical health.40 Using a cutoff of 45 of PCS, the EI of the rectus femoris and FACITF scales could differentiate (P<0.0001) between these two groups (PCS above/below 45) in our patients, and also MCS, QMT and 6MWD showed statistically significant associations/differences (P<0.05); however, RFcsa did not. Some studies indicate that females have poorer HRQoL measurements than males in COPD patients.41,42 Our results showed that the SFT, QMT, RFcsa and EI of the quadriceps between the two genders were significantly different, and there were no differences in the FACITF. Fatigue is a prominent disruptive disabling symptom in COPD patients in daily activities and considerably impacts on their quality of life.43,44 The different level of dyspnea, anxiety, hopelessness and concomitant such as heart disease seems to have a negative impact on both physical and mental health.
There are some limitations to our study. First, there is no clear criterion for muscle EI value and the results cannot be readily generalized for different US devices, as EI is influenced by US system hardware and software. Recently, however, a correction equation (EI device 1=1.38× EI device 2+9.14) was reported to convert EI from one ultrasound device to another.29 Second, the first author was the sole investigator who performed the ultrasonic assessment, but there was a high test–retest reliability score (kappa 0.953) in our study. The quantity EI evaluation of muscles showed a higher interobserver agreement (kappa 0.86) in the study of Pillen et al,14 the reproducibility and reliability can be expected to be good.45,46 In future, investigations on intra-observer reliability and reproducibility will still be an issue. The small number of patients, particularly stage GOLD ≥III COPD patients (n=7), is another limitation.
Conclusion
There was significant differences in EI between non-COPD and GOLD I COPD patients, but QMT and RFcas have no differences. This means that the change of EI of the quadriceps occur earlier than the decrease in thickness and area of quadriceps in COPD patients. We believe that US is a low-cost, easily accessible, safe method which is suitable for the assessment of EI as a noninvasive biomarker of quadriceps muscle in COPD patients and may assist in determining patients for trials of interventions targeted at specific muscle phenotypes. Further studies should be pursued to ensure that it can accurately diagnose and track disease progression of the skeletal muscle dysfunction.
Acknowledgment
The abstract of this research was previously presented and published at the Chest World Congress of 2016 as a poster (April 16, 2016, Shanghai, China).
Author contributions
All authors contributed toward data analysis, drafting and critically revising the paper and agree to be accountable for all aspects of the work.
Disclosure
The authors report no conflicts of interest in this work.
References
Langen RC, Gosker HR, Remels AH, Schols AM. Triggers and mechanisms of skeletal muscle wasting in chronic obstructive pulmonary disease. Int J Biochem Cell Biol. 2013;45(10):2245–2256. | ||
Swallow EB, Reyes D, Hopkinson NS, et al. Quadriceps strength predicts mortality in patients with moderate to severe chronic obstructive pulmonary disease. Thorax. 2007;62(2):115–120. | ||
Engelen MP, Schols AM, Does JD, Wouters EF. Skeletal muscle weakness is associated with wasting of extremity fat-free mass but not with airflow obstruction in patients with chronic obstructive pulmonary disease. Am J Clin Nutr. 2000;71(3):733–738. | ||
Seymour JM, Spruit MA, Hopkinson NS, et al. The prevalence of quadriceps weakness in COPD and the relationship with disease severity. Eur Respir J. 2010;36(1):81–88. | ||
Mostert R, Goris A, Weling-Scheepers C, Wouters EF, Schols AM. Tissue depletion and health related quality of life in patients with chronic obstructive pulmonary disease. Respir Med. 2000;94(9):859–867. | ||
Polkey MI, Moxham J. Attacking the disease spiral in chronic obstructive pulmonary disease: an update. Clin Med. 2011;11(5):461–464. | ||
Alkhuja S. Physical activity in people with COPD, using the National Health and Nutrition Evaluation Survey (NHANES) dataset (2003–2006). Heart Lung. 2013;42:483–484. | ||
Cielen N, Maes K, Gayan-Ramirez G. Musculoskeletal disorders in chronic obstructive pulmonary disease. Biomed Res Int. 2014;2014:965764. | ||
Maltais F, Decramer M, Casaburi R, et al. An official American Thoracic Society/European Respiratory Society statement: update on limb muscle dysfunction in chronic obstructive pulmonary disease. Am J Respir Crit Care Med. 2014;189(9):e15–e62. | ||
Hu J, Meek P. Health-related quality of life in individuals with chronic obstructive pulmonary disease. Heart Lung. 2005;34(6):415–422. | ||
Jones PW, Brusselle G, Dal Negro RW, et al. Health-related quality of life in patients by COPD severity within primary care in Europe. Respir Med. 2011;105(1):57–66. | ||
Seymour JM, Ward K, Sidhu PS, et al. Ultrasound measurement of rectus femoris cross-sectional area and the relationship with quadriceps strength in COPD. Thorax. 2009;64(5):418–423. | ||
Bernard S, LeBlanc P, Whittom F, et al. Peripheral muscle weakness in patients with chronic obstructive pulmonary disease. Am J Respir Crit Care Med. 1998;158(2):629–634. | ||
Pillen S, van Keimpema M, Nievelstein RA, et al. Skeletal muscle ultrasonography: visual versus quantitative evaluation. Ultrasound Med Biol. 2006;32:1315–1321. | ||
Reeves ND, Maganaris CN, Narici MV. Ultrasonographic assessment of human skeletal muscle size. Eur J Appl Physiol. 2004;91(1):116–118. | ||
Mayans D, Cartwright MS, Walker FO. Neuromuscular ultrasonography: quantifying muscle and nerve measurements. Phys Med Rehabil Clin N Am. 2012;23(1):133–148, xii. | ||
Fukumoto Y, Ikezoe T, Yamada Y, et al. Skeletal muscle quality assessed from echo intensity is associated with muscle strength of middle-aged and elderly persons. Eur J Appl Physiol. 2012;112(4):1519–1525. | ||
Jansson SA, Backman H, Stenling A, Lindberg A, Rönmark E, Lundbäck B. Health economic costs of COPD in Sweden by disease severity – has it changed during a ten years period? Respir Med. 2013;107(12):1931–1938. | ||
Lâm HT, Ekerljung L, T Formula See Text Ng NF, Rönmark E, Larsson K, Lundbäck B. Prevalence of COPD by disease severity in men and women in northern Vietnam. COPD. 2014;11(5):575–581. | ||
Lindberg A, Sawalha S, Hedman L, Larsson LG, Lundbäck B, Rönmark E. Subjects with COPD and productive cough have an increased risk for exacerbations and death. Respir Med. 2015;109(1):88–95. | ||
Lindberg A, Lundback B. The obstructive lung disease in Northern Sweden chronic obstructive pulmonary disease study: design, the first year participation and mortality. Clin Respir J. 2008;2(suppl 1):64–71. | ||
Standardization of Spirometry, 1994 update. American Thoracic Society. Am J Respir Crit Care Med. 1995;152:1107–1136. | ||
ATS Committee on Proficiency Standards for Clinical Pulmonary Function Laboratories. ATS statement: guidelines for the six-minute walk test. Am J Respir Crit Care Med. 2002;166:111–117. | ||
Baghai-Ravary R, Quint JK, Goldring JJ, Hurst JR, Donaldson GC, Wedzicha JA. Determinants and impact of fatigue in patients with chronic obstructive pulmonary disease. Respir Med. 2009;103(2):216–223. | ||
Stridsman C, Lindberg A, Skar L. Fatigue in chronic obstructive pulmonary disease: a qualitative study of people’s experiences. Scand J Caring Sci. 2014;28(1):130–138. | ||
Webster K, Cella D, Yost K. The functional assessment of chronic illness therapy (FACIT) Measurement System: properties, applications, and interpretation. Health Qual Life Outcomes. 2003;1:79. | ||
Arts IM, Pillen S, Schelhaas HJ, Overeem S, Zwarts MJ. Normal values for quantitative muscle ultrasonography in adults. Muscle Nerve. 2010;41(1):32–41. | ||
Cartwright MS, Kwayisi G, Griffin LP, et al. Quantitative neuromuscular ultrasound in the intensive care unit. Muscle Nerve. 2013;47(2):255–259. | ||
Pillen S, van Dijk JP, Weijers G, Raijmann W, de Korte CL, Zwarts MJ. Quantitative gray-scale analysis in skeletal muscle ultrasound: a comparison study of two ultrasound devices. Muscle Nerve. 2009;39(6):781–786. | ||
Shrikrishna D, Patel M, Tanner RJ, et al. Quadriceps wasting and physical inactivity in patients with COPD. Eur Respir J. 2012;40:1115–1122. | ||
Mathur S, Brooks D, Carvalho CR. Structural alterations of skeletal muscle in copd. Front Physiol. 2014;5:104. | ||
Shields GS, Coissi GS, Jimenez-Royo P, et al. Bioenergetic abnormalities and intermuscular fat in chronic obstructive pulmonary disease (COPD)-associated quadriceps weakness. Muscle Nerve. 2015;51(2):214–221. | ||
Maddocks M, Shrikrishna D, Vitoriano S, et al. Skeletal muscle adiposity is associated with physical activity, exercise capacity and fibre shift in COPD. Eur Respir J. 2014;44(5):1188–1198. | ||
Pillen S, van Alfen N, Zwarts MJ. Muscle ultrasound: a grown-up technique for children with neuromuscular disorders. Muscle Nerve. 2008;38:1213–1214. | ||
Gdynia HJ, Müller HP, Ludolph AC, Köninger H, Huber R. Quantitative muscle ultrasound in neuromuscular disorders using the parameters ‘intensity’, ‘entropy’, and ‘fractal dimension’. Eur J Neurol. 2009;16(10):1151–1158. | ||
Rech A, Radaelli R, Goltz FR, da Rosa LH, Schneider CD, Pinto RS. Echo intensity is negatively associated with functional capacity in older women. Age (Dordr). 2014;36(5):9708. | ||
Pillen S, Tak RO, Zwarts MJ, et al. Skeletal muscle ultrasound: correlation between fibrous tissue and echo intensity. Ultrasound Med Biol. 2009;35:443–446. | ||
Jansen M, van Alfen N, Nijhuis van der Sanden MW, van Dijk JP, Pillen S, de Groot IJ. Quantitative muscle ultrasound is a promising longitudinal follow-up tool in Duchenne muscular dystrophy. Neuromuscul Disord. 2012;22(4):306–317. | ||
Lefante JJ Jr, Harmon GN, Ashby KM, Barnard D, Webber LS. Use of the SF-8 to assess health-related quality of life for a chronically ill, low-income population participating in the Central Louisiana Medication Access Program (CMAP). Qual Life Res. 2005;14(3):665–673. | ||
Stahl E, Lindberg A, Jansson SA, et al. Health-related quality of life is related to COPD disease severity. Health Qual Life Outcomes. 2005;3:56. | ||
de Torres JP, Casanova C, Hernandez C, et al. Gender associated differences in determinants of quality of life in patients with COPD: a case series study. Health Qual Life Outcomes. 2006;4:72. | ||
Di Marco F, Verga M, Reggente M, et al. Anxiety and depression in COPD patients: the roles of gender and disease severity. Respir Med. 2006;100(10):1767–1774. | ||
Guyatt GH, Berman LB, Townsend M, Pugsley SO, Chambers LW. A measure of quality of life for clinical trials in chronic lung disease. Thorax. 1987;42(10):773–778. | ||
Lewko A, Bidgood PL, Garrod R. Evaluation of psychological and physiological predictors of fatigue in patients with COPD. BMC Pulm Med. 2009;9:47. | ||
Bargfrede M, Schwennicke A, Tumani H, Reimers CD. Quantitative ultrasonography in focal neuropathies as compared to clinical and EMG findings. Eur J Ultrasound. 1999;10(1):21–29. | ||
Watanabe Y, Yamada Y, Fukumoto Y, et al. Echo intensity obtained from ultrasonography images reflecting muscle strength in elderly men. Clin Interv Aging. 2013;8:993–998. |
Supplementary materials
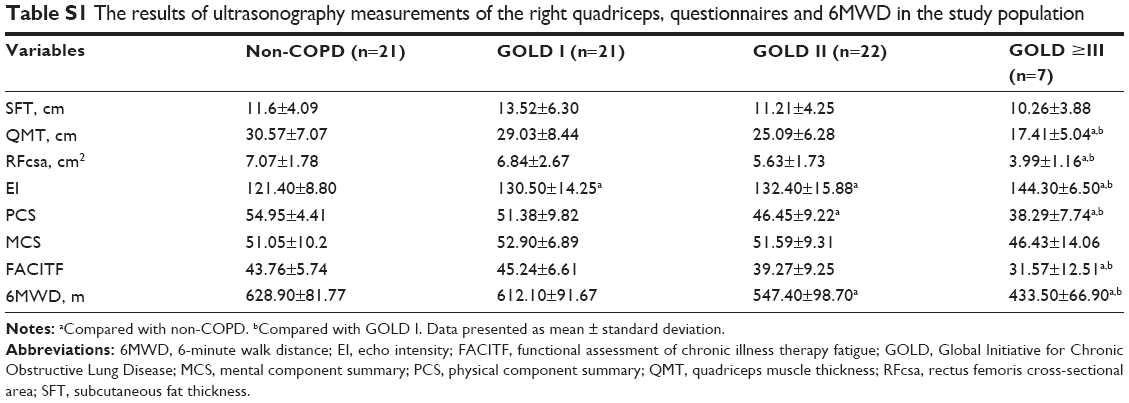 | Table S1 The results of ultrasonography measurements of the right quadriceps, questionnaires and 6MWD in the study population |
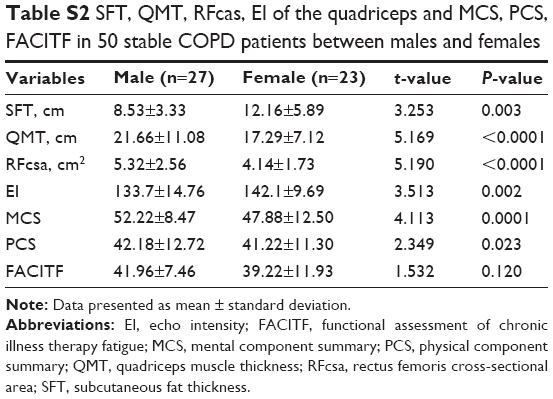 | Table S2 SFT, QMT, RFcas, EI of the quadriceps and MCS, PCS, FACITF in 50 stable COPD patients between males and females |
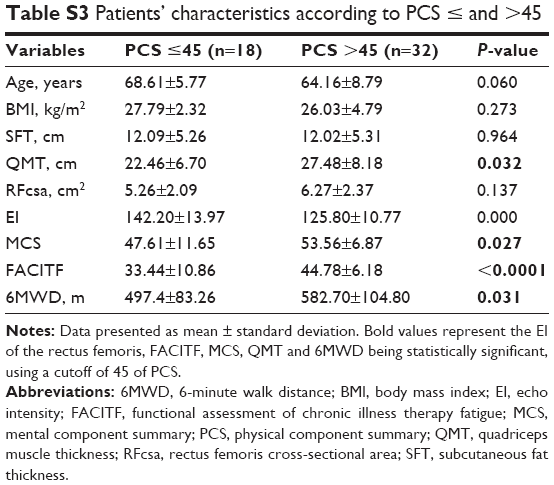 | Table S3 Patients’ characteristics according to PCS ≤ and >45 |
 © 2017 The Author(s). This work is published and licensed by Dove Medical Press Limited. The
full terms of this license are available at https://www.dovepress.com/terms
and incorporate the Creative Commons Attribution
- Non Commercial (unported, 3.0) License.
By accessing the work you hereby accept the Terms. Non-commercial uses of the work are permitted
without any further permission from Dove Medical Press Limited, provided the work is properly
attributed. For permission for commercial use of this work, please see paragraphs 4.2 and 5 of our Terms.
© 2017 The Author(s). This work is published and licensed by Dove Medical Press Limited. The
full terms of this license are available at https://www.dovepress.com/terms
and incorporate the Creative Commons Attribution
- Non Commercial (unported, 3.0) License.
By accessing the work you hereby accept the Terms. Non-commercial uses of the work are permitted
without any further permission from Dove Medical Press Limited, provided the work is properly
attributed. For permission for commercial use of this work, please see paragraphs 4.2 and 5 of our Terms.