Back to Journals » International Journal of Nanomedicine » Volume 21
Early Screening for Cervical Squamous Cell Carcinoma and Precancerous Lesions Based on Surface-Enhanced Raman Spectroscopy Microarray Chips
Received 13 March 2026
Accepted for publication 22 May 2026
Published 4 June 2026 Volume 2026:21 606920
DOI https://doi.org/10.2147/IJN.S606920
Checked for plagiarism Yes
Review by Single anonymous peer review
Peer reviewer comments 3
Editor who approved publication: Dr Sachin Mali
Ji Xia,1,2 Jianhao Sun,1,2 Dan Lu1,2
1Northern Jiangsu People’s Hospital Affiliated to Yangzhou University, Yangzhou University, Yangzhou, People’s Republic of China; 2Institute of Translational Medicine Medical College, Yangzhou University, Yangzhou, People’s Republic of China
Correspondence: Dan Lu, Email [email protected]
Background: MicroRNAs (miRNAs) play a significant role in the development, progression, invasion and metastasis of tumours. Their serum concentrations are closely associated with the progression of tumour diseases and hold promise for cancer diagnosis. This study developed a microarray chip based on surface-enhanced Raman scattering (SERS) technology for the highly sensitive detection of cervical cancer biomarkers (miRNA103a and miRNA221). The combination of SERS technology with the microarray chip enables the simultaneous and repeatable detection of multiple samples.
Methods: An array of gold-silver nanoboxes (Au-AgNBs) was constructed via self-assembly at the oil-water interface and anchored within the wells of the microarray chip. Capture DNA (DNAmiRNA103a-Cy3 and DNAmiRNA221-Cy5) was immobilised on the surface of the Au-AgNBs array via gold-sulphur bonds to serve as the capture matrix, thereby constructing the microarray chip. When signal molecules approach the substrate, the SERS signal intensity is enhanced. When target molecules (miRNA103a and miRNA221) are present in the detection environment, they bind to the corresponding capture DNA via complementary base pairing, forming double-stranded nucleic acids. Upon the addition of a double-stranded nucleic acid-specific nuclease (DSN nuclease), the double strand is specifically cleaved, releasing the signal molecules and resulting in a decrease in the SERS signal intensity in the detection environment. The characteristics of the microarray chip, including reproducibility and sensitivity, were characterised. Microarray chips and qRT-PCR were used to detect miRNA103a and miRNA221 in the serum of 30 healthy individuals (control group), 30 patients with low-grade cervical intraepithelial neoplasia (LSIL), 30 patients with high-grade cervical intraepithelial neoplasia (HSIL), and 30 patients with cervical cancer (stage 1A).
Results: The prepared microarray chip demonstrated good reproducibility and sensitivity. Under optimal testing conditions, the lower limits of detection for miRNA-103a and miRNA-221 on the microarray chip were 1.0934 × 10− 14 M/L and 7.5667 × 10− 13 M/L, respectively. Serum samples from healthy subjects, patients with LSIL, HSIL and cervical cancer (stage 1A) were analysed, and the results were compared with those obtained using the qRT-PCR method. The relative error between the two methods was less than 10%, and the results were statistically significant (P < 0.05).
Conclusion: Microarray chips provide a reliable new method for the early screening of cervical cancer. This simple and efficient microarray chip preparation method demonstrates excellent potential for application in experiments involving multiple samples and replicates. Microarray chips exhibit excellent ability to distinguish between disease states, capable of differentiating between healthy individuals, patients with LSIL, HSIL and cervical cancer.
Keywords: miRNA, cervical cancer, surface enhanced raman spectroscopy, microarray chip
Introduction
Cervical cancer is the most common gynaecological malignancy and one of the leading causes of death among women with gynaecological cancers.1,2 In 2024, there were approximately 600,000 new cases of cervical cancer worldwide, resulting in around 340,000 deaths. Characterised by high incidence and mortality rates, it poses a serious threat to women’s physical and mental health, with incidence and mortality rates in developing countries being higher than in developed countries.3–5 Currently, commonly used screening methods for cervical cancer and precancerous lesions include liquid-based cytology (TCT), HPV testing and colposcopy. At present, the sensitivity of HPV testing for cervical cancer and precancerous lesions is 76.1% and the specificity is 35.4%. Whilst it has high sensitivity, its specificity is relatively low, which may lead to some false-positive results. TCT has a sensitivity of 29.2% and a specificity of 88.2% for detecting cervical cancer and precancerous lesions, posing a certain risk of missed diagnoses. These limitations mean that using either method alone makes it difficult to achieve early and accurate screening, potentially leading to delayed diagnosis or unnecessary referrals for colposcopy. Furthermore, colposcopy is often an invasive procedure with low patient acceptance, and may even result in post-operative complications such as bleeding and infection.6–8 Consequently, there is a clear clinical need to develop a novel screening method that combines higher sensitivity with good specificity, in order to improve the detection rate of cervical precancerous lesions and reduce both missed diagnoses and overtreatment.
MicroRNAs (miRNAs) are single-stranded RNAs found in eukaryotic cells; most are 20–24 nucleotides in length and regulate gene expression by binding complementarily to their target genes.9 In cancer, changes in miRNA expression levels are invariably associated with the development and death of tumour cells.10 Furthermore, miRNAs act as important signalling molecules, playing a significant role in the initiation, progression, proliferation and invasion of tumours.11 Current reports have demonstrated that miRNA-103a and miRNA-221 are up-regulated in cervical cancer and possess the potential to serve as biomarkers for the disease.12,13
Surface-enhanced Raman spectroscopy (SERS) is a label-free biomolecular detection technique based on inelastic scattering. Since Fleischmann’s discovery of the surface-enhanced Raman scattering (SERS) phenomenon in 1974, it has attracted considerable attention due to its ability to detect various small organic molecules, particularly for its high sensitivity and specificity in detecting low-abundance analytes.14,15 As a detection method, SERS has found widespread application in fields such as medicine, biology and food science. Its non-destructive nature, high sensitivity and low water response make it a highly promising bioanalytical tool. For example, Xiang et al16 developed a SERS-based sandwich biosensor to detect cardiac troponin I in serum. Lu et al17 employed electrophoresis-assisted SERS lateral flow assay (E-SERS-LFA) for the simultaneous detection of human immunodeficiency virus p24 antigen (HIV p24) and hepatitis B surface antigen (HBsAg). When a Raman-signalling molecule approaches a plasmonic metal nanostructure, the intensity of its Raman signal is significantly enhanced due to the electromagnetic enhancement effect of the nanostructure. This phenomenon stems from the local surface plasmon resonance (LSPR) generated by the metal nanostructure upon optical excitation, leading to a dramatic increase in the electric field strength near the surface (which can be amplified by a factor of 104 to 1011 compared to the incident field strength).18,19 Although the vibrational frequency of the molecule itself remains unchanged, vibrational modes aligned with the direction of the electric field are selectively enhanced, resulting in a distinctive intensity distribution in the spectrum.
Electromagnetic enhancement (EM) and chemical enhancement (CM) are the primary mechanisms of SERS enhancement. The high amplification factor of EM relies on the strong local electric fields generated between the irregular edges of the nanoparticles and the probe tip, known as the “hotspot effect”. These hotspots depend on the size, shape and aggregation state of the nanoparticles; uniformly distributed noble metal nanoparticles can significantly enhance the Raman signal by improving spatial uniformity.20–22 Compared to the powerful enhancement effect of EM (enhancement up to 107), CM exhibits a lower enhancement efficiency for SERS intensity. However, even in the absence of significant plasmonic resonance effects, certain non-metallic or wide-bandgap semiconductor substrates can still achieve SERS through chemical enhancement mechanisms.20,23 Such materials are typically used as support substrates for noble metal nanostructures; surface defects, charge-transfer complexes or molecule-substrate interactions can induce local redistribution of electron density, thereby generating enhancement effects similar to those of chemical adsorption.24 Consequently, the integration of substrates with uniformly distributed nanomaterials has become a key focus for the future development of SERS technology.
Gold-silver nanoboxes (Au-AgNBs) are hollow, cage-like structures with a regular shape, capable of generating strong LSPR effects between their eight corners.25,26 Due to the presence of the internal cavity and the walls, surface field coupling between the inner and outer walls of Au-AgNBs produces an excellent coupled electromagnetic field, thereby enabling strong light absorption and high Raman enhancement effects.27 Furthermore, the large specific surface area of Au-AgNBs allows for the adsorption of a greater number of Raman-signalling molecules onto their surfaces, whilst a Raman enhancement effect also arises between the Au-AgNBs.28,29 These advantages enable Au-AgNBs to offer higher sensitivity for SERS detection, thereby providing the necessary conditions for the detection of trace-level biomarkers.
Solution-based SERS detection enables rapid analysis of analytes without the need for sample preparation and can be carried out using simple and convenient mixing protocols; however, to achieve high-sensitivity detection, most methods still require pre-treatment steps. This limitation significantly restricts its adoption and use in practical applications such as primary screening.30,31
In contrast, solid-support-based techniques involve immobilising noble metal nanomaterials onto solid substrates such as silicon wafers. Utilising solid substrates for SERS detection can achieve extremely high sensitivity; for instance, Jing et al32 employed silver nanoparticles to modify TiO2 nanotube arrays for solid-phase microextraction and SERS detection of antibiotic residues in milk, achieving a detection limit as low as 0.11 μM. Currently, solid-support-based detection methods have reached a relatively mature stage of technical development; however, this approach has some significant drawbacks that cannot be overlooked, such as cumbersome and complex sample preparation procedures, the need for large sample volumes, limited detection versatility, and restricted sample throughput.33–35
Here, this study proposes a simple, high-throughput detection method for screening miRNAs associated with cervical cancer as tumour markers, for the early screening of cervical precancerous lesions and cervical cancer. This method combines the advantages of microarray chips with Au-AgNBs arrays, significantly enhancing the sensitivity and specificity of screening for cervical cancer and precancerous lesions. As shown in Figure 1, the fabricated chip comprises two modules (Module 1 and Module 2), each detecting a different miRNA. The abundance of wells allows for repeated testing of multiple samples, thereby reducing the false-positive rate. When miRNA103a or miRNA221 is present in the test sample, the DSN enzyme specifically cleaves the double-stranded nucleic acid, prompting the release of signal molecules. This causes the SERS signal intensity to decrease as the concentrations of miRNA103a and miRNA221 increase. By constructing a standard curve, the aim is to achieve quantitative detection of miRNA103a and miRNA221. By this microarray detection chip, clinical samples from healthy individuals, patients with early-stage cervical lesions, and cervical cancer patients were analysed. The method was calibrated using qRT-PCR to validate its clinical utility.
 |
Figure 1 The schematic diagram for miRNA103a and miRNA221 detection by the SERS microarray chips. The fabrication of Au-AgNBs microarray chip (A) and SERS detection mechanism (B). SERS spectrum after reaction (C) and clinical screening workflow (D). |
Materials and Methods
The Materials, Preparation of Au-AgNBs and Experimental Instrumentation sections were described in the Supplementary Methods.
Preservation and Collection of Peripheral Blood Samples
Peripheral blood samples were collected from cervical cancer patients, individuals with cervical precancerous lesions, and healthy controls at the Clinical Medical College of Yangzhou University, Jiangsu Province. All volunteers who signed informed consent forms complied with the ethical guidelines issued by the Council for International Organizations of Medical Sciences. This experimental design adhered to the 1975 Declaration of Helsinki and was approved by the Medical Ethics Committee of the Clinical Medical College of Yangzhou University. The Ethics Approval Number is 2025ky210. All subjects were fully informed about the study and signed informed consent forms. The collected peripheral blood was categorised into four groups: 30 healthy individuals, 30 cases of low-grade cervical intraepithelial neoplasia (CIN), 30 cases of high-grade CIN, and 30 cervical cancer patients. Table 1 details volunteer information (including age). Blood samples were collected prior to meals, with 5 millilitres drawn per sample to avoid dietary interference. All blood samples were stored in a −80°C freezer.
 |
Table 1 Basic Characteristics of the Subjects to Be Included |
Preparation of Microporous Chips
Microarray chips comprise two components: a glass substrate and a PDMS cover. The glass substrate containing microporous structures is fabricated by conventional photolithography and wet etching techniques. The cover is prepared by mixing PDMS prepolymer with a curing agent, which is then cast onto a clean, flat glass plate and cured at 90°C for 2 hours. The chip is subsequently perforated to create a multi-channel array. The PDMS cover layer undergoes ultrasonic cleaning in deionised water and ethanol for 5 minutes, followed by nitrogen drying. Subsequently, the Au-AgNBs array substrate, self-assembled via the oil-water interface, was anchored onto the PDMS cover. The glass substrate and PDMS cover were then assembled and heated at 75°C for 10 minutes to enhance bonding strength. This ultimately achieved physical and functional integration between the substrate and cover. The prepared microarray chip consisted of two parts: Module 1 and Module 2. Both Module 1 and Module 2 measure 40 × 40 mm and were mounted together on a 90 × 50 mm substrate. Module 1 comprised 16 square wells measuring 4 × 4 × 5 mm, each with a volume of 80 mm3, whilst Module 2 comprised 16 circular wells with a diameter of 4 mm and a depth of 5 mm, each with a volume of 62.8 mm3. The total volume of the liquid used for testing is 36 mL (6 mL of DSN enzyme + 30 mL of sample solution), which was less than the volume of both Module 1 and Module 2.
Preparation of SERS Detection Sensors
The DNA and miRNA sequences used in this study were shown in Table 2. First, dilute DNA103a-Cy3 and DNA221-Cy5 (powder) separately according to the instructions to obtain stock solutions of DNA103a-Cy3 and DNA221-Cy5. Take 2 mL each of the 10 mM DNA103a-Cy3 and DNA221-Cy5 solutions and add them to 20 mL of 10 mM TCEP solution. Place the mixture on a 37°C shaker and agitate for 90 minutes to activate the -SH of DNA103a-Cy3 and DNA221-Cy5. The resulting mixture was then dispensed dropwise into the micro-wells of the prepared microarray chip (DNA103a-Cy3 added to round-well chips, DNA221-Cy5 added to square-well chips). Incubation at 37°C under shaking conditions for 16 hours yielded the Au-AgNBs@DNA103a-Cy3 and Au-AgNBs@DNA221-Cy5 complexes, respectively. At this stage, DNA103a-Cy3 and DNA221-Cy5 were linked to the Au-AgNBs surface via Au-S bonds. Excess DNA103a-Cy3 and DNA221-Cy5 on the Au-AgNBs surface were removed by washing with PBS, completing the SERS microarray chip (physical image of the microarray chips was shown as Figure S1). The prepared SERS microarray chip was dried and stored at 4°C for subsequent use.
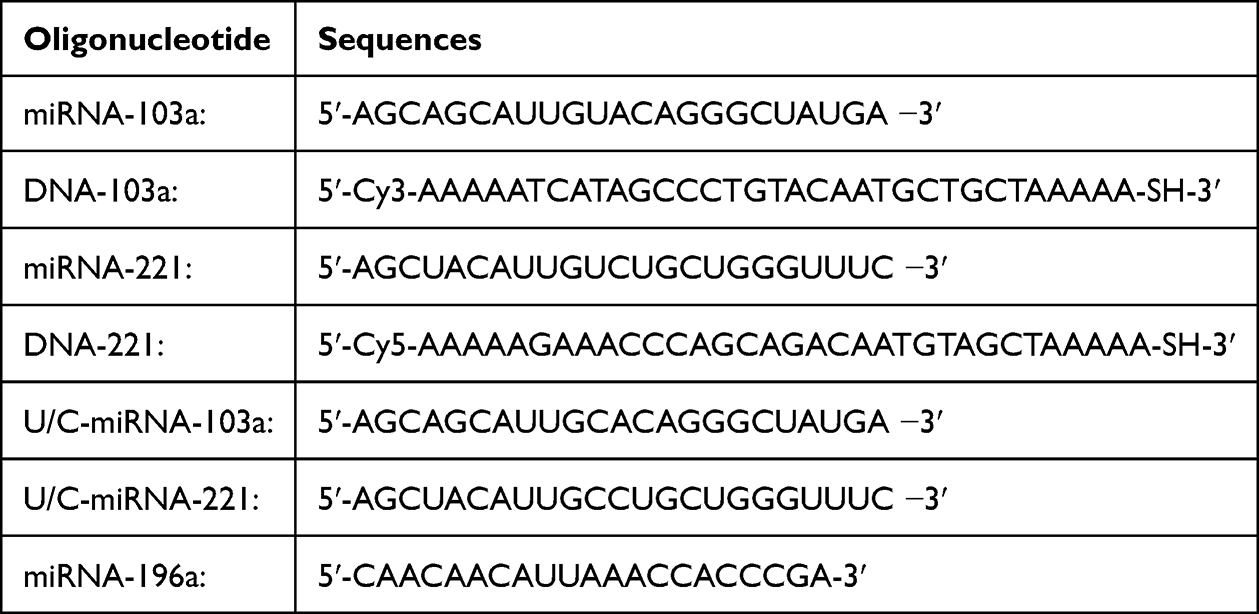 |
Table 2 Sequences of DNA and miRNA |
Surface-Enhanced Raman Spectroscopy Measurement
The construction of the SERS detection platform and the detection workflow for miRNA103a and miRNA221 were illustrated in Figure 1. Prior to detecting miRNA103a and miRNA221, the miRNAs were first diluted into different concentrations (10−13-10−7 M) by TE buffer. Subsequently, 30 μL of each sample solution was dispensed into corresponding wells of the microarray chip. After capping the chip, it was placed in a thermostatic shaker for hybridisation at 300 rpm and 37°C for 1 hour to form double-stranded complementary structures. Thereafter, 6 μL of DSN enzyme (10 U/mL) to cut the hybridised complementary double strands. After reacting at 55°C for 90 minutes, the wells of the microarray chip were sequentially washed with PBS buffer and deionised water, then dried with nitrogen for subsequent SERS spectroscopy detection. The post-reaction microarray chip was positioned beneath a Raman spectrometer for Raman detection using a 785 nm excitation laser. Spectra from 30 distinct points were averaged to ensure detection validity. Each measurement point required 3 seconds, with the resulting average spectrum undergoing baseline correction and smoothing.
Statistical Analysis
All comparisons between groups in this chapter were analysed using one-way analysis of variance. ****P < 0.0001, ***P < 0.001, **P < 0.01, *P < 0.05; ns indicates no statistical significance.
Results
Characterisation of Au-AgNBs
The synthesis of Au-AgNBs typically employs template-based methods, with the displacement reaction system using silver nanocubes as templates being the most classical approach. This method achieves structural transformation through the electrochemical displacement reaction between chloroauric acid (HAuCl4) and silver nanocubes, thereby forming hollow, porous gold nanocage structures. This study has developed an alternative synthetic pathway: the one-step synthesis of gold nanocubes without requiring gold seeds or silver nanocubes. Within the mixed system, Au3+ synergistically interacts with HMT to form complex cage-like structures, which subsequently yield gold nanoparticles upon reduction agent treatment. The gold nanoparticles aggregate and interconnect via dipole-dipole interactions between nanoparticles, growing along the structure formed by HAuCl4 and HMT to ultimately form a hollow cage structure. Polyvinylpyrrolidone (PVP) prevents nanoparticle aggregation and supports the nanobox structure. Characterisation of Au-AgNBs was performed by SEM and HRTEM. Figure 2A and B displayed SEM and TEM images of Au-AgNBs, respectively. The images revealed a uniform structure with regular arrangement, with an edge length of approximately 30 ± 10 nm. The cage-like structure was clearly discernible, exhibiting a hollow configuration with eight rounded corners. This contrasted markedly with conventional sharp-angled nanoboxes; the smoother corners rendered the Au-AgNBs structurally more spherical, facilitating their entry into cells via endocytosis to exert their function. Figure 2C presented a transmission electron micrograph of Au-AgNBs bound to captured DNA. Figure 2D showed the HAADF-STEM image of Au-AgNBs. A fuzzy layer visible on the Au-AgNBs surface indicated successful DNA attachment. Figure 2E illustrated changes in the ultraviolet-visible near-infrared absorption spectrum during Au-AgNBs detection array preparation. It was evident that when only Au-AgNBs were present, a strong localised surface plasmon resonance peak appears at 520 nm. Following incubation with capture DNA, the capture DNA became attached to the Au-AgNBs surface via Au-S bonds, causing the peak to red-shift to 535 nm. This confirmed the successful loading of capture DNA onto the Au-AgNBs surface. Figure 2F and G displayed the zeta potential and particle size distribution of Au-AgNBs and Au-AgNBs@DNA, respectively. Upon conjugation with capture DNA, the particle size of Au-AgNBs increased and the originally positively charged Au-AgNBs became negatively charged, demonstrating successful attachment of capture DNA to the Au-AgNBs surface. Figure S2 showed the Raman spectrum of DNA-103a-labelled Au-AgNBs; as can be seen from the figure, there was a distinct characteristic peak at 257 cm−1 corresponding to the Au-S bond. Figure 2H presented the Raman spectrum of the Au-AgNBs with the Raman-signalling molecule (4-MBA). The Au-AgNBs labelled with 4-MBA exhibit enhanced signal intensity, attributed to the dense “hotspots” formed between the corners of the Au-AgNBs array. Figure 2I was the primary elemental composition of Au-AgNBs. Energy-dispersive X-ray spectroscopy (EDS) elemental mapping revealed that Au-AgNBs consist predominantly of Au, with minor Ag content. To investigate the homogeneity of SERS enhancement across the Au-AgNBs array, mapping experiments were conducted on the prepared array by 4-MBA as the signal molecule, with characteristic peaks at 1595 cm-1. The results were shown in Figure 2J. Although some areas appear light blue, the Au-AgNBs array exhibited highly uniform enhancement. Five points were randomly selected on the substrate surface, with SERS intensity measurements performed three times at each point. The results were presented in Figure 2K, where the relative standard deviation (RSD) of SERS intensity across the five points was 6.519%, indicating excellent homogeneity of the Au-AgNBs array.
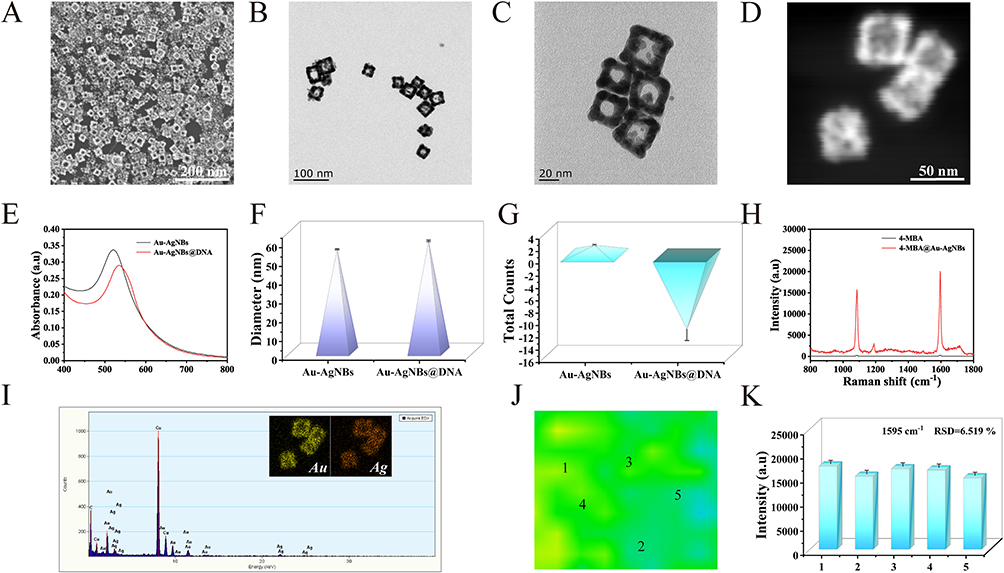 |
Figure 2 SEM (A) and TEM images (B) of Au-AgNBs; TEM image (C) and HRTEM image (D) of Au-AgNBs@DNA; ultraviolet spectroscopic absorption spectra (E), particle size comparison (F), and potential comparison (G) of Au-AgNBs and Au-AgNBs@DNA; SERS spectra of Au-AgNBs@4-MBA and pure 4-MBA (H); elemental analysis image of Au-AgNBs (I); SERS mapping image of Au-AgNBs array (J) and SERS signal intensity histogram with five randomly selected points at the characteristic peak of 1595 cm−1 (K). |
Feasibility Validation
To validate the feasibility of SERS detection for double-stranded nucleic acid cleavage by DSN enzyme, capture DNA and RNA subjected to different treatment methods were characterised using gel electrophoresis. The gel employed in this study was a 4% agarose gel. As shown in Figure 3A, lanes 1 and 2 represented miRNA103a and miRNA221, respectively, lanes 3 and 4 represented DNA-miRNA103a and DNA-miRNA221, respectively, while lanes 5 and 6 represented the double-stranded structures of miRNA103a+DNA-miRNA103a and miRNA221+DNA-miRNA221, respectively. The bands in Figure 3B (1, 2, 3, 4, 5, 6) correspond to miRNA103a, miRNA221, DNA-miRNA103a, DNA-miRNA221, miRNA103a+DNA-miRNA103a, and miRNA221+DNA-miRNA221, respectively, after treatment with DSN enzyme. Notably, the single-stranded DNA/RNA bands showed no discernible difference from Figure 3A (bands 1, 2, 3, 4), whereas the double-stranded structures miRNA103a+DNA-miRNA103a and miRNA221+DNA-miRNA221 were cut by DSN into multiple fragments (bands 5 and 6), demonstrating the feasibility of the DSN cleavage reaction. The feasibility of this method was further validated using SERS detection. Figure 3C and E displayed SERS intensity measurements for the blank control (PBS), the DSN enzyme-only group, the miRNA103a/miRNA221-only group, and the DSN + miRNA103a/miRNA221 group. No significant difference in SERS signal intensity was observed between the blank group (PBS), the DSN enzyme-only group, and the miRNA103a/miRNA221-only group. However, the SERS signal intensity decreased markedly in the group treated with both DSN and miRNA103a/miRNA221. Figure 3D and F presented the histograms corresponding to the characteristic peaks at 1391 cm−1 (Figure 3C) and 1601 cm−1 (Figure 3E). The results indicated that DSN enzyme specifically recognised and cut the DNA phosphodiester bonds within the DNA-miRNA103a-miRNA103a and DNA-miRNA221-miRNA221 double strands. This led to the detachment of the signal molecules (Cy3 and Cy5) at the 5′ ends of DNA-miRNA103a and DNA-miRNA221, thereby attenuating the SERS signal intensity. This exhibited a negative correlation with the concentration of the target sample, demonstrating the feasibility of SERS detection based on the nucleic acid double-strand cleavage reaction catalyzed by DNS enzyme.
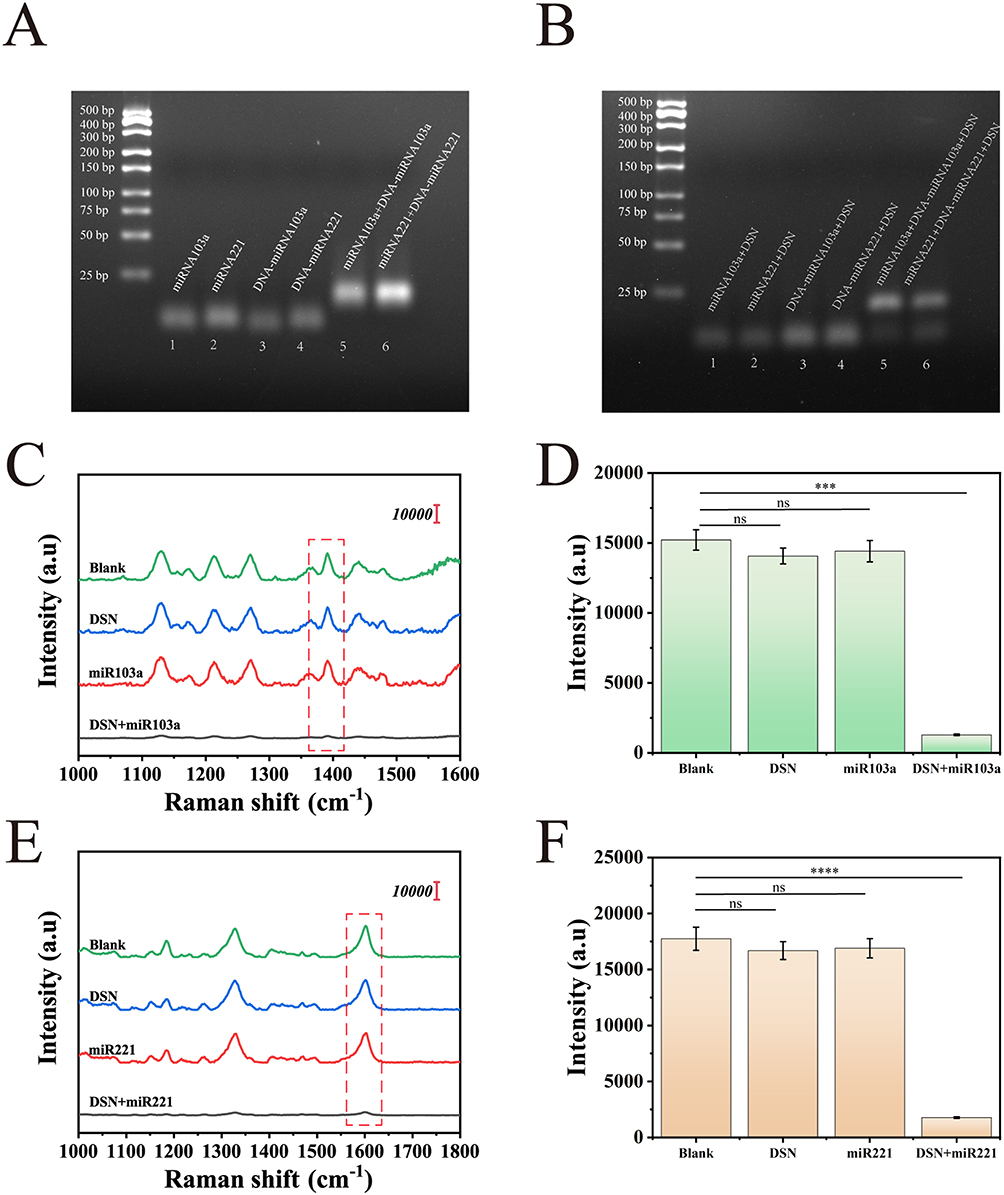 |
Figure 3 Lanes 1, 2, 3, 4, 5, and 6 represent miRNA103a, miRNA221, DNA-miRNA103a, DNA-miRNA221, miRNA103a + DNA-miRNA103a, and miRNA221 + DNA-miRNA221 respectively (A), Bands 1, 2, 3, 4, 5, 6 represent miRNA103a, miRNA221, DNA-miRNA103a, DNA-miRNA221, miRNA103a+DNA-miRNA103a, and miRNA221+DNA-miRNA221 respectively after DSN enzyme treatment (B), SERS spectra of the blank group, the DSN group, pure miRNA103a, and the miRNA103a + DSN group, the red dotted boxes in the (C) is the characteristic peaks of 1391 cm−1 (C), the histograms corresponding to of (C), ns indicates no statistical significance between groups. *** denotes P < 0.001, indicating statistical significance between groups (D). SERS spectra of the blank group, the DSN group, pure miRNA221, and the miRNA221 + DSN group, the red dotted boxes in the (E) is the characteristic peaks of 1601 cm−1 (E) the histograms corresponding to the characteristic peaks at 1601 cm−1 of (E), ns indicates no statistical significance between groups. **** denotes P < 0.0001, indicating statistical significance between groups (F). |
Optimisation of Microarray Chips Performance
Microarray chips may be influenced by temperature, pH, and reaction time. To achieve optimal performance, this study optimised various conditions. During chip preparation, excess DNA103a-Cy3 and DNA221-Cy5 were added during incubation to ensure uniform and maximal capture DNA binding onto the Au-AgNBs surface. Consequently, no optimisation of capture DNA quantity was required. Figure 4A and B displayed Raman spectra (averaged from three randomly selected points) obtained one hour after incubation, following the addition of miRNA103a and miRNA221, respectively, to the wells. As shown in Figure 4C, the reaction time of this detection platform was investigated. After adding DSN enzyme, the SERS intensity gradually decreased with increasing reaction time within the 0–90 minute range. Around 90 minutes, the signal reached its minimum, and the change in SERS intensity became insignificant. Hence, 90 minutes was selected as the optimal reaction time for this experiment. Reaction temperature significantly influences DSN enzyme activity. Optimisation revealed (Figure 4D) an optimal temperature range of 50–60°C for DSN enzyme activity. As temperature gradually increased, DSN enzyme activity progressively enhanced while SERS signal intensity gradually decreased, reaching its minimum at 55°C. Beyond 60°C, DSN enzyme stability diminished and rapidly inactivated at 75°C, thereby losing its ability to cut double-stranded nucleic acids. The presence of RNA’s 2’-OH group enhances stacking interactions, resulting in a higher Tm value for DNA-RNA complexes (exceeding 75°C). Within the temperature range employed in this study, temperature did not adversely affect double-stranded nucleic acids. pH variation also significantly influences DSN enzyme activity. As depicted in Figure 4E, SERS intensity progressively diminished with increasing pH, indicating a gradual rise in DSN enzyme activity that peaks at pH 7.5. When pH exceeds 8, the structural stability of DSN enzyme diminished, leading to decreased activity and consequently increased SERS signal intensity. Concurrently, the optimal pH range for maintaining nucleic acid double-strand functionality lied between 7.5 and 8.0. Therefore, pH = 7.5 was selected as the optimal pH value for this study.
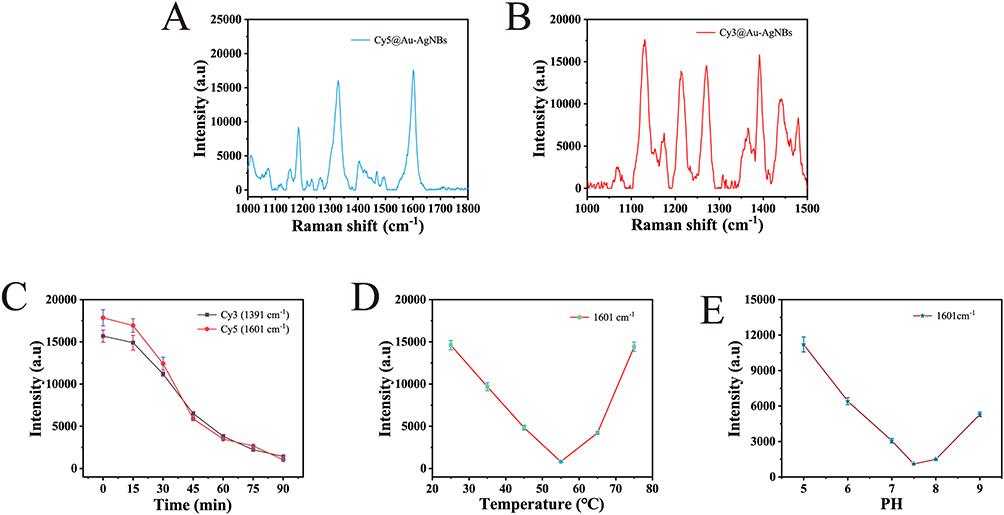 |
Figure 4 Raman spectra of miRNA103a (A) and miRNA221 (B) after one hour of incubation in the microwell chip (averaged from three randomly selected points); optimisation of the microarray chips reaction time (C), reaction temperature (D), and reaction pH (E). |
Characterisation of Microarray Chips
Building upon the aforementioned optimisations, the analytical performance of the microarray chips, including stability, specificity, and reproducibility were further evaluated. SERS detection was performed on microarray chips (different batches) prepared and stored at 4°C for varying durations. Stability was assessed by evaluating changes in SERS intensity. Figure 5A and B showed the SERS spectra for modules 1 and 2 of the microarray chip, respectively. The intensity and shape of characteristic peaks in the SERS spectra remained virtually unchanged across different storage dates, indicating excellent stability for both modules. Figure 5C presented a line graph plotting the relative standard deviation (RSD) of characteristic peak intensity changes for module 1 (1391 cm−1) and module 2 (1601 cm−1). The RSD were 3.524% and 4.299%, respectively. The smaller RSD values further attested to the excellent stability of this microarray chip. Selectivity was another crucial metric for evaluating microarray chips. After incubating the chips with different substances under identical temperature and pH conditions, DSN enzyme was added. Subsequently, SERS signal detection was performed on the chips following DSN enzyme cleavage. The non-specific sample concentration used was 100 pM/L. As shown in Figure 5D and F, these represented the specific detection of miRNA103a and miRNA221 using modules 1 and 2, respectively. It was evident that the SERS signal in the control group was significantly higher than that in the target groups (miRNA103a and miRNA221). This occurred because only the target molecules could form specific base-pairing with the capture DNA in the corresponding detection module, enabling the cleavage of the nucleic acid double strands by DSN enzyme. The histograms in Figure 5E and G provided a more intuitive demonstration of the microarray chip’s specificity towards the targets (miRNA103a and miRNA221). Reproducibility signified whether the microarray chip could be replicated on a large scale, holding significant implications for its practical application. Measurements were taken from different wells on three microarray chips, and the average spectra of the three determinations were calculated. The average characteristic peaks and spectral shapes of the two modules exhibited only minor differences (Figure 5H and J). Figure 5I and K displayed the relative standard deviation (RSD) of the characteristic peaks at 1391 cm−1 and 1601 cm−1 as line graphs, with values of 4.197% and 3.851%, respectively, indicating the excellent reproducibility of this SERS detection platform.
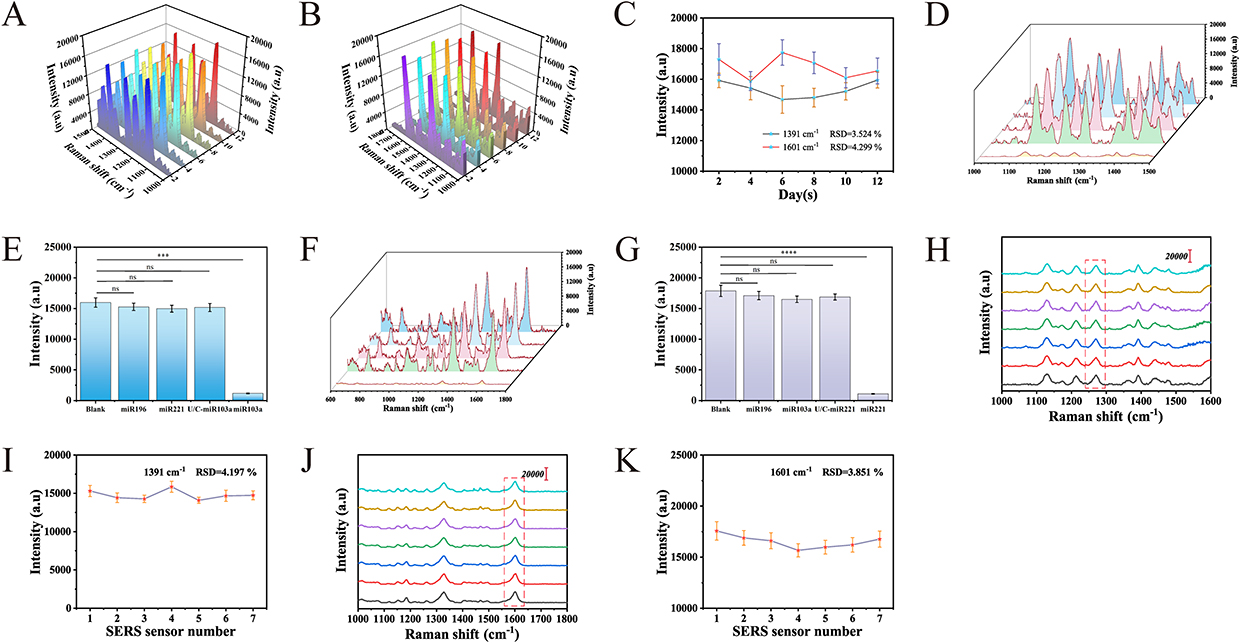 |
Figure 5 Average SERS spectra of sample wells at different time points in microarray module 1 (A) and microarray module 2 (B), along with their scatter plots (C). Module 1 of the microarray chip: specific analytical SERS spectra for different targets (D) and histogram of intensities at 1391 cm−1 (E), ns indicates no statistical significance between groups. *** denotes P < 0.001, indicating statistical significance between groups; Module 2 of the microarray chip: specific analytical SERS spectra for different targets (F) and histogram of intensities at 1601 cm−1 (G), ns indicates no statistical significance between groups. **** denotes P < 0.0001, indicating statistical significance between groups. Average SERS spectra for microarray chips of Module 1 (H) and Module 2 (J), the red dotted boxes in the (H) is the characteristic peaks of 1391 cm−1, the red dotted boxes in the (J) is the characteristic peaks of 1601 cm−1. Line graph with a characteristic peak at 1391 cm−1 (I) and line graph with a characteristic peak at 1601 cm−1 (K). |
Detection of Standard Solutions Using Microarray Chips
To evaluate the feasibility of microarray chips for human serum testing, changes in SERS signal intensity induced by different concentrations of miRNA103a and miRNA221 were analysed. miRNA103a and miRNA221 were dissolved in foetal bovine serum to form standard solutions of varying concentrations. These solutions were then added to corresponding wells of the microarray chip, with SERS spectra acquired using a Raman spectrometer. As depicted in Figure 6A and C, the SERS signal intensity progressively diminished with increasing target concentrations. This reduction stems from DSN enzyme cleavage of DNA strands containing the signal molecules, leading to their release and consequent attenuation of SERS signal intensity. A linear relationship was established between the logarithm of target concentrations and the intensity of characteristic Raman peaks (1391 cm−1 and 1601 cm−1) established a linear relationship. Analysis revealed that the logarithm of miRNA103a and miRNA221 concentrations correlated linearly with the intensity of their respective characteristic peaks (the SERS spectrum represents the average of three measurements), with corresponding linear equations: y = −1446.465x - 5790.646 (1391 cm−1, Figure 6B) and y = −1863.325x - 5949.24 (1601 cm−1, Figure 6D), with corresponding R2 values of 0.986 and 0.978. Furthermore, the limit of detection (LOD) was calculated by the formula C = I(blank) - 3SD. Substituting the measured values into the calibration curve equations yielded an LOD of 1.0934 × 10⁻¹⁴ M/L for miRNA103a, and the detection limit (LOD) for miRNA221 was 7.5667 × 10⁻¹³ M/L. Compared with other detection methods for miRNAs, this study demonstrated superior performance in terms of detection limits (Table 3).
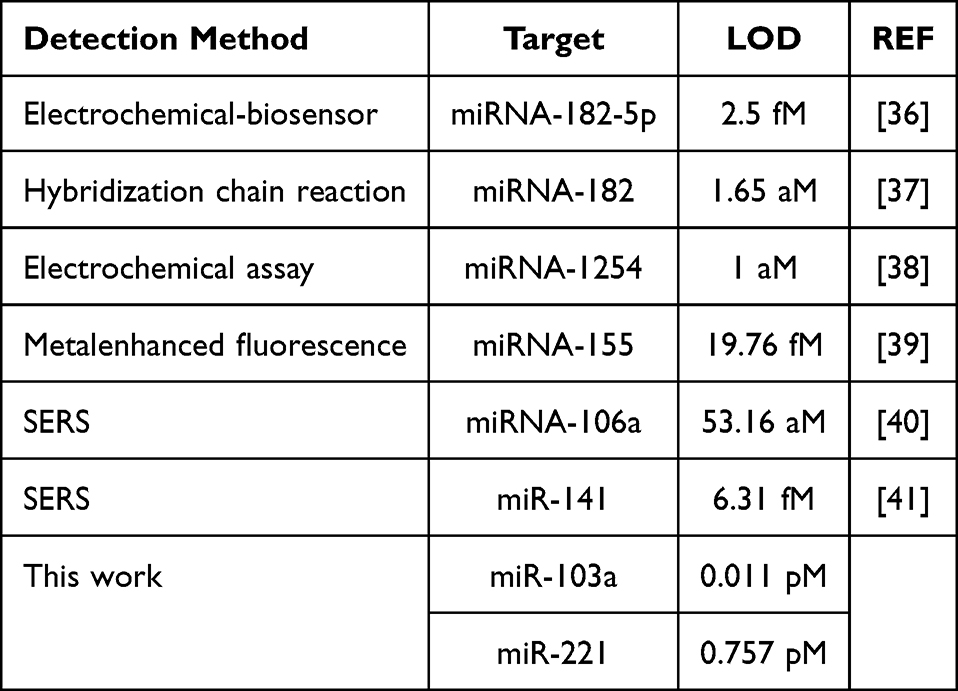 |
Table 3 Comparison of the Present Work with Previously Reported miRNA Detection Methods |
 |
Figure 6 A showed The average SERS spectrum of module one detecting different concentrations of miRNA103a (1−10M to 1−14M) (A), the red dotted boxes in the (A) is the characteristic peaks of 1391 cm−1. The calibration curve plotting the SERS signal intensity at 1391 cm−1 against the logarithm of miRNA103a concentration (B). The average SERS spectrum of module two detecting different concentrations of miRNA221 (1−10M to 1−14M) (C), the red dotted boxes in the (C) is the characteristic peaks of 1601 cm−1. The calibration curve plotting the SERS signal intensity at 1601 cm−1 against the logarithm of the miRNA221 concentration (D). |
Detection of Microarray Chips in Clinical Samples
To further validate the reliability of microarray chips in clinical sample testing, miRNA103a and miRNA221 were detected in serum samples from 30 healthy subjects and 90 patients with cervical cancer and precancerous lesions (LSIL, HSIL, and cervical cancer). Serum was obtained from peripheral blood samples after centrifugation. The microarray chips were analysed post-reaction, and all collected data underwent standardisation. The expression levels of miRNA103a and miRNA221 in serum were then assessed via correlation analysis. Figure 7A–D display cervical HE staining for normal subjects, LSIL, HSIL, and cervical cancer patients. As depicted in Figure 7E and G, the SERS spectral signal intensity progressively decreased with disease progression, indicating gradually increasing concentrations of miRNA103a and miRNA221 in the subjects’ serum. The processed SERS signal intensities at characteristic peaks 1391 cm−1 and 1601 cm−1 were plotted as corresponding histograms. The processed signal intensities were then substituted into the aforementioned linear equations to calculate the concentrations of miRNA103a and miRNA221 in each subject’s serum. These values were averaged, with the results presented in Figure 7F (miRNA103a) and 7H (miRNA221). As a widely adopted method for miRNA detection, qRT-PCR is recognised for its simplicity and high accuracy. A concentration gradient for miRNA103a and miRNA221 was established using qRT-PCR, with concentration standard curves generated based on measured CQ values. Subject serum samples were analysed using qRT-PCR. The obtained CQ values were plotted against the standard curves for miRNA103a and miRNA221 to calculate serum concentrations of these miRNAs. Data from the microarray chip were compared with qRT-PCR results to validate the chip’s measurement accuracy. The results are presented in Table 4. The findings from the microarray chip showed no significant deviation from those obtained via qRT-PCR, demonstrating the high accuracy of the microarray chip in clinical testing. The diagnostic performance of this microarray chip in detecting miRNA-103a and miRNA-221 was evaluated. As shown in Table 5, the microarray chip had a sensitivity of 0.878 and a specificity of 0.9 when distinguishing between healthy individuals and the LSIL+HSIL+cervical cancer (1A) group; a sensitivity of 0.667 and a specificity of 0.9 when distinguishing between healthy individuals and LSIL patients; and a sensitivity of 0.7 when distinguishing between LSIL patients and HSIL patients, and a specificity of 0.933; the sensitivity for distinguishing between HSIL patients and cervical cancer (1A) patients was 0.933, with a specificity of 0.833. The microarray chip is capable of effectively distinguishing between healthy individuals, patients with cervical precancerous lesions and patients with cervical cancer.
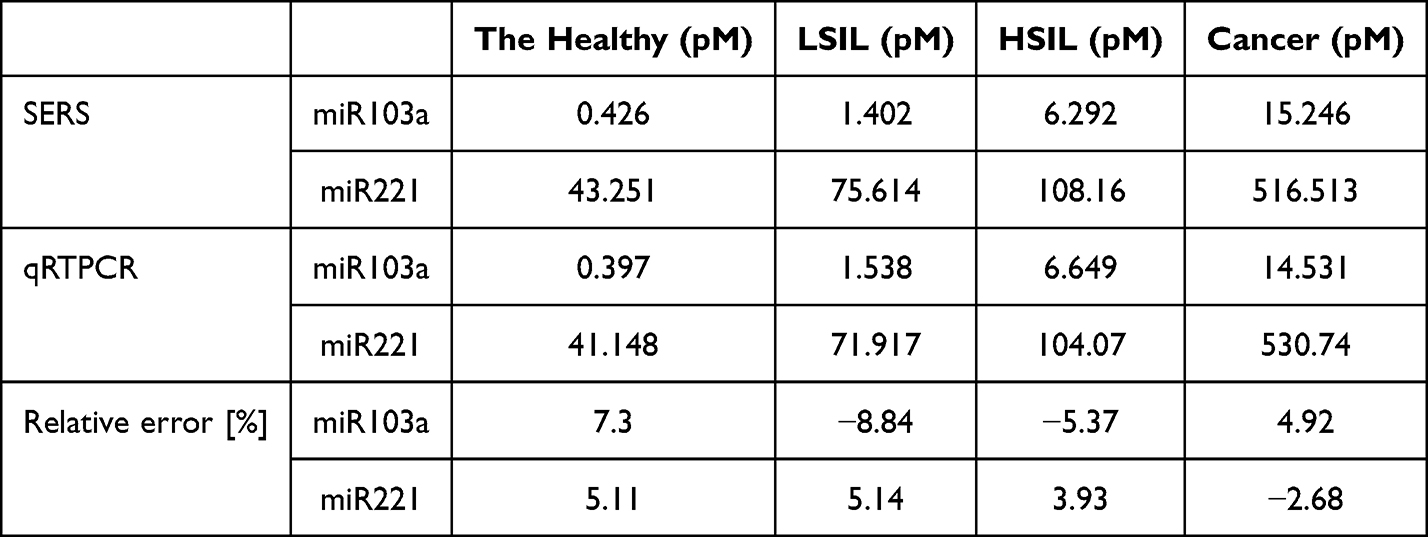 |
Table 4 Detection Results of Real Samples Using the SERS Platform and qRT-PCR |
 |
Table 5 The Ability of Microarray Chips to Distinguish Between Healthy Individuals, Patients with LSIL, HSIL and Cervical Cancer |
 |
Figure 7 The HE stained histopathological sections of cervical tissue from normal subjects (A), LSIL (B), HSIL (C), and cervical cancer patients (D) respectively, The average SERS spectra for miRNA103a detected in serum samples from normal subjects, LSIL, HSIL, and cervical cancer patients (E), the average SERS spectra for miRNA221 detected in serum samples from normal subjects, LSIL, HSIL, and cervical cancer patients (G). The relationship between SERS signal intensity in serum from different subjects and the corresponding concentrations of miRNA103a (F) and the relationship between SERS signal intensity in serum from different subjects and the corresponding concentrations of miRNA221 (H). *** denotes P < 0.001, * denotes P < 0.05 indicating statistical significance between groups. |
Conclusion and Discussion
In summary, this study has developed a SERS-based microarray chip for the early screening of cervical cancer biomarkers miRNA103a and miRNA221. This technology enables simultaneous detection of both miRNAs on a single chip, significantly enhancing testing efficiency. The microarray chip exhibits excellent reproducibility, selectivity, and stability. Furthermore, the microarray chip is compact and portable, enabling repeated testing of multiple samples simultaneously. Its minimal sample requirements and low production costs represent additional significant advantages. When testing standard solutions, the microarray chip achieved the LOD of 1.0934 × 10⁻¹⁴ M/L for miRNA103a and 7.5667 × 10⁻¹³ M/L for miRNA221. When utilising this microarray chip to analyse peripheral blood from subjects at different disease stages and comparing the results with qRT-PCR methods, the relative error was consistently below 10%, demonstrating high concordance between the detection outcomes and qRT-PCR data. In summary, this microarray chip offers a novel approach for early cervical cancer screening and provides fresh insights for detecting other biomarkers.
This study is currently at the laboratory stage and has completed feasibility validation. At present, all samples originate from a single hospital; the sample size is small and the sources are limited, making it difficult to reflect differences across different regions and populations. In the future, we plan to collaborate with multiple centres to expand the sample size and enhance representativeness. Batch quality control has been established for the chip (CV < 15%, excluding poor-quality samples such as those with haemolysis), but batch-to-batch variability persists, necessitating an automated production line; whilst SERS equipment is expensive, portable devices may alleviate this issue. Serum processing and storage have a significant impact on signal quality and must be strictly controlled; personnel require specialised training, and we intend to explore integrated devices that combine pre-processing, detection and analysis in the future.
Data Sharing Statement
Data will be made available on request. The data can be obtained from the corresponding author.
Acknowledgments
This work was supported by the National Natural Science Foundation of China (No. 82072088) and Postgraduate Research & Practice Innovation Program of Jiangsu Province (SJCX23-2035).
Disclosure
The authors declare that there are no conflicts of interest related to this article.
References
1. Feng Y, Le FY, Tian PY, et al. GTW inhibits the epithelial to mesenchymal transition of epithelial ovarian cancer via ILK/AKT/GSK3β/Slug signalling pathway. J Cancer. 2021;12(5):1386–16. doi:10.7150/jca.52418
2. Wang WJ, Shi YH, Li J, Cui W, Yang BZ. Up-regulation of KIF14 is a predictor of poor survival and a novel prognostic biomarker of chemoresistance to paclitaxel treatment in cervical cancer. Biosci Rep. 2016;36(2):e00315. doi:10.1042/bsr20150314
3. Ji L, Yao YF, Yu DD, et al. Performance of a full-coverage cervical cancer screening program using on an artificial intelligence- and cloud-based diagnostic system: observational study of an ultra large population. J Med Internet Res. 2024;26:e51477. doi:10.2196/51477
4. Jiang S, Lin XF, Wu QL, et al. Transient receptor potential channels’ genes forecast cervical cancer outcomes and illuminate its impact on tumor cells. Front Genetics. 2024;15:1391842. doi:10.3389/fgene.2024.1391842
5. Zhao FJ, Su Q, Zhang W, Yang WC, Zhao L, Gao LY. Endu combined with concurrent chemotherapy and radiotherapy for stage IIB-IVA cervical squamous cell carcinoma patients. World J Clin Cases. 2021;9(27):8061–8070. doi:10.12998/wjcc.v9.i27.8061
6. Onyango CG, Ogonda L, Guyah B, et al. Novel biomarkers with promising benefits for diagnosis of cervical neoplasia: a systematic review. Infect Agent Cancer. 2020;15(1):68. doi:10.1186/s13027-020-00335-2
7. Song W, Zhu L, Zheng M, Liu H. Triage of women with positive HPV: comparing DNA ploidy analysis with HPV 16/18 genotyping and cervical cytology. Transl Cancer Res. 2025;14(3):1664–1674. doi:10.21037/tcr-24-1455
8. Gu Y, Mu Q, Cheng DL. Androgens in cervical cancer: their role in epidemiology and biology. Iscience. 2024;27(7):110155. doi:10.1016/j.isci.2024.110155
9. Tang ZX, Wang LL, Bajinka O, Wu GJ, Tan YR. Abnormal gene expression regulation mechanism of myeloid cell nuclear differentiation antigen in lung adenocarcinoma. Biology-Basel. 2022;11(7):1047. doi:10.3390/biology11071047
10. Arif KMT, Elliott EK, Haupt LM, Griffiths LR. Regulatory mechanisms of epigenetic miRNA relationships in human cancer and potential as therapeutic targets. Cancers. 2020;12(10):2922. doi:10.3390/cancers12102922
11. Khalifa A, Guijarro A, Nencioni A. Advances in diet and physical activity in breast cancer prevention and treatment. Nutrients. 2024;16(14):2262. doi:10.3390/nu16142262
12. Ren L, Yang JJ, Meng XY, Zhang JJ, Zhang YR. The promotional effect of microRNA-103a-3p in cervical cancer cells by regulating the ubiquitin ligase FBXW7 function. Human Cell. 2022;35(2):472–485. doi:10.1007/s13577-021-00649-2
13. Pan ZX, Zhang XY, Chen SR, Li CZ. Upregulated exosomal miR-221/222 promotes cervical cancer via repressing methyl-CpG-binding domain protein 2. Eur Rev Med Pharmacol Sci. 2019;23(9):3645–3653. doi:10.26355/eurrev_201905_17788
14. Tao P, Luo Y, Zheng K, et al. FTW SERS probes with Ag NCs-GO composite structure excited by evanescent wave for in situ detection of permethrin. Anal Chim Acta. 2025;1341:343646. doi:10.1016/j.aca.2025.343646
15. Atta S, Thorsen TL, Sanchez S, Zhao YH, Vo-Dinh T. Multibranched magnetic core-shell gold nanostars for in situ solution-based SERS detection. ACS Appl Nano Mater. 2025;8(23):12393–12403. doi:10.1021/acsanm.5c02344
16. Xiang Q, Wang H, Liu SD, et al. Highly sensitive and reproducible SERS substrate based on ordered multi-tipped Au nanostar arrays for the detection of myocardial infarction biomarker cardiac troponin I. Analyst. 2025;150(11):2239–2250. doi:10.1039/d5an00171d
17. Lee S, Dang H, Moon JI, et al. SERS-based microdevices for use as in vitro diagnostic biosensors. Chem Soc Rev. 2024;53(11):5394–5427. doi:10.1039/d3cs01055d
18. Sharma B, Frontiera RR, Henry AI, Ringe E, Van Duyne RP. SERS: materials, applications, and the future. Mater Today. 2012;15(1–2):16–25. doi:10.1016/s1369-7021(12)70017-2
19. Schlücker S. Surface-enhanced raman spectroscopy: concepts and chemical applications. Angew Chem-Int Ed. 2014;53(19):4756–4795. doi:10.1002/anie.201205748
20. Wang ZY, Wu JK, Li XM, et al. Enhanced SERS detection using TiO2 photonic crystals with in-situ-grown Au/Ag nanoparticles. ACS Appl Nano Mater. 2025;8(21):10864–10873. doi:10.1021/acsanm.5c00221
21. Kleinman SL, Frontiera RR, Henry AI, Dieringer JA, Van Duyne RP. Creating, characterizing, and controlling chemistry with SERS hot spots. Phys Chem Chem Phys. 2013;15(1):21–36. doi:10.1039/c2cp42598j
22. Chen HY, Lin MH, Wang CY, Chang YM, Gwo S. Large-scale hot spot engineering for quantitative SERS at the single-molecule scale. J Am Chem Soc. 2015;137(42):13698–13705. doi:10.1021/jacs.5b09111
23. Procházka M, Novák D, Kocisová E, Kylián O, Ji W, Ozaki Y. New insights into SERS mechanism of semiconductor-metal heterostructure: a case study on vanadium pentoxide nanoparticles decorated with gold. J Phys Chem C. 2024;128(28):11732–11740. doi:10.1021/acs.jpcc.4c03080
24. Qiu BC, Xing MY, Yi QY, Zhang JL. Chiral carbonaceous nanotubes modified with titania nanocrystals: plasmon-free and recyclable SERS sensitivity. Angew Chem-Int Ed. 2015;54(36):10643–10647. doi:10.1002/anie.201505319
25. Wang ZY, Xue J, Bi CL, Xin H, Wang YW, Cao XW. Quantitative and specific detection of cancer-related microRNAs in living cells using surface-enhanced raman scattering imaging based on hairpin DNA-functionalized gold nanocages. Analyst. 2019;144(24):7250–7262. doi:10.1039/c9an01579e
26. Kim M, Ko SM, Lee C, et al. Hierarchic interfacial nanocube assembly for sensitive, selective, and quantitative DNA detection with surface-enhanced raman scattering. Anal Chem. 2019;91(16):10467–10476. doi:10.1021/acs.analchem.9b01272
27. Liu GL, Lu Y, Kim J, Doll JC, Lee LP. Magnetic nanocrescents as controllable surface-enhanced raman scattering nanoprobes for biomolecular imaging. Adv Mater. 2005;17(22):2683. doi:10.1002/adma.200501064
28. Sun YG, Xia YN. Alloying and dealloying processes involved in the preparation of metal nanoshells through a galvanic replacement reaction. Nano Lett. 2003;3(11):1569–1572. doi:10.1021/nl034765r
29. Zhang QA, Li WY, Wen LP, Chen JY, Xia YN. Facile synthesis of Ag nanocubes of 30 to 70 nm in edge length with CF3COOAg as a precursor. Chemistry. 2010;16(33):10234–10239. doi:10.1002/chem.201000341
30. Laurence TA, Braun G, Talley C, et al. Rapid, solution-based characterization of optimized SERS nanoparticle substrates. J Am Chem Soc. 2009;131(1):162–169. doi:10.1021/ja806236k
31. Dhakal S, Chao KL, Huang Q, et al. A simple surface-enhanced raman spectroscopic method for on-site screening of tetracycline residue in whole milk. Sensors. 2018;18(2):424. doi:10.3390/s18020424
32. Jing MY, Zhang H, Li M, Mao Z, Shi XM. Silver nanoparticle-decorated TiO2 nanotube array for solid-phase microextraction and SERS detection of antibiotic residue in milk. Spectrochim Acta A Mol Biomol Spectrosc. 2021;255:119652. doi:10.1016/j.saa.2021.119652
33. Yang ZC, Ma CQ, Gu J, et al. A sensitive surface-enhanced raman spectroscopy method for detecting tetracycline in milk. Appl Spectrosc. 2021;75(5):589–595. doi:10.1177/0003702820978233
34. Limwichean S, Leung W, Sataporncha P, et al. Label free detection of multiple trace antibiotics with SERS substrates and independent components analysis. Spectrochim Acta A Mol Biomol Spectrosc. 2023;295:122584. doi:10.1016/j.saa.2023.122584
35. Sarma D, Medhi A, Mohanta D, Nath P. Electrochemically deposited bimetallic SERS substrate for trace sensing of antibiotics. Mikrochim Acta. 2024;191(1):14. doi:10.1007/s00604-023-06075-5
36. Yang HY, Jin YX, Qian H, et al. Target-driven cascade amplified assembly of covalent organic frameworks on tetrahedral DNA nanostructure with multiplex recognition domains for ultrasensitive detection of microRNA. Anal Chim Acta. 2024;1311:342743. doi:10.1016/j.aca.2024.342743
37. Bai YR, Wang X, Xiang M, Mao ZQ, Zhang F. Artificial nanochannels for highly selective detection of miRNA based on the HCR signal amplification. Chem Eng J. 2024;488:150830. doi:10.1016/j.cej.2024.150830
38. Bang S, Choi D, Shin J, et al. Automated system for attomolar-level detection of MiRNA as a biomarker for influenza A virus. ACS Appl Mater Interfaces. 2024;16(26):33897–33906. doi:10.1021/acsami.4c04898
39. Liu DB, Zhu WZ, Qiu B, Zhang SQ. An NIR-driven biosensor based on the metal-enhanced fluorescence effect and a signal amplification strategy for miRNA detection. RSC Adv. 2024;14(54):39908–39920. doi:10.1039/d4ra07080a
40. He XY, Liang J, Zhang JJ, et al. CRISPR/Cas13a triggered-DNA walker amplified SERS sensor for ultrasensitive detection of cancer-related exosomal miRNA. Biosens Bioelectron. 2025;289:117924. doi:10.1016/j.bios.2025.117924
41. Lu Y, Yu YY, Wang YR, et al. A micro-nano interface integrated SERS-based microfluidic sensor for miRNA detection using DNAzyme walker amplification. Anal Chim Acta. 2023;1283:1283341957. doi:10.1016/j.aca.2023.341957
 © 2026 The Author(s). This work is published and licensed by Dove Medical Press Limited. The
full terms of this license are available at https://www.dovepress.com/terms
and incorporate the Creative Commons Attribution
- Non Commercial (unported, 4.0) License.
By accessing the work you hereby accept the Terms. Non-commercial uses of the work are permitted
without any further permission from Dove Medical Press Limited, provided the work is properly
attributed. For permission for commercial use of this work, please see paragraphs 4.2 and 5 of our Terms.
© 2026 The Author(s). This work is published and licensed by Dove Medical Press Limited. The
full terms of this license are available at https://www.dovepress.com/terms
and incorporate the Creative Commons Attribution
- Non Commercial (unported, 4.0) License.
By accessing the work you hereby accept the Terms. Non-commercial uses of the work are permitted
without any further permission from Dove Medical Press Limited, provided the work is properly
attributed. For permission for commercial use of this work, please see paragraphs 4.2 and 5 of our Terms.