Back to Journals » Pediatric Health, Medicine and Therapeutics » Volume 17
Early Prediction Model for Etoposide-Based Protocols Resistance in Pediatric HLH
Authors Wu J, Xie L ![]() , Li X, Yan H, Yang Y, Luo T, Wang X, Zhang X, Huang J, Zheng M, Yang H, Lu X
, Li X, Yan H, Yang Y, Luo T, Wang X, Zhang X, Huang J, Zheng M, Yang H, Lu X ![]()
Received 30 October 2025
Accepted for publication 7 May 2026
Published 24 June 2026 Volume 2026:17 577441
DOI https://doi.org/10.2147/PHMT.S577441
Checked for plagiarism Yes
Review by Single anonymous peer review
Peer reviewer comments 3
Editor who approved publication: Professor Roosy Aulakh
Jiajia Wu,1,2 Longlong Xie,3 Xun Li,4 Haipeng Yan,5 Yufan Yang,5 Ting Luo,4 Xiangyu Wang,4 Xinping Zhang,5 Jiaotian Huang,5 Mincui Zheng,6 Haixia Yang,6 Xiulan Lu1
1The School of Pediatrics, Hengyang Medical School, University of South China, Changsha, Hunan, People’s Republic of China; 2Department of General Pediatrics, Affiliated Hengyang Hospital of Hunan Normal University & Hengyang Central Hospital, Hengyang, Hunan, People’s Republic of China; 3Department of Radiology, The Affiliated Children’s Hospital of Xiangya School of Medicine, Central South University (Hunan Children’s Hospital), Changsha, People’s Republic of China; 4Pediatric Research Institute of Hunan Province, The Affiliated Children’s Hospital of Xiangya School of Medicine, Central South University (Hunan Children’s Hospital), Changsha, Hunan, People’s Republic of China; 5Department of Pediatric Intensive Care Unit (PICU) and Hunan Provincial Key Laboratory of Emergency Medicine for Children, The Affiliated Children’s Hospital of Xiangya School of Medicine, Central South University (Hunan Children’s Hospital), Changsha, Hunan, People’s Republic of China; 6Department of Hematology and Oncology, The Affiliated Children’s Hospital of Xiangya School of Medicine, Central South University (Hunan Children’s Hospital), Changsha, Hunan, People’s Republic of China
Correspondence: Xiulan Lu, The School of Pediatrics, Hengyang Medical School, University of South China, Changsha, Hunan, People’s Republic of China, Email [email protected] Longlong Xie, Department of Radiology, The Affiliated Children’s Hospital of Xiangya School of Medicine, Central South University (Hunan Children’s Hospital), Changsha, People’s Republic of China, Email [email protected]
Background: Etoposide-based protocols remain the first-line therapy for pediatric hemophagocytic lymphohistiocytosis (HLH), yet 20– 30% of patients exhibit primary resistance. Early identification of non-responders is critical to enable timely salvage therapy. We aimed to develop and validate a predictive model for etoposide-based protocols resistance using readily available clinical and laboratory parameters.
Methods: A retrospective cohort of 79 pediatric HLH patients (median age 3.5 years; 53% male) treated with etoposide-based protocols (HLH-94/2004) at Hunan Children’s Hospital (2020– 2024) was analyzed. Patients were stratified into refractory (n=20) and responsive (n=59) groups based on 8-week treatment outcomes. Chemosensitive patients were defined as those achieving complete response (CR) or entering maintenance by week 8; chemorefractory patients were defined as those who died during induction, required salvage therapy due to progression, or failed to achieve CR within 8 weeks. CR required normalization of all quantifiable disease markers (sCD25, ferritin, triglycerides, ALT, hemoglobin, neutrophils, platelets). Pre-chemotherapy and early post-chemotherapy (Day 3) variables were compared using t-tests, Mann–Whitney U-tests, and χ2 analyses. Multivariable logistic regression and ROC analyses identified predictors of resistance, with internal validation via 1000-bootstrapping.
Results: Pre-chemotherapy IL-10 > 131.2 μmol/L (OR=5.1; 95% CI 1.9– 13.7; P=0.001) and pre-chemotherapy platelet count < 55.5× 10⁹/L (OR=4.2; 95% CI 1.6– 11.3; P=0.004) independently predicted refractoriness. A combined model incorporating these parameters achieved an AUC of 0.822 (sensitivity 81.3%, specificity 75.0%). Post-chemotherapy Day 3 platelet count (OR=1.02 per 109/L increase; P=0.01) and lymphocyte count (OR=2.5 per 109/L increase; P=0.03) further refined prediction (AUC 0.880). Calibration curves and decision curve analysis confirmed clinical utility.
Conclusion: Pre-chemotherapy IL-10 and platelet count reliably identify pediatric HLH patients at high risk of etoposide-based protocols resistance. Integration of Day 3 post-chemotherapy parameters enables ultra-early and more precise risk stratification, facilitating prompt transition to salvage therapies.
Keywords: hemophagocytic lymphohistiocytosis, etoposide-based protocols, drug resistance, IL-10, platelet count, pediatric
Background
Hemophagocytic lymphohistiocytosis (HLH) is a life-threatening hyperinflammatory syndrome driven by dysregulated activation of cytotoxic T cells and NK cells, with its core pathology characterized by the “cytokine storm—excessive macrophage phagocytosis—multi-organ failure” cascade.1 In untreated pediatric patients, the median survival is less than 2 months,2 with a long-term survival rate below 5%.3 Although the etoposide-based protocols HLH-94/2004 regimen has improved the 5-year overall survival rate to 61%, 4.6% of pediatric patients still die within the first 10 days of treatment initiation, and 19% succumb before hematopoietic stem cell transplantation.4 This early mortality peak indicates that the conventional 14-day response assessment window is no longer clinically sufficient, underscoring an urgent need for an ultra-early predictive system capable of identifying high-risk children within 72 hours.
HLH exhibits a “dual-track” etiological spectrum:5 Primary HLH results from genetic mutations (eg, PRF1, UNC13D, STX11) impairing cytotoxic granule release, while secondary HLH is triggered by hyperinflammatory states induced by Epstein-Barr Virus (EBV) infection, malignancies, autoimmune diseases (MAS in the course of rheumatic diseases) or other less common triggers such as drugs and transplantation.6 Significant variations in etoposide-based protocols sensitivity and drug toxicity profiles across different etiologies indicate that a “one-size-fits-all” fixed treatment regimen fails to meet individualized therapeutic needs. The 2022 and 2024 Chinese HLH guidelines introduced for the first time the concept of “stratified therapy”, advocating for earlier incorporation of salvage regimens (eg, ruxolitinib, emapalumab) based on etiology and early treatment response,6,7 However, the lack of objective thresholds for determining “when” to switch from first-line regimens results in some pediatric patients missing optimal treatment windows while receiving ineffective chemotherapy.
Previous adult studies have identified age >30 years, disseminated intravascular coagulation (DIC), interleukin-10 (IL-10) >400 μmol/L, elevated lactate dehydrogenase (LDH), hypoalbuminemia, and thrombocytopenia as predictors of poor prognosis.8–10 However, pediatric HLH demonstrates more rapid progression, lower metabolic reserve, and a higher EBV-driven proportion (up to 80%).5,11,12 The cutoff values, temporal windows, and biological significance of these indicators remain unvalidated in children. Verkamp et al13 reported that insufficient platelet or Soluble interleukin-2 receptor (sCD25) recovery within 7 days could predict pre-transplant mortality, but this 7-day waiting period remains inadequate for rapidly deteriorating pediatric cases.
The rapid progression and high mortality of HLH necessitate early identification of patients at risk of severe outcomes. Interleukin-10 (IL-10), traditionally viewed as an anti-inflammatory cytokine, has recently been shown to exhibit paradoxical pro-inflammatory effects, particularly in synergy with interleukin-18 (IL-18). Preclinical models demonstrate that co-overexpression of IL-10/IL-18 can induce lethal HLH-like syndromes, reversible by anti-IL-10 antibodies.14 Clinically, elevated IL-10 (>400 μmol/L) strongly correlates with ICU admission and mortality in adult cohorts,8 but its early predictive utility in pediatric HLH remains unvalidated. Similarly, platelets (PLT) are not merely consumption markers but active inflammatory modulators, releasing PF4 from α-granules to amplify circuits.15 Their dynamic changes may reflect real-time inflammatory, though this has not been systematically investigated.
While previous studies have identified prognostic factors such as thrombocytopenia and elevated IL-10 levels associated with poor overall survival in HLH, their specific utility in predicting resistance to etoposide-based protocols remains unclear. This study extends these findings by demonstrating that these markers can serve as early predictors of chemotherapy resistance, enabling ultra-early risk stratification and timely transition to salvage therapies—a novel contribution that transforms known prognostic indicators into actionable tools for real-time treatment guidance. Based on these findings, we enrolled 79 pediatric HLH patients uniformly treated with the HLH-94/2004 protocol to investigate pre-chemotherapy and day 3 post-chemotherapy IL-10 levels, platelet counts, lymphocyte counts, and metabolic parameters. This study aims to: 1) validate the predictive value of these variables for etoposide-based protocols resistance; 2) develop and validate a risk-stratification model capable of guiding treatment modification within 72 hours; and 3) provide evidence-based support for implementing “data-driven” individualized therapy in clinical practice.
Materials and Methods
Study Design and Ethics
This single-centre, retrospective cohort study consecutively enrolled pediatric patients diagnosed with HLH at Hunan Children’s Hospital, Changsha, China, between 1 January 2020 and 29 February 2024. The study protocol was approved by the institutional ethics committee (HCHLL-2018) and conducted in accordance with the 1964 Declaration of Helsinki (as revised in 2013). The requirement for written informed consent was waived owing to the retrospective nature of the analysis and use of de-identified data.
Patients and Definitions
Inclusion Criteria
Children who fulfilled the HLH-2004 diagnostic criteria:16
1. Definitive molecular diagnosis (pathogenic variants in PRF1, UNC13D, STX11, STXBP2, RAB27A, LYST, SH2D1A, BIRC4, ITK, AP3B1, MAGT1, CD27 or other recognised loci).
2. At least five of the following eight clinical-laboratory criteria:
Fever: Peak temperature >38.5°C persisting for ≥7 days.
Splenomegaly: Palpable spleen ≥3 cm below left costal margin.
Cytopenias: Affecting at least two of three lineages in peripheral blood (haemoglobin <90 g/L, platelets <100 × 109/L, neutrophils <1.0 × 10⁹/L).
Hypertriglyceridaemia and/or hypofibrinogenaemia: Fasting triglycerides ≥3 mmol/L, and/or fibrinogen ≤1.5 g/L.
Haemophagocytosis: Evidence in bone marrow, spleen, cerebrospinal fluid, or lymph nodes.
Low or absent NK-cell activity: Below 10% of reference range per local laboratory.
Hyperferritinaemia: Ferritin ≥500 µg/L.
Elevated soluble CD25: sIL-2Rαl≥2400 U/mL (age-adjusted reference).
All patients received etoposide-based protocols (HLH-94 or HLH-2004).
Exclusion Criteria
(1) Prior etoposide-based protocols at an outside facility with incomplete baseline data; (2) relapsed HLH after previous complete remission; (3) concomitant ruxolitinib use; and (4) <8 weeks follow-up or lost-to-follow-up precluding outcome ascertainment.
Outcome Assignment
Chemorefractory group HLH (n=20) was defined by at least one of: (i) death during induction, (ii) switch to salvage therapy because of progression, or (iii) failure to achieve complete response (CR) within 8 weeks. CR required normalisation of all quantifiable disease markers (sCD25, ferritin, triglycerides, glutamic-pyruvic transaminase (ALT), hemoglobin (Hb), absolute neutrophil count (Ne), PLT).17 Chemosensitive group HLH (n=59) comprised patients who achieved CR or entered maintenance therapy by week 8.
Data Collection and Laboratory Assays
Electronic health records were interrogated for demographics, underlying aetiology (EBV-driven, genetic, autoimmune, malignancy-associated), Peripheral blood laboratory indicators, time from symptom onset to chemotherapy, and imaging. Splenic and hepatic size were quantified by ultrasonography as the maximal subcostal distance (mm) reported by a single pediatric radiologist blinded to outcome.
Laboratory values were extracted at four prespecified time-points:
(1) Baseline: worst recorded value (pre-treatment peak), and final pre-chemotherapy value (“baseline”);
(2) Post-chemotherapy: days 3, 6, 9, and 14 (±1 day for days 3–9; ±2 days for day 14).
Statistical Analysis
Continuous and categorical variables were compared using appropriate tests (t-test, Mann–Whitney U, the chi-square (χ2) test, or Fisher’s exact test). Variables with P < 0.10 in univariable analysis were included in a multivariable logistic regression model with backward elimination. Model performance was assessed by the area under the receiver operating characteristic curve (AUC), calibration plots (bootstrapped with 1000 samples), and the Hosmer-Lemeshow test. Decision-curve analysis quantified clinical utility. Analyses were performed using SPSS 25.0 and R 4.3.1, with a two-sided P < 0.05 considered significant.
Result
Baseline Characteristics and Early Mortality Overview
A total of 79 pediatric patients meeting the HLH-2004 criteria were consecutively enrolled (Table 1). The median age was 3.5 years, and 53% (n=42) were male. The refractory group comprised 20 patients, six (30%) of whom died within the first week of diagnosis. No significant differences were observed between the two groups in terms of age, sex, or etiological distribution. However, in the refractory group, the time from symptom onset to chemotherapy initiation exceeded 2 weeks in 50% of the patients (P=0.031). Additionally, a significantly higher proportion of patients in the refractory group had a splenic inferior margin greater than 20.5 mm compared to the treatment-responsive group (72% vs 36%, P=0.008).
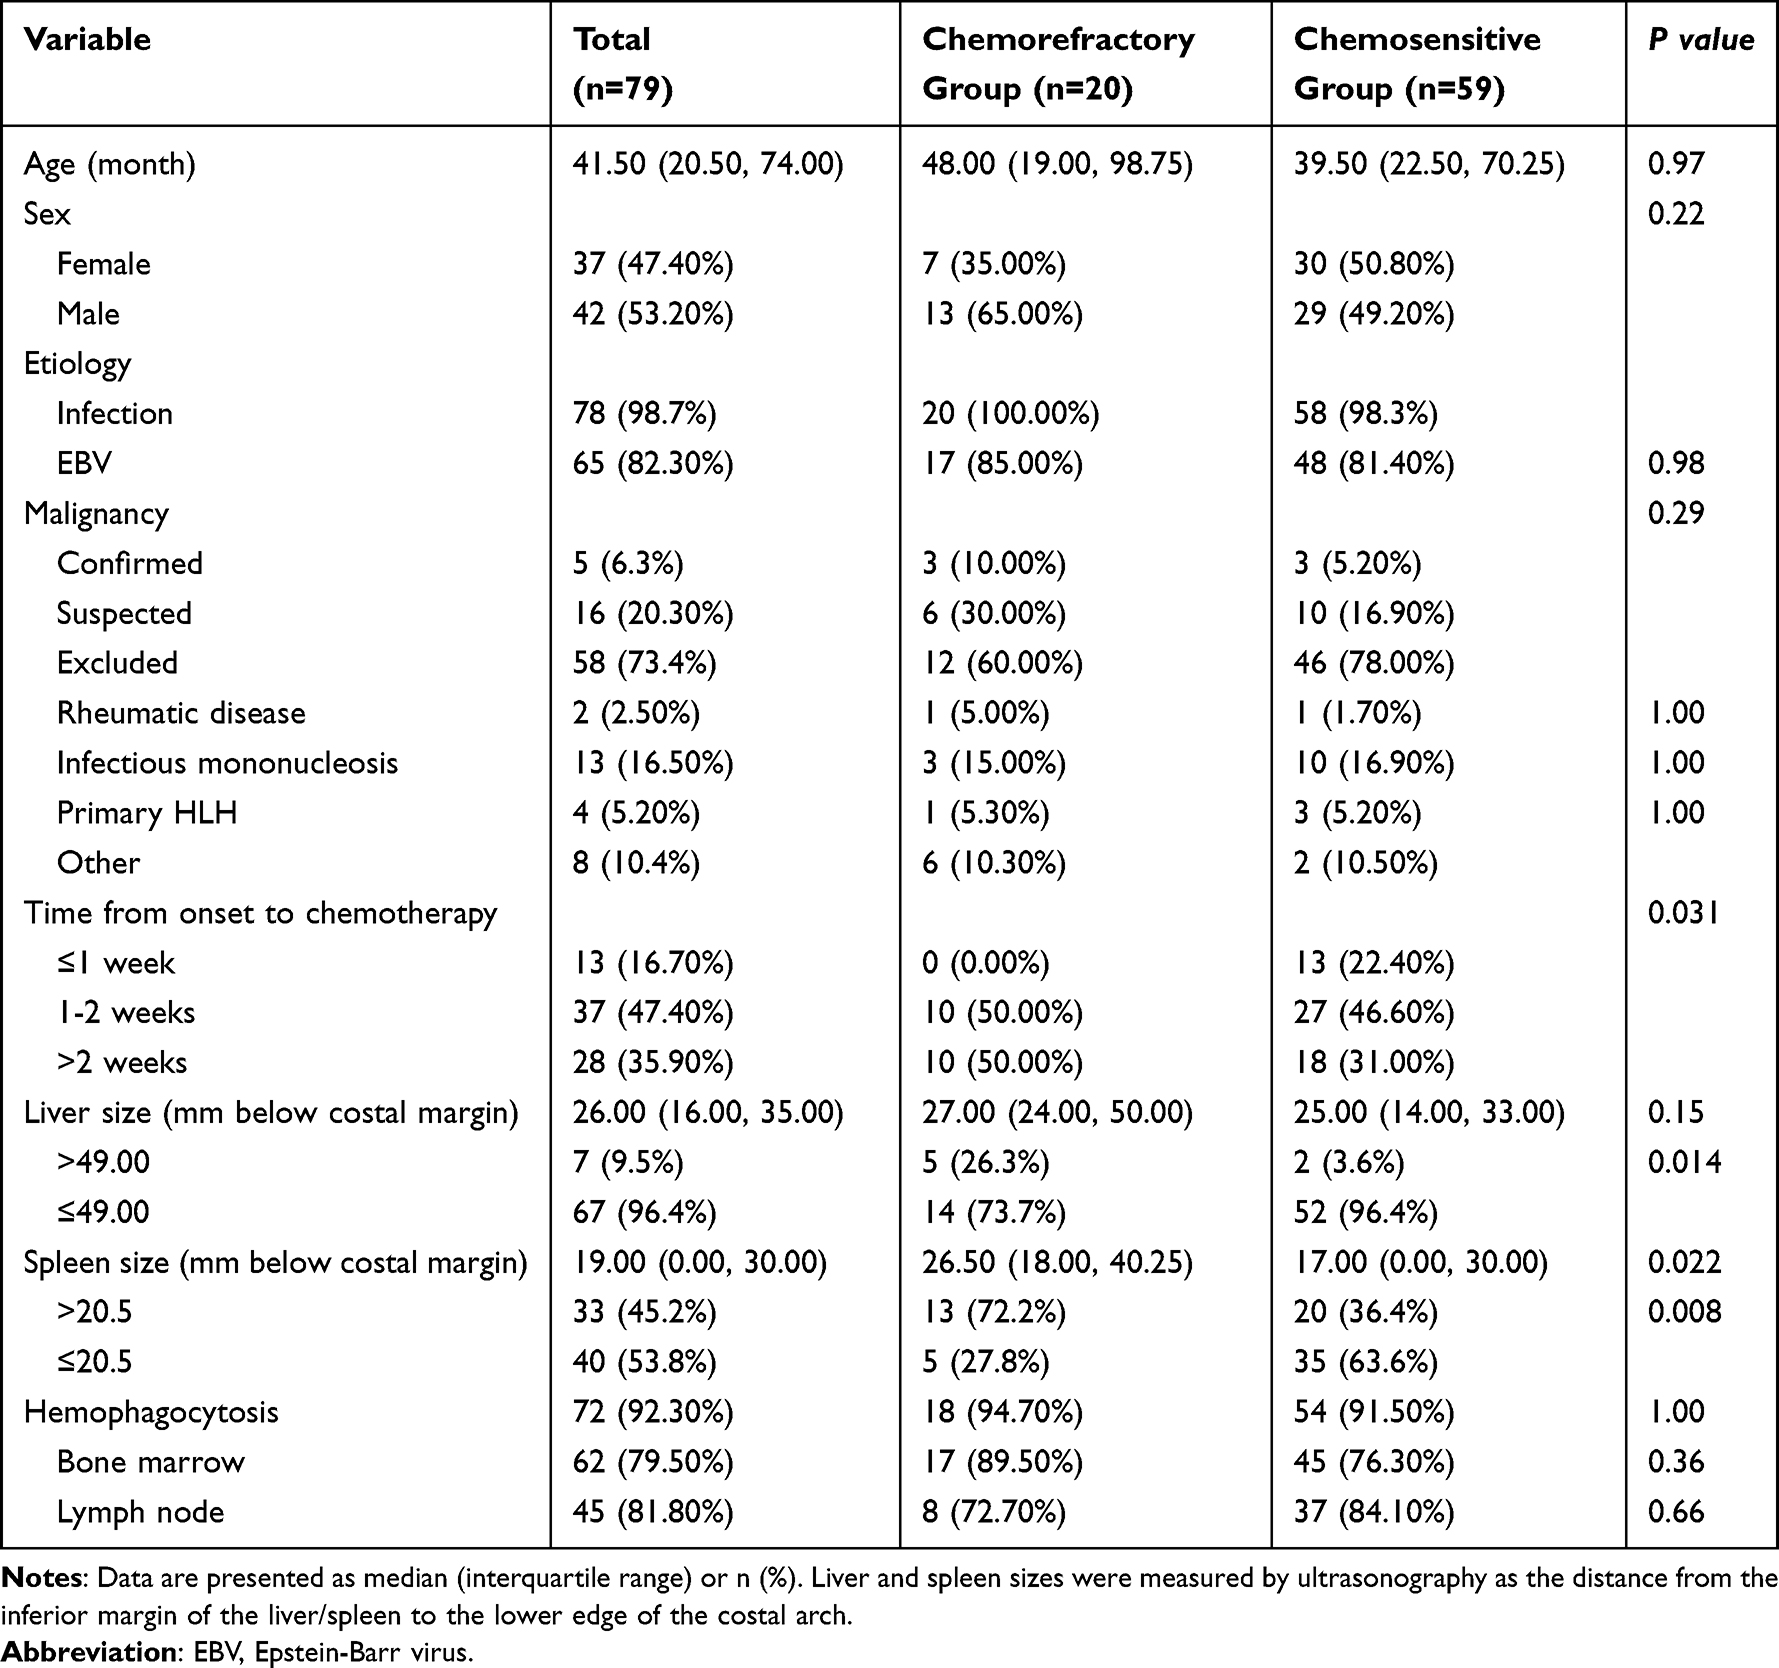 |
Table 1 Analysis of Clinical Characteristics Between Chemorefractory and Chemosensitive Children |
Pre-Chemotherapy IL-10 and Platelet Count: Strong Independent Predictors
Comparison of baseline inflammatory cytokine profiles (including IL-2, IL-4, IL-6, IL-10, IFN-γ, and TNF-α) between the Chemorefractory group and Chemosensitive group revealed a significant difference in serum IL-10 levels (Table 2). The median pre-chemotherapy IL-10 concentration was significantly higher in the refractory group than in the sensitive group (530 μmol/L [IQR 69–2500] vs 98 μmol/L [IQR 30–303], P < 0.001). Receiver operating characteristic (ROC) curve analysis indicated that an IL-10 level >131.2 μmol/L predicted chemotherapy resistance (AUC = 0.72, 95% CI [0.56–0.88]). Further analysis of routine blood parameters showed a significant baseline difference in platelet counts between the two groups. ROC analysis revealed that thrombocytopenia was significantly associated with chemotherapy resistance, with an AUC of 0.76 (95% CI [0.65–0.87]) at a cutoff value of 55.5×10⁹/L. IL-6 and NK cell activity showed no statistically significant differences between the Chemorefractory group and Chemosensitive group (P > 0.05).
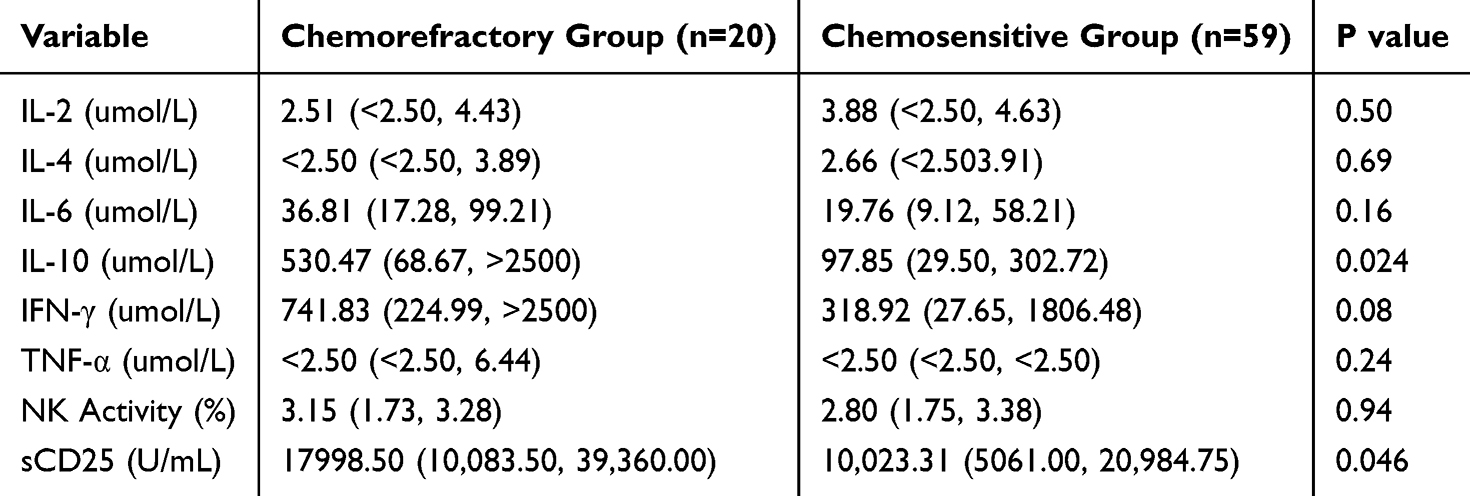 |
Table 2 Comparison of Worst Pre-Chemotherapy Values Between Chemorefractory and Chemosensitive Groups |
Multivariate logistic regression analysis confirmed that both IL-10 (OR = 0.21, 95% CI [0.05–0.90], P = 0.050) and platelet count (OR = 1.014, 95% CI [1.00–1.03], P = 0.036) were independent predictors of chemotherapy resistance (Table 3). A combined model incorporating both IL-10 and platelet count significantly improved predictive performance (AUC = 0.82, 95% CI [0.72–0.93]) (Table 4). These results suggest that the pre-chemotherapy “IL-10–platelet axis” may facilitate early identification of treatment-resistant children with hemophagocytic syndrome.
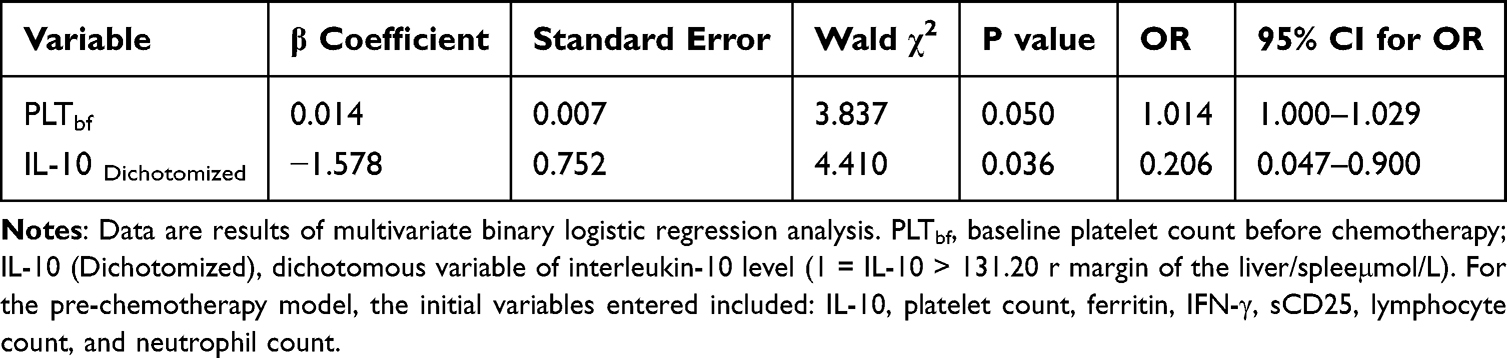 |
Table 3 Binary Logistic Regression Analysis of Platelet Count and IL-10 Dichotomous Variable for Predicting Chemorefractoriness |
 |
Table 4 ROC Analysis of the Combined Predictive Model Using Pre-Chemotherapy Platelet Count and IL-10 |
Day 3 Cell Counts: Early Indicators of Treatment Response
Comparative analysis between the chemorefractory and chemosensitive groups identified consistent differences in platelet and absolute lymphocyte counts (both P < 0.01; Table 5 and Figure 1). To evaluate their predictive utility, we subsequently assessed the discriminatory power of these parameters. As shown in the ROC analysis and AUC heatmap (Table 6 and Figure 2), both indicators showed good predictive value for refractory HLH (AUC > 0.7). Among them, a platelet count <109.5×10⁹/L on day 3 of chemotherapy demonstrated the highest predictive accuracy (AUC = 0.822, 95% [0.723–0.921]). The predictive performance was further improved by combining this with a day 3 lymphocyte count <0.55×10⁹/L (AUC = 0.731, 95% [0.601–0.861]), yielding a combined AUC of 0.845 (sensitivity 89%, specificity 71%) (Tables 7–9). This combined model enables the early identification of children with a poor therapeutic response within 72 hours, providing a critical time window for timely adjustment of treatment strategies.
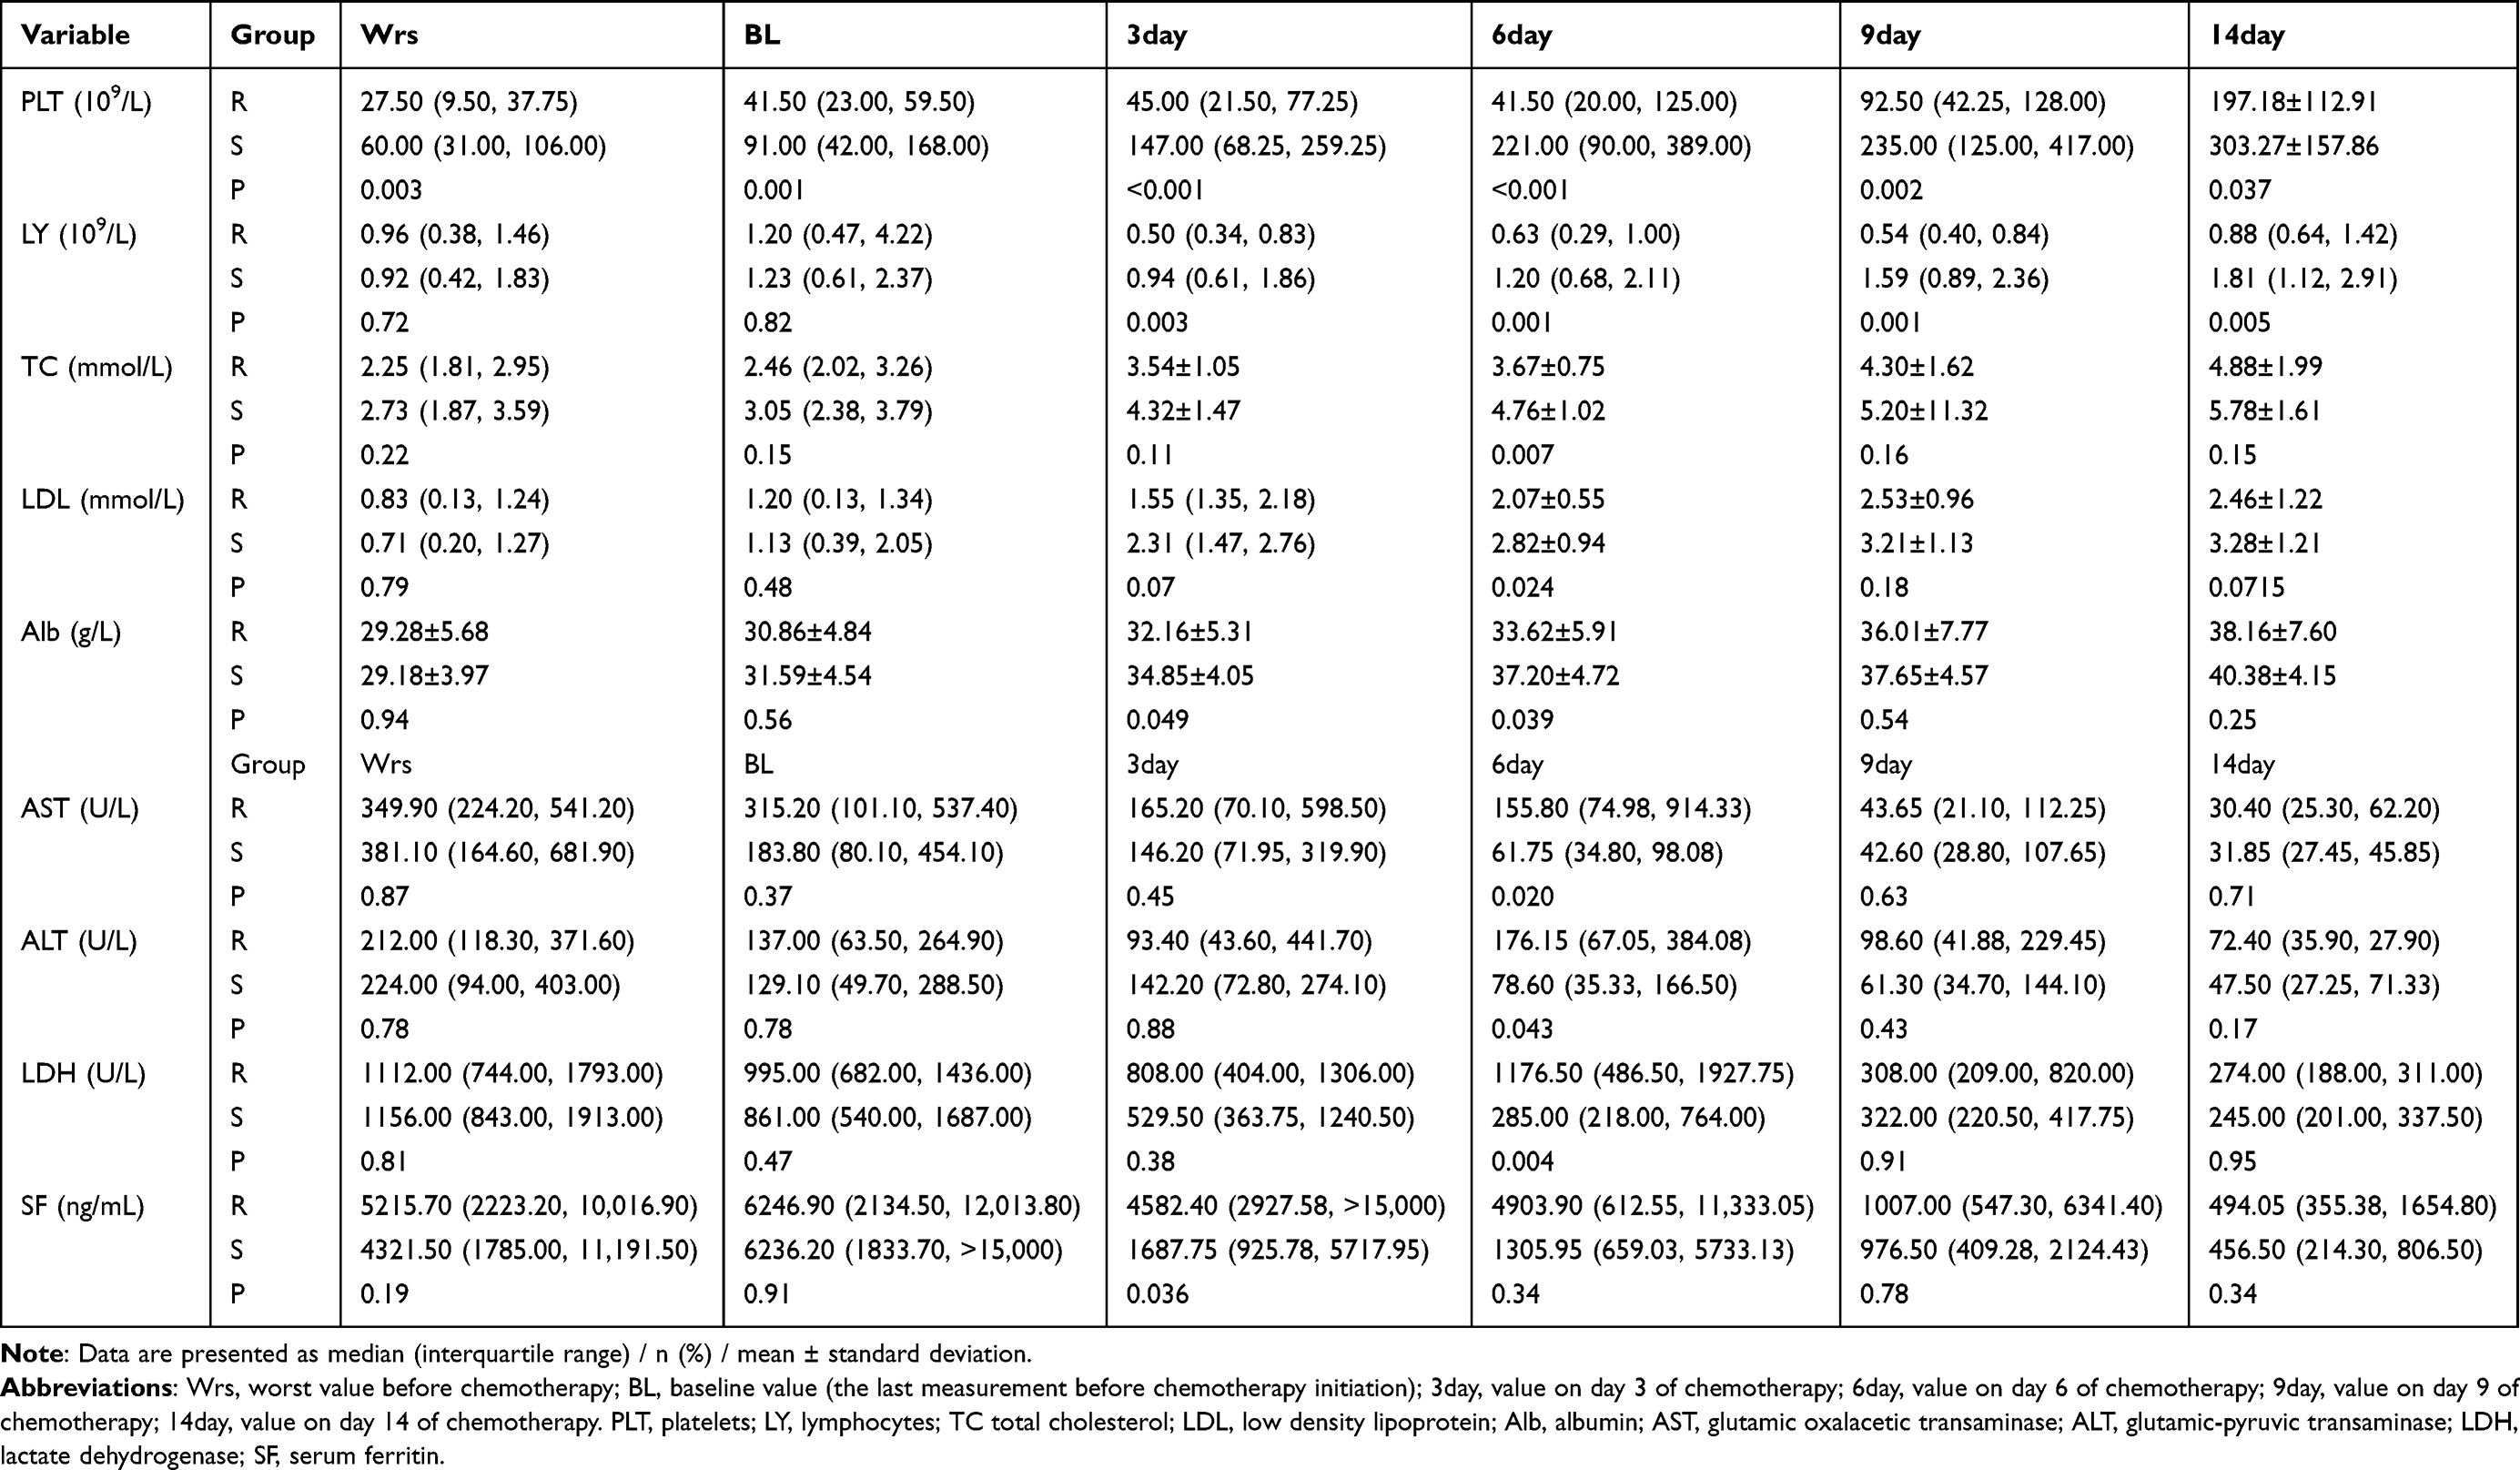 |
Table 5 Pre- and Post-Treatment Parameters: Refractory vs Sensitive Groups |
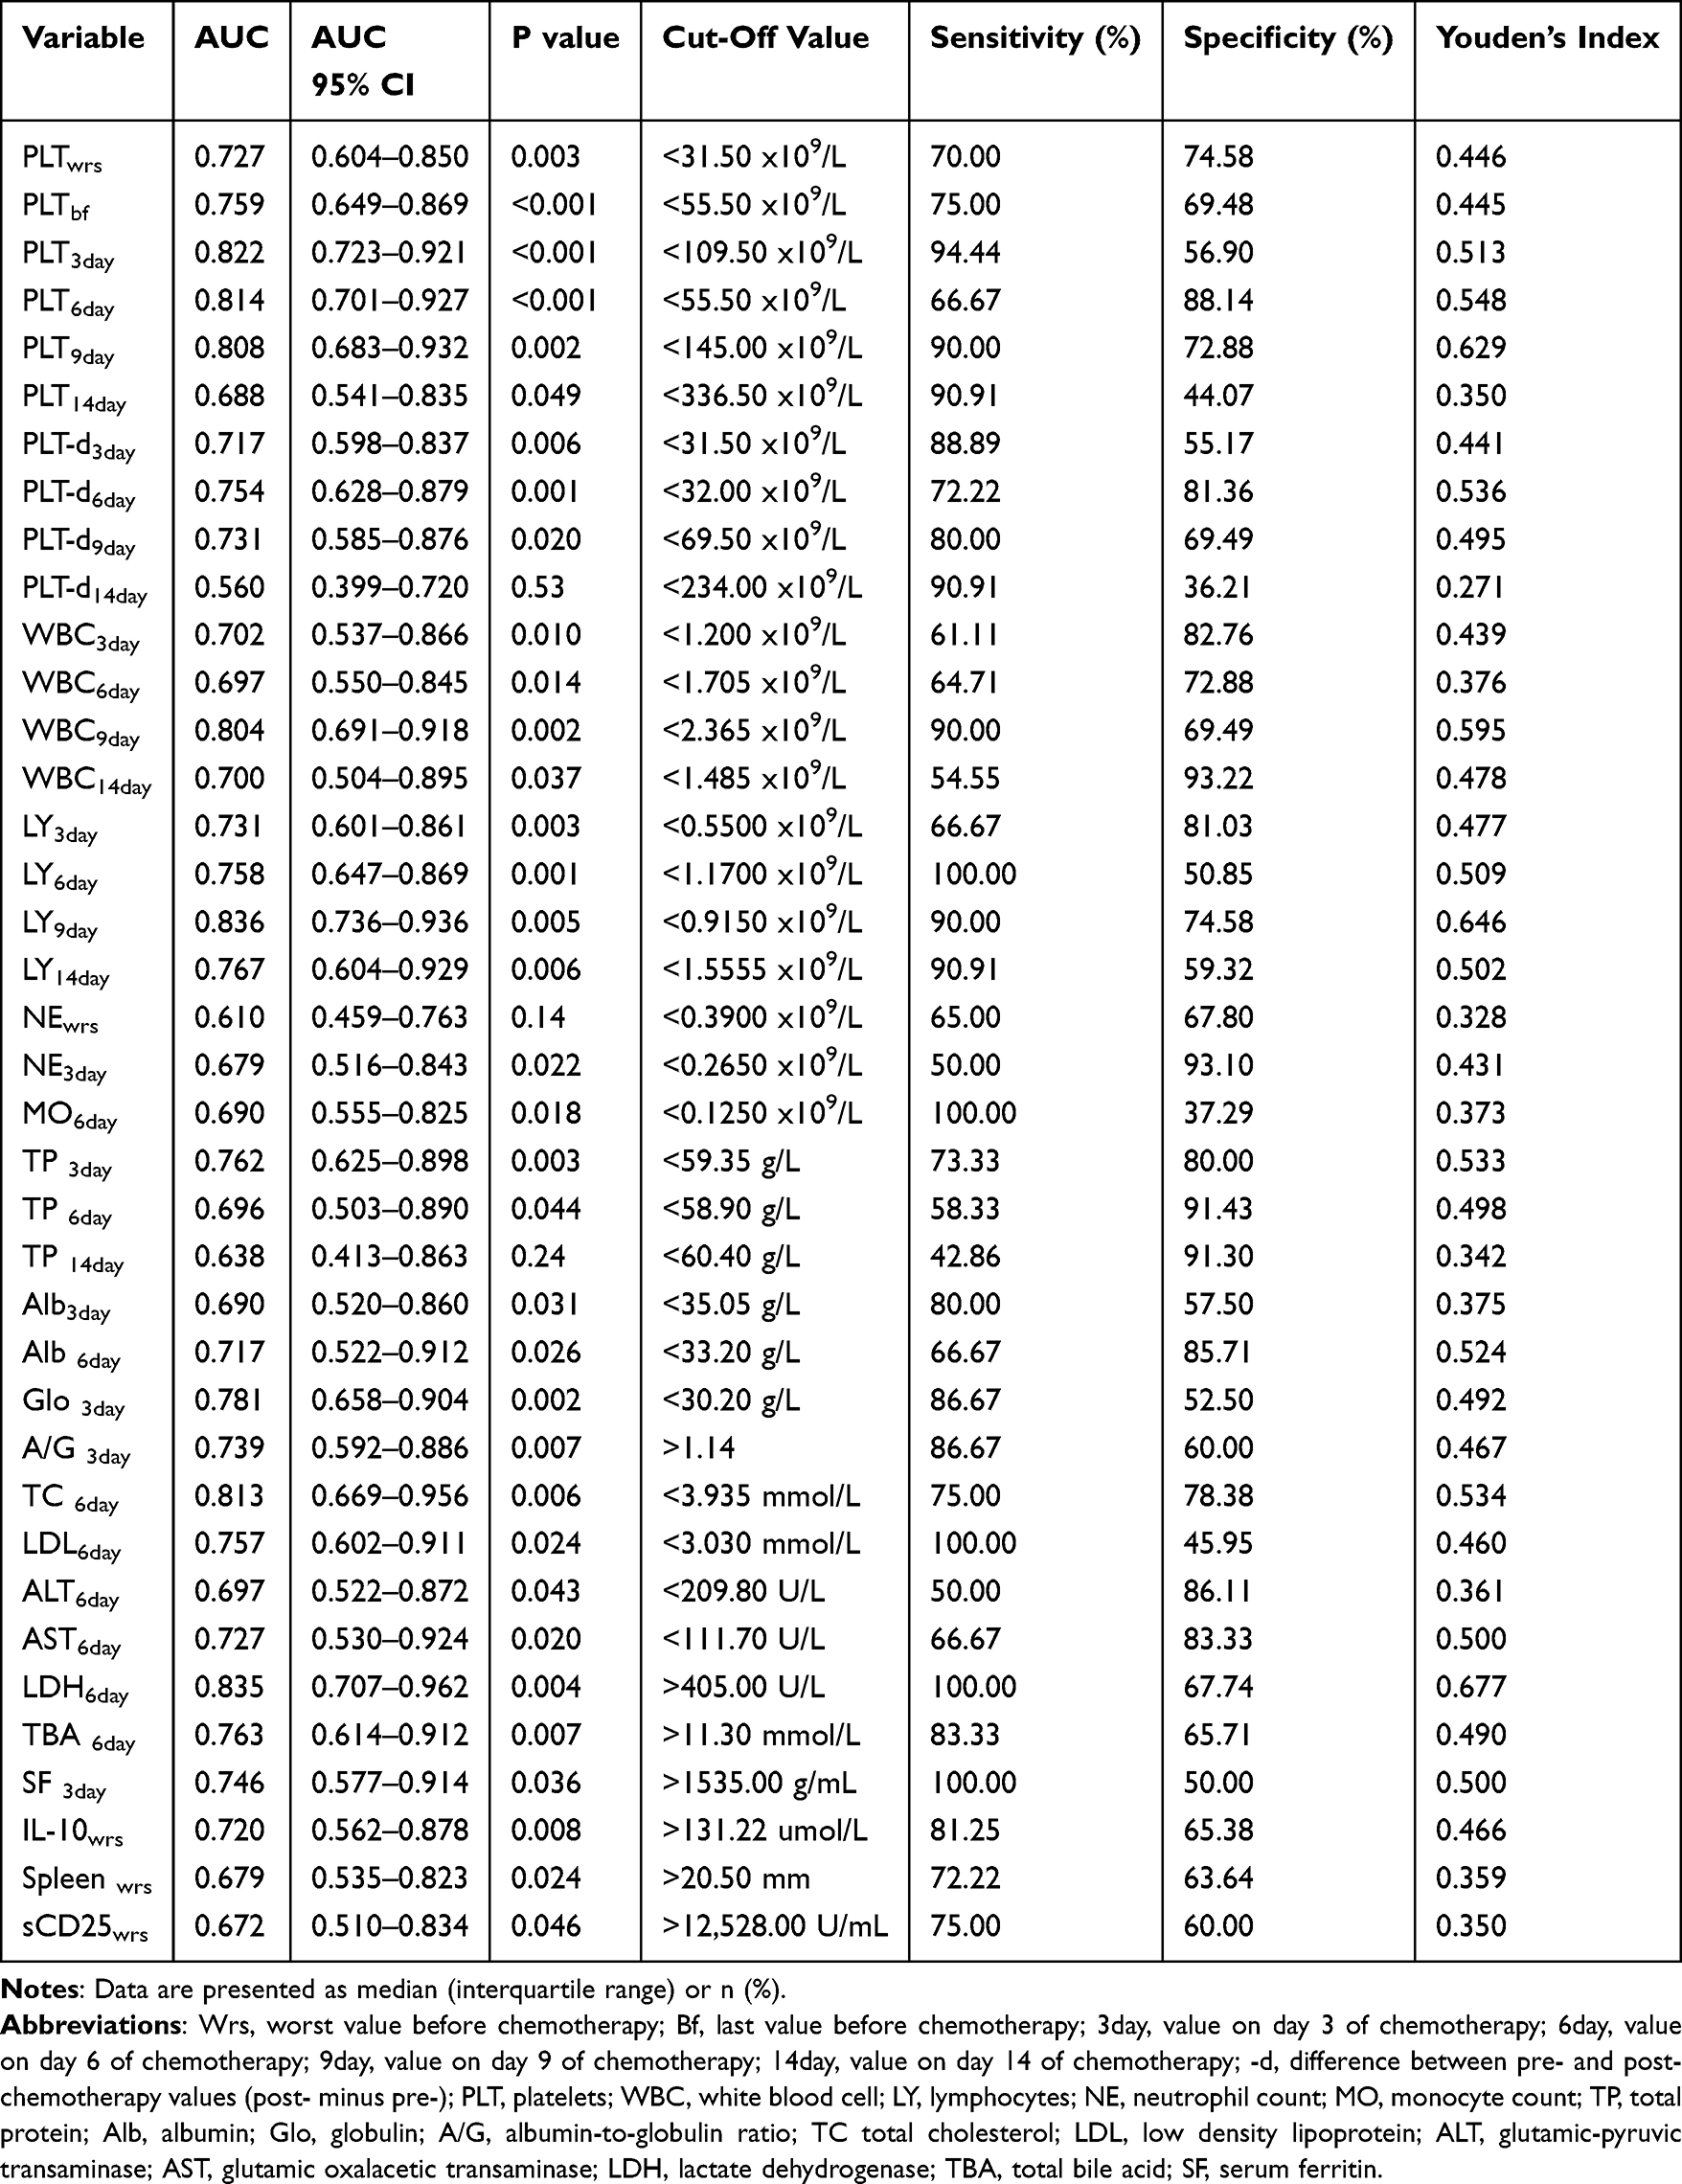 |
Table 6 Predictive Performance of Various Indicators for Etoposide-Resistant HLH |
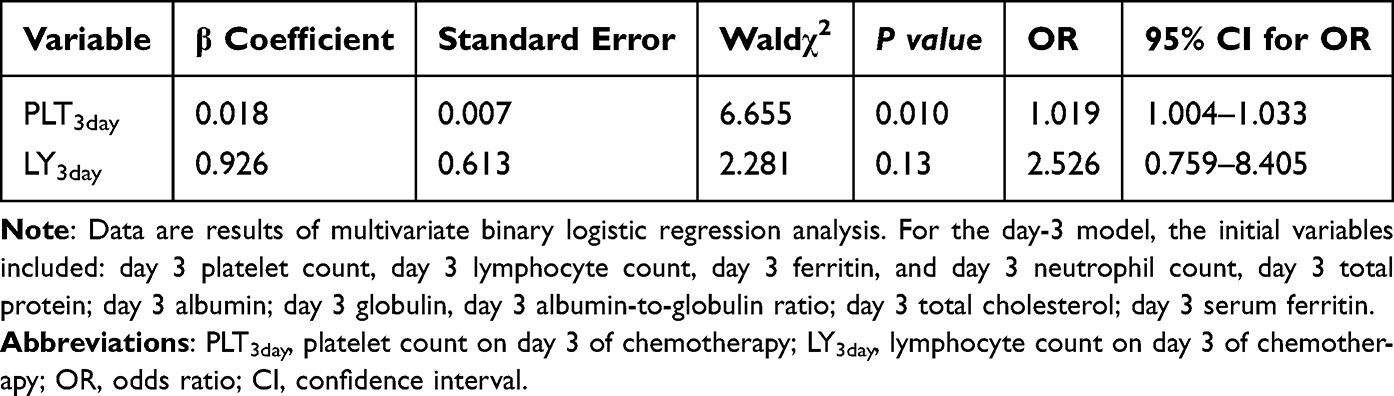 |
Table 7 Binary Logistic Regression Analysis of Day 3 Platelet and Lymphocyte Counts for Predicting Chemorefractoriness |
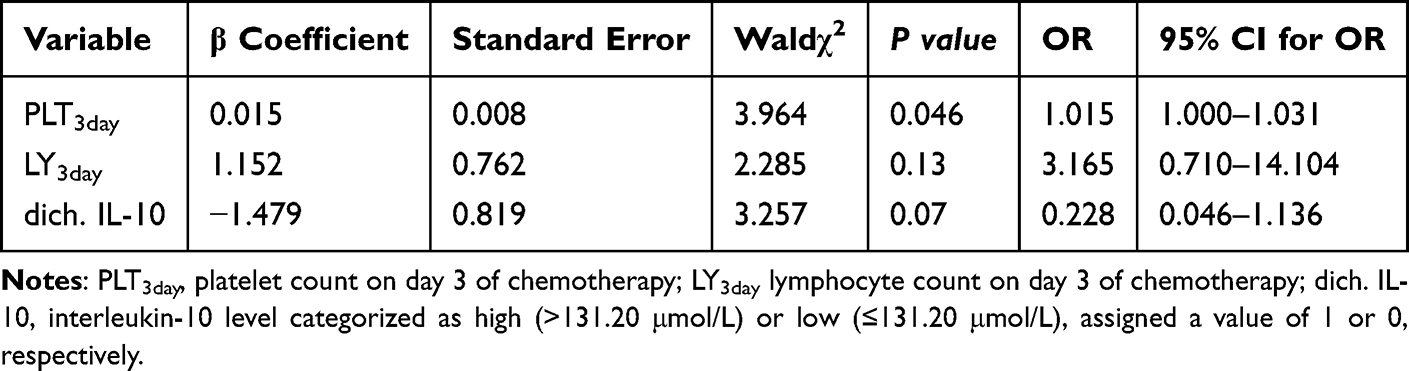 |
Table 8 Binary Logistic Regression Analysis of Pre-Chemotherapy IL-10 and Day 3 Platelet/Lymphocyte Counts for Predicting Chemorefractoriness |
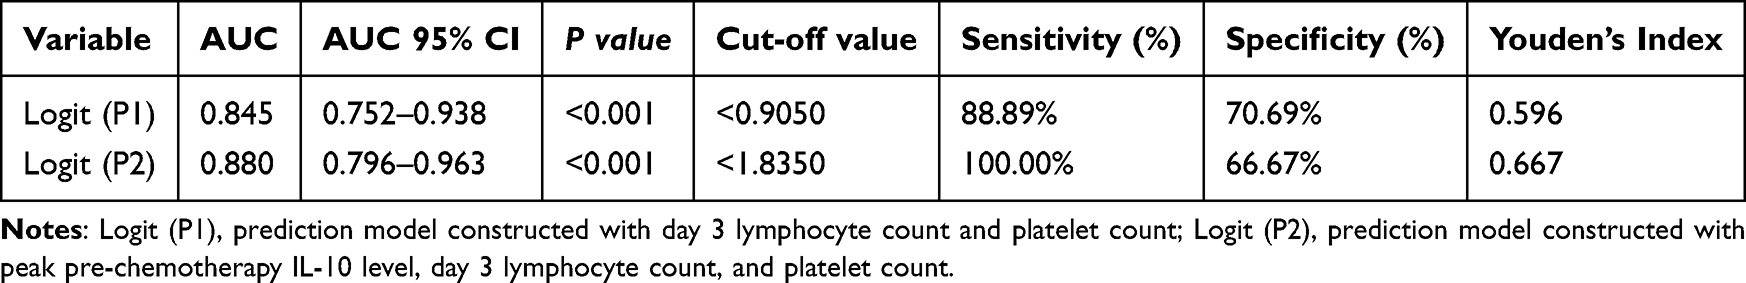 |
Table 9 ROC Analysis of Day 3 Platelet Count, Lymphocyte Count, and Combined Predictive Model |
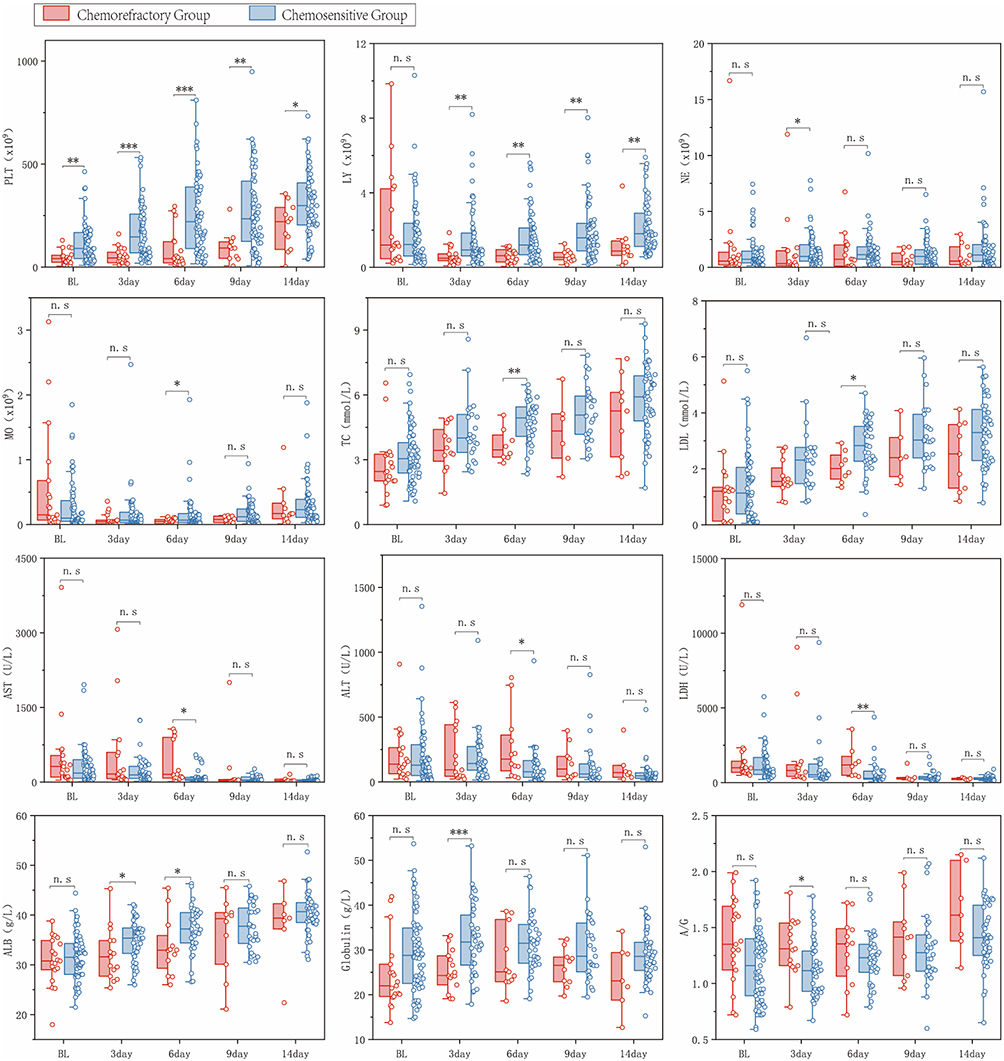 |
Figure 1 Comparison Between the Chemorefractory and Chemosensitive Groups at Different Treatment Stages. Notes: The figure presents box plots (left) with overlaid scatter plots (right) comparing laboratory parameters between the Chemorefractory Group and Chemosensitive Groups before and after treatment. Data are presented as median with inter-quartile range. *P < 0.05, **P < 0.01, ***P < 0.001, n.s. (not significant), P ≥ 0.05. |
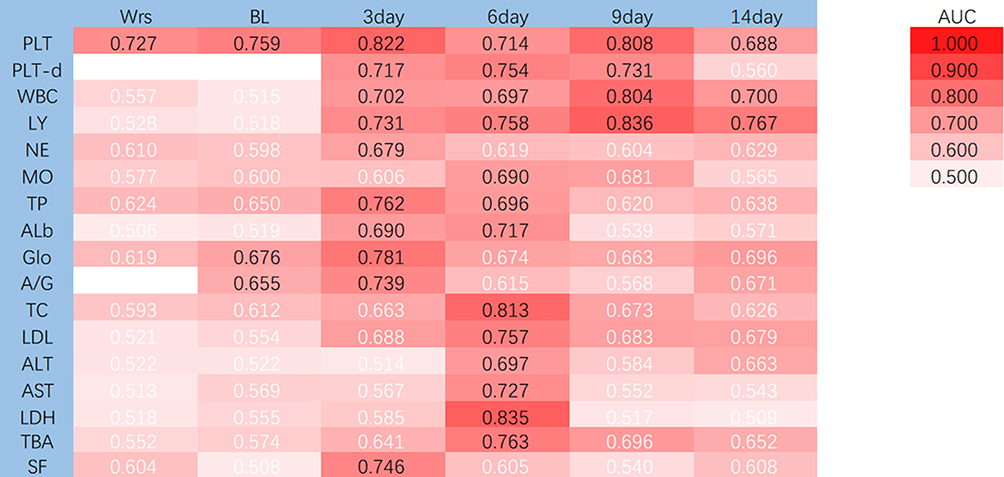 |
Figure 2 Heatmap of the Area Under the Curve (AUC) for Various Indicators. Abbreviations: Wrs, worst value before chemotherapy; Bf, last value before chemotherapy; 3day, value on day 3 of chemotherapy; 6day, value on day 6 of chemotherapy; 9day, value on day 9 of chemotherapy; 14day, value on day 14 of chemotherapy; -d, difference between pre- and post-chemotherapy values (post- minus pre-). Note: White font color indicates P ≥ 0.05. |
Examination of longitudinal ferritin changes revealed a time-dependent effect: while baseline levels were comparable between groups, a significant difference emerged on day 3 post-chemotherapy (P =0.046), with higher levels in the Chemorefractory group. This difference was not sustained at later time points, suggesting that day 3 ferritin may serve as an adjunctive early indicator despite its transient nature.
Interestingly, analysis of liver function-related indicators at various time points revealed that on Day 6 of chemotherapy, the refractory group exhibited a distinct liver function profile characterized by lower total cholesterol, LDL, and albumin, alongside elevated AST and LDH (Table 5): total cholesterol 3.67 mmol/L vs 4.76 mmol/L (P=0.007), low density lipoprotein (LDL) 2.07 vs 2.82 mmol/L (P=0.024), albumin (Alb) 33.6 g/L vs 37.2 g/L (P=0.039); AST 155.80 U/L vs 61.75 U/L (P=0.020), lactate dehydrogenase (LDH) 1176.50 U/L vs 285.00 U/L (P=0.004). ROC curve analysis further confirmed that total cholesterol (AUC=0.813, 95% [0.669–0.956]), LDL (AUC=0.757, 95% [0.602–0.911]), albumin (AUC=0.717, 95% [0.522–0.912]), LDH (AUC=0.835, 95% [0.707–0.962]) demonstrated strong discriminatory ability for chemotherapy-refractory HLH (Table 6). Notably, AST (AUC=0.727, 95% [0.530–0.924]) showed superior discriminatory capacity compared to ALT (AUC=0.697, 95% [0.522–0.872]), currently the standard for HLH treatment efficacy and disease assessment.
IL-10 and 7-Day Mortality: Early Warning
Studies revealed (Tables 1, 2 and 5) IL-10 levels of 530.47 μmol/L vs 97.85 μmol/L (P=0.024), sCD25 17,998.50 U/mL vs 10023.31 U/mL (P=0.046), spleen volume 26.50 mm vs 17.00 mm (P=0.022), Pre-chemotherapy worst platelet count 27.50 × 10⁹/L vs 60.00 × 10⁹/L (P=0.003) and baseline platelet count 41.50 × 10⁹/L vs 91.00 × 10⁹/L (P=0.001), among others, showed pre-chemotherapy differences between the two groups; To determine whether these changes correlated with disease severity, we regrouped the samples: patients dying within 1 week were classified as the early death group (n=6), and patients surviving beyond one week as the non-early death group (73 cases). Comparing these indicators between groups (Table 10) revealed that the median IL-10 level in the early death group was >2500 μmol/L, significantly higher than the median IL-10 level of 107.44 μmol/L in the non-early death group (P=0.034), with a single-marker AUC of 0.763 (sensitivity 83%, specificity 77%) (Table 11), indicating elevated IL-10 as an independent risk factor for early mortality. One-week mortality outcomes correlated with early marker changes. Early screening—particularly within the first week, even before chemotherapy and 1–3 days post-treatment—proves beneficial for assessing patient condition and treatment efficacy.
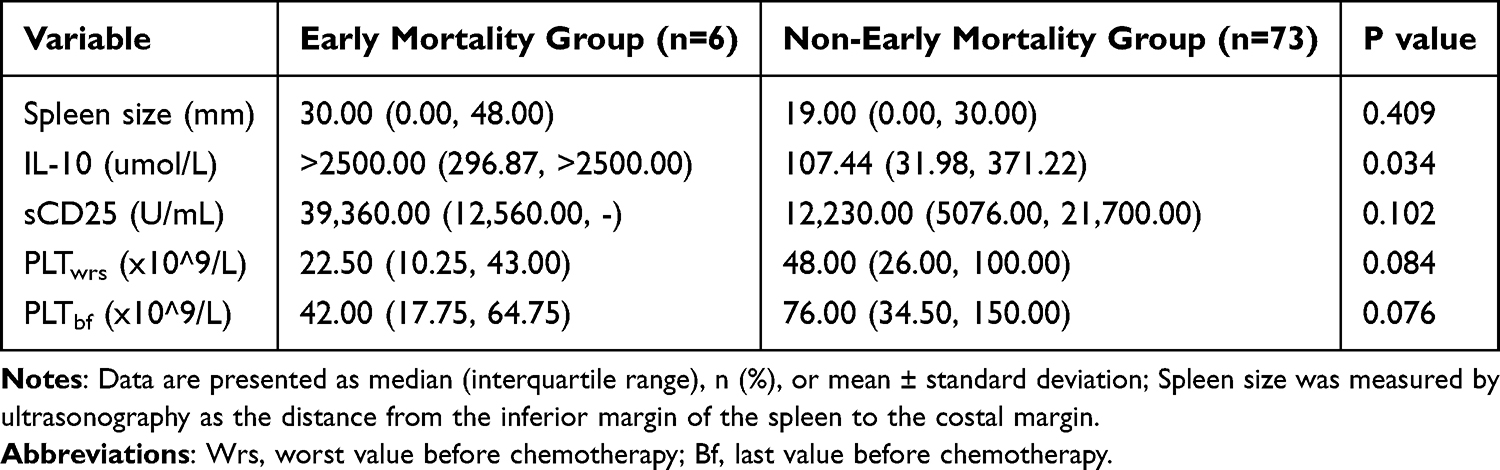 |
Table 10 Analysis of Pre-Chemotherapy Indicators and Their Association with 1-Week Mortality |
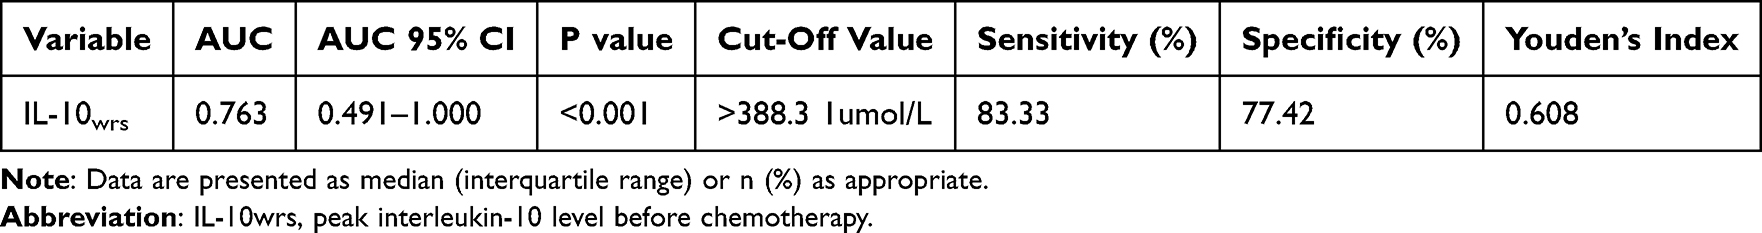 |
Table 11 Predictive Performance of IL-10 for Early Mortality |
Validation of Predictive Models and Clinical Tools
Preliminary data analysis revealed missing data in the chemotherapy-refractory group due to early mortality. To minimize experimental errors caused by missing data while achieving the research objective of early prediction of etoposide-based protocols efficacy, the time points of pre-chemotherapy and Day 3 post-chemotherapy were selected for the predictive model. Following data screening, IL-10 + platelets were ultimately incorporated into the pre-therapy model. Of note, although IFN-γ and sCD25 showed associations in univariate analyses, their explanatory power was weaker than that of IL-10 after adjusting for confounders; to maintain model parsimony and avoid overfitting, they were excluded from the final model. Analysis via ROC curves (Figure 3), calibration curves (Figure 4), and decision curves (Figure 5) demonstrated optimal predictive value for HLH chemotherapy resistance (AUC = 0.822, 95% [0.715–0.930]), confirming the model’s stability and clinical significance. With excellent stability in 1000 Bootstrap resampling iterations (mean AUC 0.761 ± 0.083) (Figure 6).
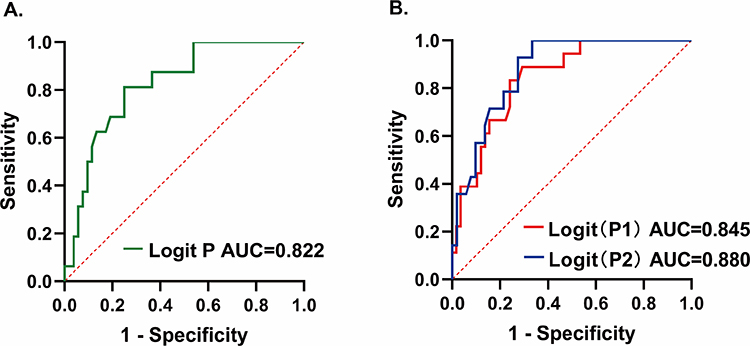 |
Figure 3 Receiver Operating Characteristic (ROC) Curves of the Pre-Chemotherapy and Day-3 Models. (A) Green curve: ROC for the Pre-chemotherapy Model (Maximum IL-10 and Baseline Platelets). (B) Red curve [Logit (P1)]: ROC for the Day-3 Model (Platelet and Lymphocyte Counts). Blue curve [Logit (P2)]: ROC for the Comprehensive Combined Model (Dichotomized IL-10, Day-3 PLT and LY Counts). |
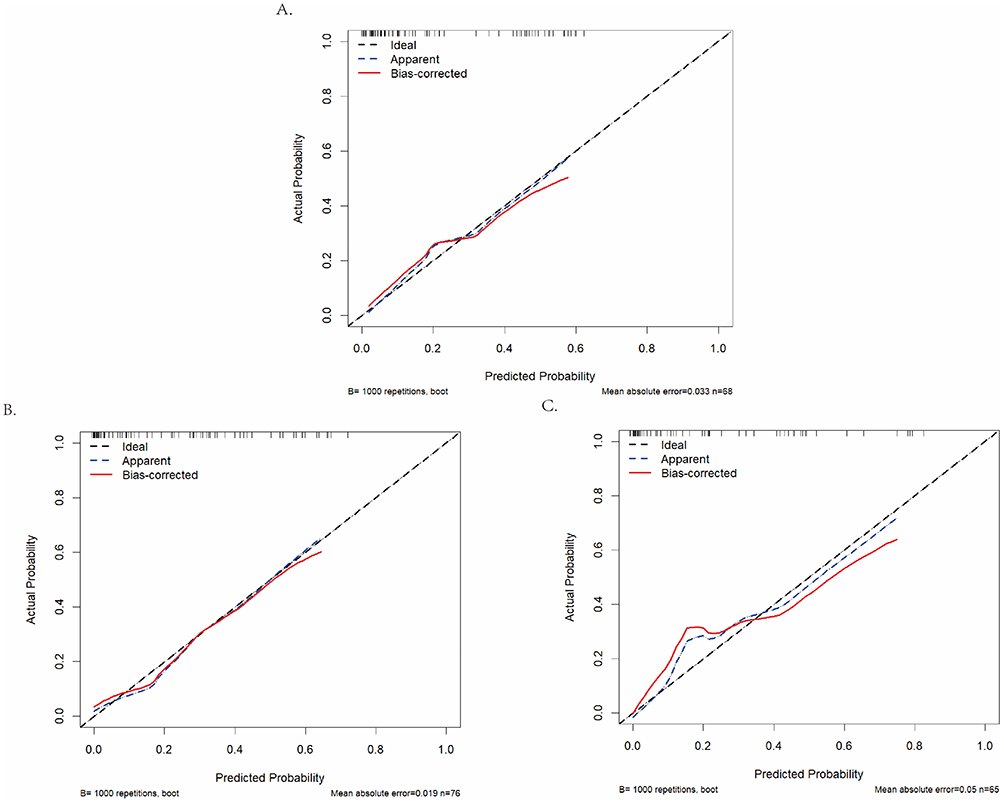 |
Figure 4 Calibration Curves of the Predictive Models. (A) Calibration Curve of the Pre-chemotherapy Combined Model [Maximum IL-10 + Baseline Platelet Count]. (B) Calibration Curve of the Day 3 Combined Model [Platelet Count + Lymphocyte Count]. (C) Calibration Curve of the Comprehensive Combined Model [Dichotomized IL-10 + Day 3 PLT and LY Counts]. |
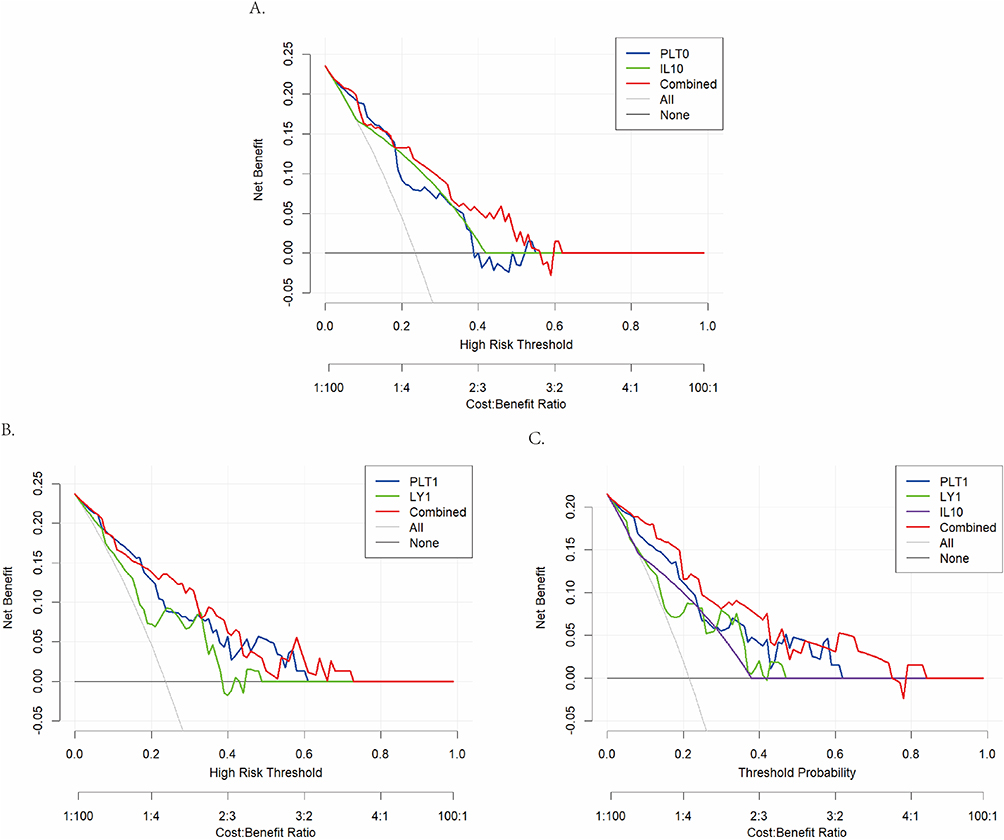 |
Figure 5 Decision Curve Analysis (DCA) of the Predictive Models. (A) Decision Curve Analysis of the Pre-chemotherapy Combined Model [Maximum IL-10 + Baseline Platelet Count]. (B) Decision Curve Analysis of the Day 3 Combined Model [Platelet Count + Lymphocyte Count]. (C) Decision Curve Analysis of the Comprehensive Combined Model [Dichotomized IL-10 + Day 3 PLT and LY Counts]. |
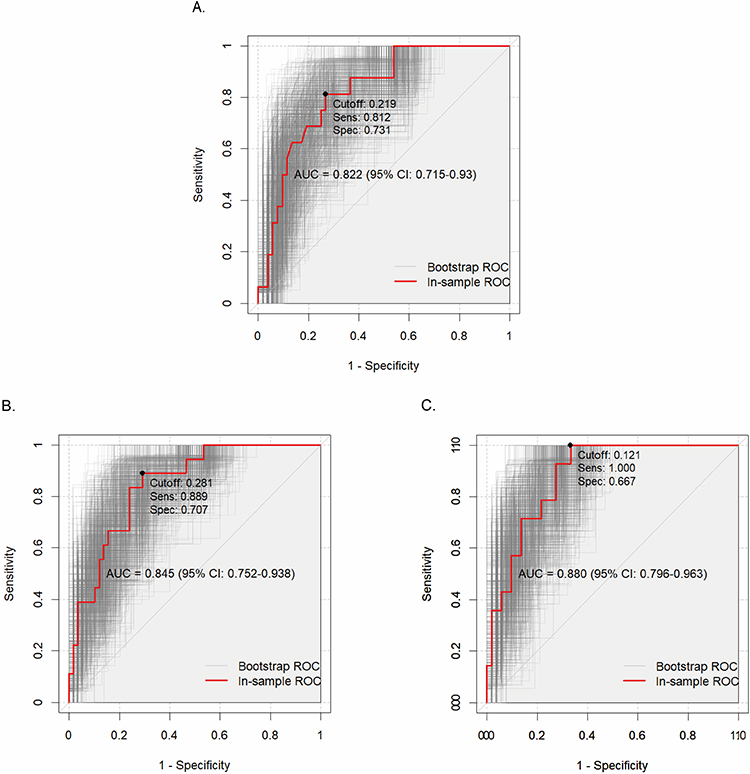 |
Figure 6 Internal Validation of the Predictive Models Using Bootstrap Resampling. (A) Internal Validation ROC Curve of the Pre-chemotherapy Model (Maximum IL-10 and Baseline Platelets). (B) Internal Validation ROC Curve of the Day-3 Model (Platelet and Lymphocyte Counts). (C) Internal Validation ROC Curve of the Comprehensive Combined Model (Dichotomized IL-10, Day-3 PLT and LY Counts). In each panel, the red curve represents the ROC curve of the training set, and the gray curves represent ROC curves generated from each bootstrap sample. The displayed AUC value, 95% confidence interval (95% CI), optimal cutoff, sensitivity (Sens), and specificity (Spec) correspond to the parameters of the training set ROC curve (red). |
The combined model of Day 3 post-chemotherapy platelets (PLT) and lymphocytes (LY) demonstrated good predictive performance (AUC = 0.845, 95% [0.752–0.938] sensitivity 88.89%, specificity 70.69%) (Table 9). Considering IL-10’s predictive value for refractory patients, particularly those at early mortality risk, a new day-3 model (platelet + lymphocyte ± IL-10) was constructed by adding pre-chemotherapy IL-10 > 131.2 μmol/L (AUC = 0.72, 95% [0.562–0.878]) to the prior model (PLT + LY prediction model) (Table 8). This enhanced predictive performance (AUC = 0.880, 95% [0.796–0.963], sensitivity 100%, specificity 66.67%) (Table 9). The decision curve demonstrated significant net benefit within the 0.1–0.7 threshold range, with excellent stability after 1000 Bootstrap resamples (mean AUC 0.837 ± 0.085) (Figure 6).
Pre-therapy model = 0.947 + 0.014 × XPLT-bf - 1.578 × XIL-10 binary classification
Day-3 model = −0.377 + 0.015 × XPLT-3day + 1.152 × XLY-3day - 1.479 × XIL-10 binary classification
To visualize the predictive model for clinical application, a model column chart integrating the three indicators was created using R Studio (Figure 7). This enables real-time bedside risk calculation, facilitating implementation in primary care settings.
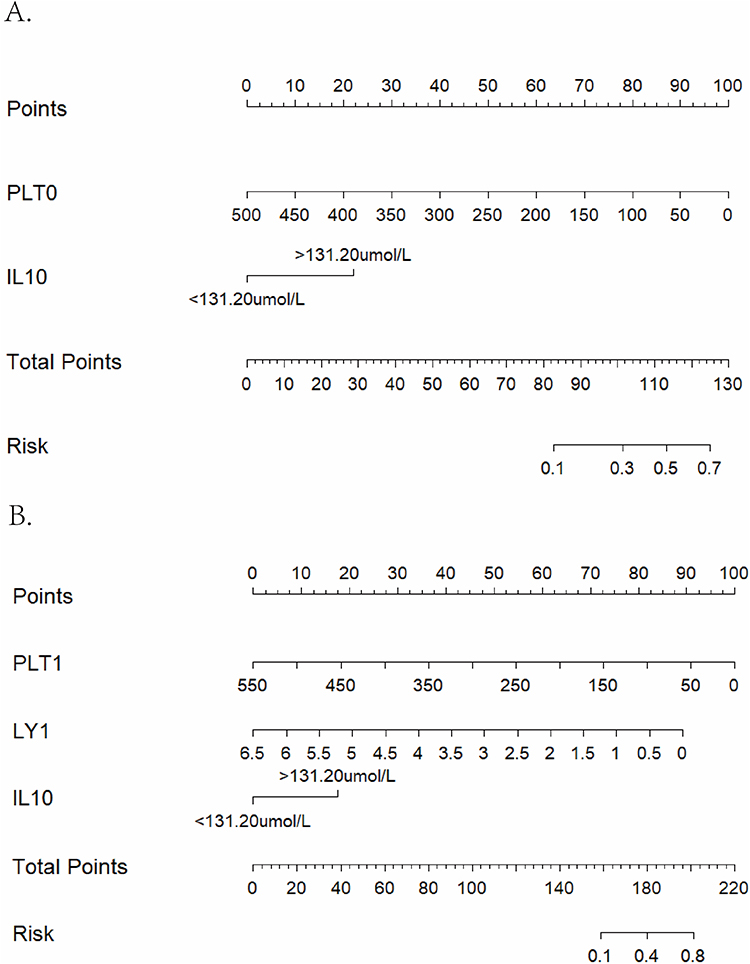 |
Figure 7 Nomogram of Prediction Models Constructed with Pre-Chemotherapy and Day 3 Indicators. (A) Nomogram of the pre-chemotherapy combined model [maximum IL-10 + baseline platelet count]. (B) Nomogram of the comprehensive combined model [dichotomized IL-10 + day 3 PLT and LY counts]. |
Discussion
Although etoposide-based protocols remain the primary cornerstone treatment for HLH. In children,18 primary resistance19 and early mortality persist as stubborn challenges in clinical practice. Our study observed a significantly longer interval from onset to chemotherapy in the refractory group, attributed to a combination of disease severity, early diagnostic challenges, and referral pathways. However, this starkly reveals a key paradox: the sickest children, who require urgent treatment the most, are paradoxically those most likely to experience treatment delays and miss the optimal therapeutic window.
Based on continuous observation of a retrospective cohort of 79 pediatric patients, this study first identified that pre-chemotherapy IL-10 > 131.2 μmol/L combined with platelets < 55.5 × 10⁹/L independently predicted resistance risk, with an AUC of 0.822. Furthermore, incorporating IL-10 >131.2 μmol/L (AUC=0.72, 95% [0.562–0.878]) into the two dynamic indicators on Day 3 of chemotherapy— “platelet count <109.50×10⁹/L” and “lymphocyte count <0.55×10⁹/L”—elevated model performance to 0.880. Both Bootstrap internal validation and decision curve analysis demonstrated stable clinical net benefit. This study compressed the traditional 2-week efficacy evaluation window to 72 hours, providing a feasible pathway for early precision intervention. Importantly, all parameters included in our models, including IL-10, platelet count, and lymphocyte count, are routine laboratory tests. Platelet and lymphocyte counts are standard components of the complete blood count, universally available in all hospitals. IL-10 measurement, while not available in every primary care setting, is routinely performed in most tertiary referral centers where HLH patients are typically managed. For settings where IL-10 is unavailable, the combination of day 3 platelet and lymphocyte counts alone offers a practical alternative with robust predictive performance (AUC = 0.845).
Elevated IL-10 level is an adverse prognostic factor in HLH.20,21 Notably, elevated IL-10 not only precedes classic pro-inflammatory factors like IFN-γ and TNF-α but also exhibits a significant negative correlation with platelet count. This suggests it may not merely function as a negative feedback protector22 but could amplify the inflammatory storm by inhibiting NK cell cytotoxicity and antigen presentation. This finding strongly aligns with Tang et al’s14 mouse model demonstrating IL-10/IL-18 synergistic induction of lethal HLH, providing clinical screening rationale for future IL-10 blockade therapy.
The prognostic value of IL-10 extended beyond treatment resistance to early mortality. In our cohort, patients who died within the first week of treatment had markedly higher IL-10 levels (>2500 μmol/L) compared to those who survived (107.44 μmol/L, P=0.034), with IL-10 alone predicting 7-day mortality with an AUC of 0.763. This finding reinforces the central role of IL-10 as a marker of disease severity in pediatric HLH, consistent with previous studies identifying elevated IL-10 as an adverse prognostic factor in both adult and pediatric populations.20,21 The observation that IL-10 predicts both etoposide resistance and early mortality suggests that extreme IL-10 elevation may identify a subset of patients at imminent risk of death who require immediate, aggressive intervention beyond standard therapy. This further supports the clinical utility of IL-10 as a key biomarker for ultra-early risk stratification.
Equally noteworthy are platelet dynamics. A lower platelet count was inversely associated with mortality in secondary HLH.23 Although bone marrow hemophagocytosis did not differ between refractory and responsive cases—contrary to the traditional belief that thrombocytopenia results from inadequate marrow production—our study shifts the focus to peripheral mechanisms.16,24,25 This is further supported by the markedly restricted platelet recovery observed by day 3, suggesting peripheral consumption (eg, in microthrombosis or DIC) as the primary mechanism rather than bone marrow failure. Combined with the fact that platelet α-granule PF4 further amplifies inflammation,15 we hypothesize that IL-10-PF4-platelet interactions form a vicious cycle accelerating the storm, providing theoretical support for combined antiplatelet or anticoagulant targeted therapy.
Concurrently, lymphocytes exhibited a “deep trough” as early as day 3 of chemotherapy, persisting until day 14. This not only reflects etoposide’s cytotoxic effects but may also indicate limited hematopoietic stem cell repair capacity or underlying DNA repair defects. This early bone marrow suppression signal aligns closely with the “7-day recovery delay” pattern reported by Verkamp et al13 Dziedzic et al reported that low lymphocyte count at diagnosis predicts mortality in adult HLH, consistent with our finding that lymphocyte dynamics serve as important prognostic indicators in children. Building on these observations, our study further demonstrates that lymphocyte assessment at a specific early time point—day 3 of chemotherapy—provides valuable prognostic information for identifying children at risk of etoposide resistance. We observed that a day 3 lymphocyte count <0.55×10⁹/L strongly predicted treatment failure (AUC=0.731), extending the utility of lymphocyte monitoring from baseline assessment to the critical early treatment window.26
Etoposide exerts its therapeutic effect in HLH by selectively ablating activated T cells,18 which are the primary drivers of hyperinflammation and an important source of IL-10 production.27 Consistent with this mechanism, the refractory group with poor outcomes in our cohort had significantly higher baseline IL-10 levels and exhibited more profound lymphocyte depletion by day 3 of chemotherapy, confirming that etoposide achieved its target inhibitory effect. Paradoxically, however, this effective target engagement did not translate into favorable outcomes but was instead associated with poor prognosis. One possible explanation is that treatment-induced rapid, large-scale T cell death may trigger tumor lysis syndrome-like inflammatory sequelae,28 generating a secondary wave of inflammation that counteracts the therapeutic benefit. These proposed mechanisms remain speculative. Whether these associations reflect direct mechanistic interactions or merely mark a particularly severe disease phenotype warrants further investigation. These proposed mechanisms remain speculative. Whether these associations reflect direct mechanistic interactions or merely mark a particularly severe disease phenotype warrants further investigation.
At the metabolic level, this study found that refractory patients on day 6 of chemotherapy exhibited a distinct profile of lower total cholesterol, LDL, and albumin, accompanied by significantly higher AST and LDH. This combination represents not isolated laboratory abnormalities but a comprehensive decompensation signal of the “mitochondrial-liver-lipid metabolism axis” under acute inflammatory storm in HLH.29,30 First, both cholesterol (especially LDL) and albumin are synthesized by hepatocytes. Severe hepatic dysfunction impairs serum total cholesterol and LDL synthesis, leading to rapid depletion.9 Concurrently, capillary leakage and impaired hepatic synthesis further deplete albumin.31,32 Second, AST is primarily localized in hepatocyte mitochondria, while ALT resides in the cytoplasm. When microthrombi and oxidative stress cause mitochondrial membrane rupture, AST elevation often exceeds that of ALT, forming a “mitochondrial-type” liver injury pattern.33 Recent studies have collectively demonstrated that elevated levels of ALT and AST are associated with adverse clinical outcomes.34,35 More specifically, an elevated AST/ALT ratio has been identified as a significant prognostic factor, correlating with poorer overall survival in adult patients with hemophagocytic lymphohistiocytosis (HLH).33 This study observed that AST demonstrated superior predictive ability for chemotherapy resistance compared to ALT in the refractory group, alongside abnormalities in total cholesterol and LDL metabolism, suggesting hepatocyte mitochondrial injury. Furthermore, elevated LDH reflects disrupted cell membrane integrity and enhanced glycolysis,36 jointly forming a comprehensive indicator of systemic metabolic exhaustion alongside decreased cholesterol. Therefore, integrating total cholesterol, LDL, albumin with AST, ALT, and LDH provides a more sensitive detection of early organ dysfunction, offering a metabolic basis for initiating personalized interventions within 72 hours.
A notable finding was that ferritin, a cornerstone marker for HLH diagnosis and treatment monitoring,35,37,38 also demonstrated significant predictive value (AUC=0.746, 95% [0.577–0.914]). However, it was ultimately excluded from the final model due to statistical instability from small subgroup sample sizes and inconsistent re-evaluation timepoints in clinical practice, which led to substantial missing data. Despite this, its early trend remains clinically valuable for monitoring.
Taken together, our study developed and validated two predictive models that offer practical advantages for clinical implementation. The principal strength of these models lies in its immediate feasibility for widespread adoption, as it relies exclusively on existing, guideline-mandated laboratory parameters, incurring no additional operational or financial burdens. Limitations of this study include its single-center, retrospective design and relatively limited sample size, which may introduce selection bias and affect the stability of estimates, particularly for key indicators like day 3 IL-10 with high missing data rates. Most importantly, the predictive model awaits external validation in multicenter, prospective cohorts to confirm its generalizability and real-world clinical utility.
Conclusion
This study developed and validated a novel “two-step” prediction strategy that seamlessly integrates into the current HLH-94/2004 treatment workflow, enabling early and dynamic risk stratification. The first step, applicable at diagnosis, utilizes a combination of IL-10 > 131.2 μmol/L and platelet count < 55.5 × 10⁹/L which are both routine tests, to identify high-risk patients without requiring additional resources. The second step employs a bedside nomogram at the 72-hour post-chemotherapy mark, incorporating dynamic changes in platelet count and the absolute lymphocyte count to generate individualized risk probabilities. This approach allows for the potential initiation of targeted salvage therapy within a critical window and avoiding the typical two-week therapeutic delay.
Data Sharing Statement
The datasets generated and/or analyzed during the current study are not publicly available due to patient privacy and confidentiality concerns but are available from the corresponding author upon reasonable request. The statistical analyses were performed using R (version 4.3.1; R Foundation for Statistical Computing) and SPSS (version 25.0; IBM Corp.) and other publicly available software. For data access inquiries, please contact Xiulan Lu ([email protected]).
Ethics Approval and Consent to Participate
The study protocol was approved by the institutional ethics committee of Hunan Children’s Hospital (Approval No. HCHLL-2018). All procedures were performed in accordance with the 1964 Declaration of Helsinki (as revised in 2013). The requirement for written informed consent was waived by the committee due to the retrospective nature of the study and the use of de-identified data.
Consent for Publication
Not applicable. The requirement for separate written informed consent for publication was also waived by the ethics committee for the reasons stated above.
Acknowledgments
The authors are grateful to the Department of Pediatric Emergency Center and the Department of Hematology and Oncology of Hunan Children’s Hospital for their administrative support and for providing access to the clinical data. We also extend our sincere appreciation to all the patients and their families whose data were used in this retrospective study.
Funding
This work was supported by grants from the Natural Science Foundation of Hunan Province (No. 2023JJ40351 and No. 2023JJ30324). Health Commission of Hunan Province (NO. B202217018341 and NO.R2023156).
Disclosure
The authors report no conflicts of interest in this work.
References
1. Al-Samkari H, Berliner N. Hemophagocytic lymphohistiocytosis. Ann Rev Pathol. 2018;13(1):27–18. doi:10.1146/annurev-pathol-020117-043625
2. Janka GE. History of hemophagocytic lymphohistiocytosis [M]. Cytokine Storm Syndr. 2024;9–19.
3. Janka GE. Familial hemophagocytic lymphohistiocytosis. Eur J Pediatr. 1983;140(3):221–230. doi:10.1007/BF00443367
4. Bergsten E, Horne A, Aricó M, et al. Confirmed efficacy of etoposide and dexamethasone in HLH treatment: long-term results of the cooperative HLH-2004 study. Blood. 2017;130(25):2728–2738. doi:10.1182/blood-2017-06-788349
5. Canna SW, Marsh RA. Pediatric hemophagocytic lymphohistiocytosis. Blood. 2020;135(16):1332–1343. doi:10.1182/blood.2019000936
6. Chinese Physician Association, Hematology Branch, Chinese Medical Association, Pediatrics Society, Hematology Group, China Expert Alliance on Hemophagocytic Syndrome. Chinese guidelines for the diagnosis and treatment of hemophagocytic syndrome (2022 version). Nat Med J China. 2022;102(20):1492–1499. in Chinese.
7. Li Q, Yang MH. Stratified therapy for hemophagocytic syndrome in children. Chin J Pediatric Emerg Med. 2024;31(11):812–817. in Chinese.
8. Hao L, Ren J, Zhu Y, et al. Elevated interleukin-10 levels are associated with low platelet count and poor prognosis in 90 adult patients with hemophagocytic lymphohistiocytosis. Int Arch Allergy Immunol. 2023;184(4):400–408. doi:10.1159/000528349
9. Cheng W, Wang L, Gao X, et al. Prognostic value of lipid profile in adult hemophagocytic lymphohistiocytosis. Front Oncol. 2023;13. doi:10.3389/fonc.2023.1083088
10. Kaito K, Kobayashi M, Katayama T, et al. Prognostic factors of hemophagocytic syndrome in adults: analysis of 34 cases. Eur J Haematol. 1997;59(4):247–253. doi:10.1111/j.1600-0609.1997.tb00984.x
11. La Rosée P, Horne A, Hines M, et al. Recommendations for the management of hemophagocytic lymphohistiocytosis in adults. Blood. 2019;133(23):2465–2477. doi:10.1182/blood.2018894618
12. Ramos-Casals M, Brito-Zerón P, López-Guillermo A, et al. Adult haemophagocytic syndrome. Lancet. 2014;383(9927):1503–1516. doi:10.1016/S0140-6736(13)61048-X
13. Verkamp B, Zoref-Lorenz A, Francisco B, et al. Early response markers predict survival after etoposide-based therapy of hemophagocytic lymphohistiocytosis. Blood Adv. 2023;7(23):7258–7269. doi:10.1182/bloodadvances.2023010546
14. Tang Y, Xu Q, Luo H, et al. Excessive IL-10 and IL-18 trigger hemophagocytic lymphohistiocytosis–like hyperinflammation and enhanced myelopoiesis. J Allergy Clin Immunol. 2022;150(5):1154–1167. doi:10.1016/j.jaci.2022.06.017
15. Ren Q, Chan K-W, Huang H, et al. Platelet-derived alpha-granules are associated with inflammation in patients with NK/T-cell lymphoma-associated hemophagocytic syndrome. Cytokine. 2020;126:154878. doi:10.1016/j.cyto.2019.154878
16. Henter JI, Horne A, Aricó M, et al. HLH-2004: diagnostic and therapeutic guidelines for hemophagocytic lymphohistiocytosis. Pediatr Blood Cancer. 2006;48(2):124–131. doi:10.1002/pbc.21039
17. Marsh RA, Allen CE, Mcclain KL, et al. Salvage therapy of refractory hemophagocytic lymphohistiocytosis with alemtuzumab. Pediatr Blood Cancer. 2012;60(1):101–109. doi:10.1002/pbc.24188
18. Johnson TS, Terrell CE, Millen SH, et al. Etoposide selectively ablates activated T cells to control the immunoregulatory disorder hemophagocytic lymphohistiocytosis. J Immunol. 2014;192(1):84–91. doi:10.4049/jimmunol.1302282
19. Jordan MB, Allen CE, Weitzman S, et al. How I treat hemophagocytic lymphohistiocytosis. Blood. 2011;118(15):4041–4052. doi:10.1182/blood-2011-03-278127
20. Zhou Y, Kong F, Wang S, et al. Increased levels of serum interleukin-10 are associated with poor outcome in adult hemophagocytic lymphohistiocytosis patients. Orphanet J Rare Dis. 2021;16(1). doi:10.1186/s13023-021-01973-4
21. Tang Y, Xu X, Song H, et al. Early diagnostic and prognostic significance of a specific Th1/Th2 cytokine pattern in children with haemophagocytic syndrome. Br J Haematol. 2008;143(1):84–91. doi:10.1111/j.1365-2141.2008.07298.x
22. An Q, Hu SY, Xuan CM, et al. Interferon gamma and interleukin 10 polymorphisms in Chinese children with hemophagocytic lymphohistiocytosis. Pediatr Blood Cancer. 2017;64(9). doi:10.1002/pbc.26505
23. Cheng W, Xu J, Shu Y, et al. Association of a decreased platelet count with poor survival in patients with adult secondary hemophagocytic lymphohistiocytosis. Ann Hematol. 2024;103(4):1159–1166. doi:10.1007/s00277-024-05663-6
24. Pui CH, Ribeiro RC, Hancock ML, et al. Acute myeloid leukemia in children treated with epipodophyllotoxins for acute lymphoblastic leukemia. New Engl J Med. 1991;325(24):1682–1687. doi:10.1056/NEJM199112123252402
25. Jesudas R, Takemoto CM. Where have all the platelets gone? HIT, DIC, or something else? Hematol Am Soc Hematol Educ Program. 2023;2023(1):43–50. doi:10.1182/hematology.2023000465
26. Dziedzic R, Bazan-Socha S, Korkosz M, et al. Characteristics of 21 patients with secondary hemophagocytic lymphohistiocytosis—insights from a single-center retrospective study. Medicina. 2025;61(6):977. doi:10.3390/medicina61060977
27. Jamali A, Ho N, Braun A, et al. Early induction of cytokine release syndrome by rapidly generated CAR T cells in preclinical models. EMBO Mol Med. 2024;16(4):784–804. doi:10.1038/s44321-024-00055-9
28. Baeksgaard L, Sørensen JB. Acute tumor lysis syndrome in solid tumors—a case report and review of the literature. Cancer Chemother Pharmacol. 2003;51(3):187–192. doi:10.1007/s00280-002-0556-x
29. Baronio F, Conti F, Miniaci A, et al. Diagnosis, treatment, and follow-up of a case of wolman disease with hemophagocytic lymphohistiocytosis. Mol Gene Metabol Rep. 2022;30:100833. doi:10.1016/j.ymgmr.2021.100833
30. Alabbas F, Elyamany G, Alanzi T, et al. Wolman’s disease presenting with secondary hemophagocytic lymphohistiocytosis: a case report from Saudi Arabia and literature review. BMC Pediatric. 2021;21(1). doi:10.1186/s12887-021-02541-2
31. Wang MM, Qiu HX, Wang JJ, et al. Clinical analysis of secondary hemophagocytic lymphohistiocytosis complicated with capillary leak syndrome]. Zhonghua Xue Ye Xue Za Zhi. 2019;40(6):502–506. doi:10.3760/cma.j.issn.0253-2727.2019.06.010
32. Diamond T, Bennett AD, Behrens EM. The liver in hemophagocytic lymphohistiocytosis. J Pediatr Gastroenterol Nutr. 2023;77(2):153–159. doi:10.1097/MPG.0000000000003807
33. Yin G, Man C, Liao S, et al. The prognosis role of AST/ALT (De Ritis) ratio in patients with adult secondary hemophagocytic lymphohistiocytosis. Mediators Inflam. 2020;2020:1–10. doi:10.1155/2020/5719751
34. Chen T-Y, Hsu M-H, Kuo H-C, et al. Outcome analysis of pediatric hemophagocytic lymphohistiocytosis. JFormos Med Assoc. 2021;120(1):172–179. doi:10.1016/j.jfma.2020.03.025
35. Pei Y, Zhu J, Yao R, et al. Prognostic factors in patients with secondary hemophagocytic lymphohistioc ytosis in a Chinese cohort. Ann Hematol. 2024;103(3):695–703. doi:10.1007/s00277-023-05567-x
36. Nolt B, Tu F, Wang X, et al. Lactate and Immunosuppression in Sepsis. Shock. 2018;49(2):120–125. doi:10.1097/SHK.0000000000000958
37. Lachmann G, Heeren P, Schuster FS, et al. Multicenter validation of secondary hemophagocytic lymphohistiocytosis diagnostic criteria. J Internal Med. 2025;297(3):312–327. doi:10.1111/joim.20065
38. Koymen G, Kilincer Bozgul SM, Kurtulmus IA, et al. Dynamic ferritin levels and survival outcomes in secondary hemophagocytic syndrome: a comprehensive analysis. Front Med. 2025;12:1517101. doi:10.3389/fmed.2025.1517101
 © 2026 The Author(s). This work is published and licensed by Dove Medical Press Limited. The
full terms of this license are available at https://www.dovepress.com/terms
and incorporate the Creative Commons Attribution
- Non Commercial (unported, 4.0) License.
By accessing the work you hereby accept the Terms. Non-commercial uses of the work are permitted
without any further permission from Dove Medical Press Limited, provided the work is properly
attributed. For permission for commercial use of this work, please see paragraphs 4.2 and 5 of our Terms.
© 2026 The Author(s). This work is published and licensed by Dove Medical Press Limited. The
full terms of this license are available at https://www.dovepress.com/terms
and incorporate the Creative Commons Attribution
- Non Commercial (unported, 4.0) License.
By accessing the work you hereby accept the Terms. Non-commercial uses of the work are permitted
without any further permission from Dove Medical Press Limited, provided the work is properly
attributed. For permission for commercial use of this work, please see paragraphs 4.2 and 5 of our Terms.