Back to Journals » Diabetes, Metabolic Syndrome and Obesity » Volume 16
Early Gestational Blood Markers to Predict Preeclampsia Complicating Gestational Diabetes Mellitus
Authors Xie Y, Zhou W, Tao X ![]() , Lv H, Cheng Z
, Lv H, Cheng Z ![]()
Received 3 March 2023
Accepted for publication 16 May 2023
Published 22 May 2023 Volume 2023:16 Pages 1493—1503
DOI https://doi.org/10.2147/DMSO.S410912
Checked for plagiarism Yes
Review by Single anonymous peer review
Peer reviewer comments 2
Editor who approved publication: Professor Gian Paolo Fadini
Yan Xie,1 Wenni Zhou,1 Xiang Tao,2 Hui Lv,3 Zhongping Cheng1
1Department of Obstetrics and Gynecology, Shanghai Tenth People’s Hospital, School of Medicine, Tongji University, Shanghai, 200072, People’s Republic of China; 2Department of Pathology, Obstetrics and Gynecology Hospital of Fudan University, Shanghai, 200090, People’s Republic of China; 3SG+ Bio-Testing Inc, Shanghai, 200093, People’s Republic of China
Correspondence: Zhongping Cheng; Hui Lv, Email [email protected]; [email protected]
Objective: Gestational diabetes mellitus (GDM) and preeclampsia (PE) are common pregnancy complications that share some common risk factors. GDM patients are also at high risk for PE. There are no sensitive markers for prediction, especially for the occurrence of PE in GDM patients. This study investigated plasma proteins for the prediction of PE in GDM patients.
Methods: A total of 10 PE, 10 GDM, and 5 PE complicated with GDM cases, as well as 10 pregnant controls without obvious complications, were included in the nested cohort. The proteomics in the plasma collected at 12– 20 weeks of gestational age (GA) were analyzed by liquid chromatography‒mass spectrometry/mass spectrometry. Some potential markers, such as soluble transferrin receptor (sTfR), ceruloplasmin (CP), apolipoprotein E (ApoE) and inositol 1,4,5-trisphosphate receptor 1 (ITPR1), were validated using enzyme-linked immunosorbent assays.
Results: Functional analysis of the plasma showed that proteasome activation, pancreatic secretion, and fatty acid degradation were activated in the GDM group, and renin secretion-, lysosome-, and proteasome pathways involving iron transport and lipid metabolism were enriched in the PE group, distinguishing PE complicating GDM.
Conclusion: Through proteomics analysis of plasma in early pregnancy, PE complicating GDM may have a unique mechanism from that of PE alone. Plasma sTfR, CP and ApoE levels have potential clinical applications in early screening.
Keywords: gestational diabetes mellitus, preeclampsia, preeclampsia complicating gestational diabetes mellitus, proteomics, plasma biomarkers
Introduction
Gestational diabetes mellitus (GDM) is defined as glucose intolerance diagnosed for the first time during pregnancy and is a common pregnancy complication.1 The worldwide prevalence of GDM is 5%-9%, whereas the prevalence is 12.8–16.7% in the Chinese population.2 With the increasing prevalence of obesity and lifestyle changes, the prevalence of GDM has also significantly increased two to three times in approximately 10 years.3 In recent years, with the lowering of the diagnostic threshold for GDM, the regulation of diet and exercise, and the strengthening of fetal monitoring, fetal complications caused by GDM have been properly managed. However, maternal complications, such as gestational hypertension and preeclampsia (PE), have not received enough attention. Epidemiology has shown that women with GDM are at high risk for PE, with an incidence of 12%-17%, much higher than that of the non-GDM population.4 PE is a systemic disease characterized by maternal endothelial dysfunction, proteinuria, hypercoagulation, and hypertension.5 This disease can cause maternal cerebrovascular accident, pulmonary edema, placental abruption, disseminated intravascular coagulation and so on, greatly increasing maternal morbidity and mortality.6 GDM complicated by PE further increases the risk of perinatal adverse events and has a greater impact on future maternal and offspring health.7
PE is a highly heterogeneous disease that is generally categorized into two types based on the time of onset: early-onset and late-onset PE.5,8 However, this classification is not directly related to the etiology, pathophysiology, presentation, or sequelae of syndromes with different phenotypes. Current studies suggest that the disequilibrium of soluble FMS-like tyrosine kinase-1 (sFlt-1) and placental growth factor (PlGF) is a common serological marker for the prediction of PE.9 However, it has been reported that sFlt-1/PlGF is not a suitable marker for predicting PE in the state of gestational diabetes,10–12 indicating the mechanics of PE complicating GDM, although a subtype of PE, is somewhat distinct from that of PE alone.
GDM and PE are both common pregnancy complications that share some common risk factors and pathophysiological pathways. The pathophysiologies of PE and GDM have complex implications for maternal health, including increased susceptibility to cardiovascular disease. Some common risk factors for both conditions include maternal obesity, previously diagnosed PE and/or GDM, and family disease history. It is valuable to explore markers for early detection, which could also shed some light on the mechanisms of PE and GDM. Therefore, in this study, liquid chromatography‒mass spectrometry (MS)/MS and bioinformatics analysis were used to compare deviations in proteins in the early-trimester plasma of cases with later-onset PE, GDM, and PE complicating GDM from normal controls.
Materials and Methods
Study Design and Patient Cohort
For this nested case‒control study, all pregnant women registered from October 2020 to December 2021 for delivery at the Department of Gynecology and Obstetrics of Tenth People’s Hospital Affiliated to Tongji University, Shanghai, China, were enrolled. Plasma from each woman at 12–20 weeks of gestational age (GA) were stored for later use. All women were followed up until delivery, and the following pathological cases were included in this study. The inclusion criteria were GDM diagnosed according to a 75-g oral glucose tolerance test (OGTT) at 24–28 weeks of gestation (fasting glucose ≥ 5.1 mmol/L, 1-h glucose ≥10.0 mmol/L, 2-h glucose ≥8.5 mmol/L), PE diagnosed as new-onset hypertension and proteinuria or other organ dysfunction. Diagnoses were made according to the criteria established by the International Society for the Study of Hypertension in Pregnancy. In the cohort, totally 25 GDM+PE cases were enrolled in this study, matched by 30 randomly selected GDM, PE and control cases each. Controls were defined as pregnancies resulting in a healthy live-born infant with a birth weight percentile in the normal range and no evidence of restricted fetal growth, hypertension during pregnancy, PE, hemolysis/elevated liver enzymes/low platelet (HELLP) syndrome, GDM or DM before pregnancy or other obvious complications. The exclusion criteria were multiple pregnancies, essential hypertension, renal disorders, autoimmune diseases, and thrombophilia. Five GDM+PE cases, 10 GDM, 10 PE and 10 control cases were enrolled in mass spectrometry proteomic study, and the other 20 cases in each group were enrolled in verification study. This study complied with the Declaration of Helsinki, and was approved by the Ethical Committee of Tenth People’s Hospital Affiliated to Tongji University (SHYS-IEC-5.0/22K15/P01). All participants provided informed consent.
Sample Collection and Processing
Three milliliters of venous blood was collected from the pregnant women (12–20 weeks of gestation) using EDTA anticoagulation tubes and centrifuged at 1000 rpm for 10 min, and the plasma, as the supernatant, was collected and frozen at −80°C for further experiments. Two microliters of plasma from each sample was dissolved in 98 μL 50 mM ammonium bicarbonate solution to a final volume of 100 μL and then denatured at 95°C for 3 min. The plasma was digested by trypsin at an enzyme to protein mass ratio of 1:25 overnight at 37°C, and the peptides were then extracted and dried using vacuum concentrator (SpeedVac, Eppendorf, US).
Liquid Chromatography‒Mass Spectrometry (MS)/MS Analysis
The peptides of each sample were analyzed by a Thermo-Fisher Orbitrap Q Exactive-HFx mass spectrometer (Waltham, MA) connected to an Easy-nLC1200 chromatography system. Dried peptide samples re-dissolved in Solvent A (0.1% formic acid in water) were first loaded onto an EASY-SprayTM C18 Trap column (Thermo Scientific, P/N 164946, 3 μm, 75 μm*2 cm) and then separated on an EASY-SprayTM C18 LC Analytical Column (Thermo Scientific, ES802, 1.9 μm, 75 μm*8 cm) with a linear gradient of buffer B (84% acetonitrile and 0.1% formic acid) at a flow rate of 600 nl/min over 120 min. The MS positive ion detection method was used, with the scan range at 300–1400 m/z, resolution for MS1 scan of 60,000 at 200 m/z, target of AGC (automatic gain control) at 3e6, maximum IT at 20 ms, and dynamic exclusion at 30.0 s. Each full MS–SIM scan was performed following 20 ddMS2 scans. The resolution for the MS2 scan was 15,000, the AGC target was 5 e4, the maximum IT was 25 ms, and the normalized collision energy was 30 eV.
Protein Identification, Quantification, and Bioinformatics Analyses
The original mass spectrometry analysis data were in RAW format, and the Firmiana cloud platform was used for database search identification and quantitative analysis. The quantitative information of the target protein collection was normalized to the interval before −1 and 1. Then, the complex heatmap R package (Version 3.4) was used to classify both sample and protein expression dimensions simultaneously (distance algorithm: Euclidean, linkage: Average linkage) and generate hierarchical clustering heatmaps. GO annotation of the target protein collection was performed using Blast2GO. KAAS (KEGG Automatic Annotation Server) software was used to perform KEGG pathway annotation on the target protein set. Comparison of the distribution of each GO classification (KEGG pathway or domain) in the target protein collection and the overall protein collection was performed using Fisher’s exact test, and enrichment of the GO annotations or KEGG pathway annotations was performed for the target protein collection analysis. Direct and indirect interactions between the target proteins were based on the information in the STRING (http://string-db.org/) database, and CytoScape software was used to generate and analyze the interaction networks.
Differentially Expressed Genes (DEGs)
The names of the proteins in this article were marked by the names of the corresponding genes. To identify DEGs, Student’s t-test was applied to the expression matrix. A P value of <0.05 and a fold change (FC) >2 (indicating upregulation) or <1/2 (indicating downregulation) were used as criteria to identify DEGs.13 This straightforward approach of combining a fold change cutoff with a nonstringent P value threshold has been demonstrated to yield reproducible and robust lists of DEGs for both microarray- and RNA-seq-based gene expression data.13,14
Enzyme-Linked Immunosorbent Assay (ELISA)
Twenty patients (12–20 weeks of GA) from each of the four groups were enrolled according to the above criteria. The sera were collected, processed and stored as described above. ELISA kits for detecting soluble TFRC (sTfR) (Abcam, Boston, MA), ceruloplasmin (CP) (Novus Biologicals, Centennial, CO), apolipoprotein E (APOE) (Proteintech Group, Wuhan, China), and inositol 1,4,5-trisphosphate receptor 1 (ITPR1) (MyBioSource, San Diego, CA) were used to detect the concentration of the sample according to the manufacturer’s guidelines. Proper dilutions of the samples were carried out according to the pretest using the same kit to obtain results within the detection range of each kit.
Statistical Analysis
Univariate statistical analysis was performed using Student’s t (2 groups), ANOVA (≥ 2 groups) or Mann‒Whitney U (2 groups), Kruskal–Wallis H (≥ 2 groups) tests to compare continuous variables with or without a normal distribution. Fisher’s exact tests were used for the comparison of categorical variables. P values were adjusted using Bonferroni correction or the Benjamini and Hochberg False Discovery Rate (FDR) in multiple comparisons, with P< 0.05 considered to be statistically significant. Principal component analysis (PCA) was conducted with univariance scaling, with the score plot showing the peptide distributions for each group. All analyses were performed using appropriate R packages (version 3.5.1).
Results
Patient Cohort and Clinical Characteristics
In this nested cohort, 10 GDM, 10 PE, and 5 GDM+PE cases, as well as 10 pregnant controls without obvious symptoms, were enrolled (Figure 1A). There was no significant difference in age or GA among the groups (Figure 1B). Other clinical data, except for the grouping criteria, were almost equally distributed among the groups. The pregnancy termination methods were significantly different among the groups, with 3, 4, 9, and 10 cases undergoing cesarean section in the normal, GDM+PE, GDM, and PE groups, respectively (Fisher’s exact test). The GAs were all beyond 38 weeks. The sampling time for this research was from 14.6 to 15.2 weeks of GA, without no difference among the groups.
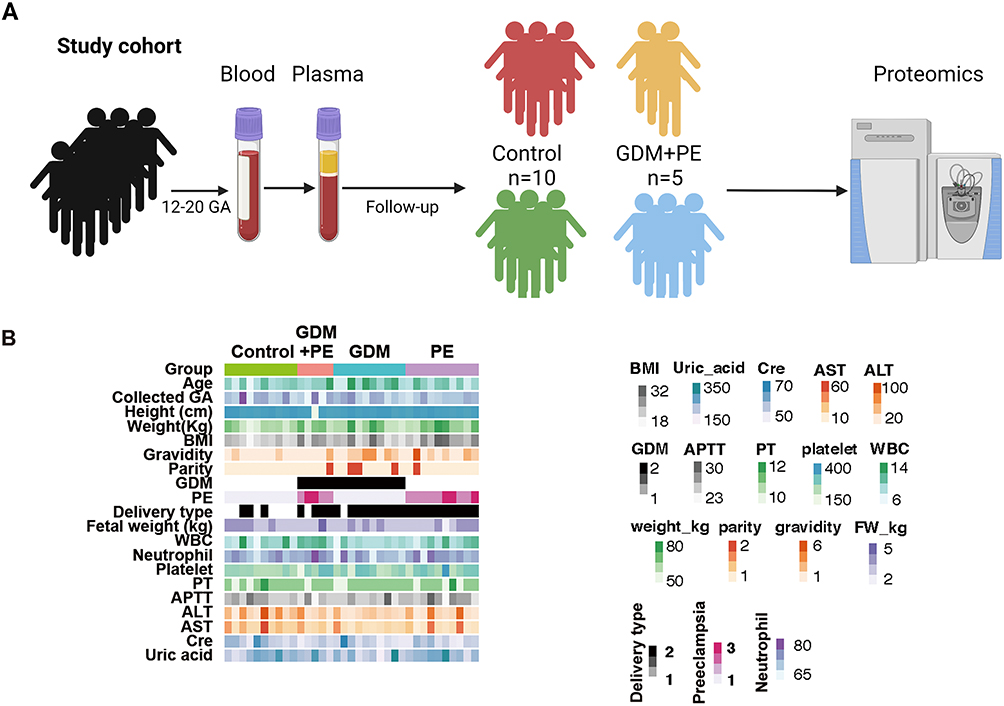 |
Figure 1 Study design and clinical data. (A) Schematic summary of the study design and patient cohort. Blood was collected from the pregnant cohort at 12–20 weeks of gestational age and then centrifuged for plasma for later usage. Cases with GDM, PE, and GDM+PE and controls were selected for proteomic analysis. (B) The clinical data showed an equal distribution among the groups except for some grouping criteria. |
Molecular Variation from Different Groups
The total number of detected proteins reached 6500, with an average of approximately 1700 for each plasma sample, achieving massive coverage of the proteome (Figure 2A). To explore the stability of protein identification within groups, intragroup sample differences were assessed using correlation analysis, which showed the degree of proteome correlation for all replicates within each group. The results showed that the intragroup sample correlation coefficient was high, between 0.95 and 0.99, indicating that no obvious intragroup bias occurred (Figure 2B). A comparison of protein expression levels between groups showed that most of the proteins were similar between groups, except for a few DEGs (Figure 2C and D).
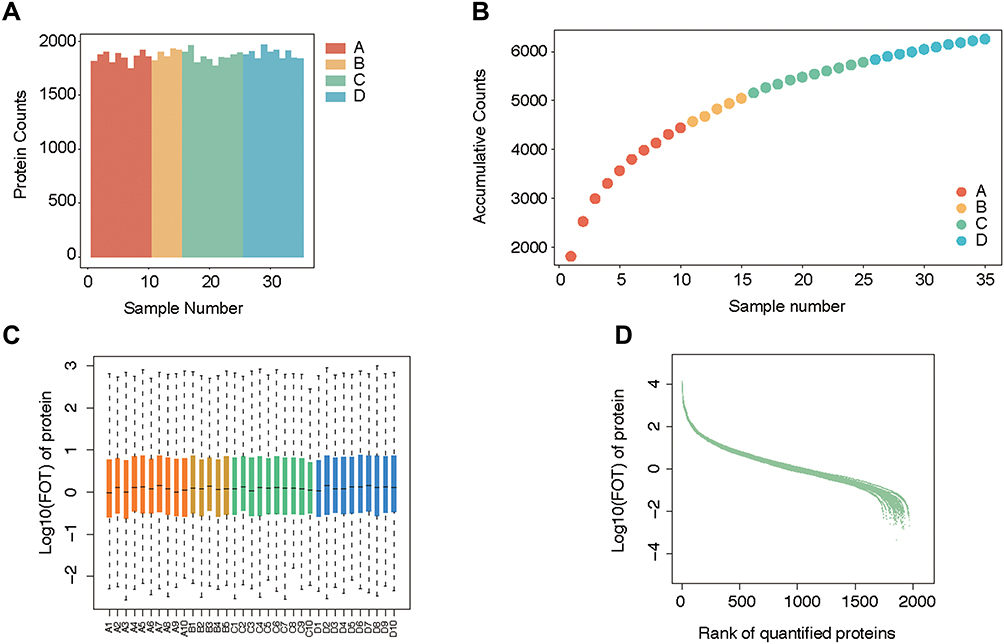 |
Figure 2 Quality control of mass spectrometry analysis. (A) The average protein counts of each case were approximately 1700. (B) The cumulative counts of the types of protein reached more than 6000. (C) The logarithm of FOT showed that most of the expressed proteins were evenly distributed in each case. (D) Ranking of identified proteins revealed that most (approximately 1700) protein types were steadily expressed in each case, while a small number of diverging proteins. |
Significant principal components were identified between the PE and normal groups, indicating that the proteome from plasma can reflect changes in PE patients (Figure 3A). Highly expressed genes from the PE group included SLC4A1, TFRC, PXN, and INA, and the downregulated genes included IGLV4.69, CDC42SE2, FNBP1, VWA8, PGRMC1, and SPR (Figure 3B). Clustering analysis using DEGs could clearly distinguish between the two groups of samples (Figure 3C). KEGG functional analysis revealed that annotated “renin secretion”, “pentose phosphate pathway”, “proteosome”, and “apoptosis” were enriched in the PE group (Figure 3D), indicating that renin-related hypertension inducers were activated with the corresponding systematically activated catabolism. Further analysis of the signature components revealed that the expression of PGD, FBP2, PSME1, PSMA8, PSMA7, ITPR1, ITPR3, and STSB was characteristic in PE, while higher concentrations of PRKCD, PTPA, and NDUFA10 were identified in normal controls (Figure 3E).
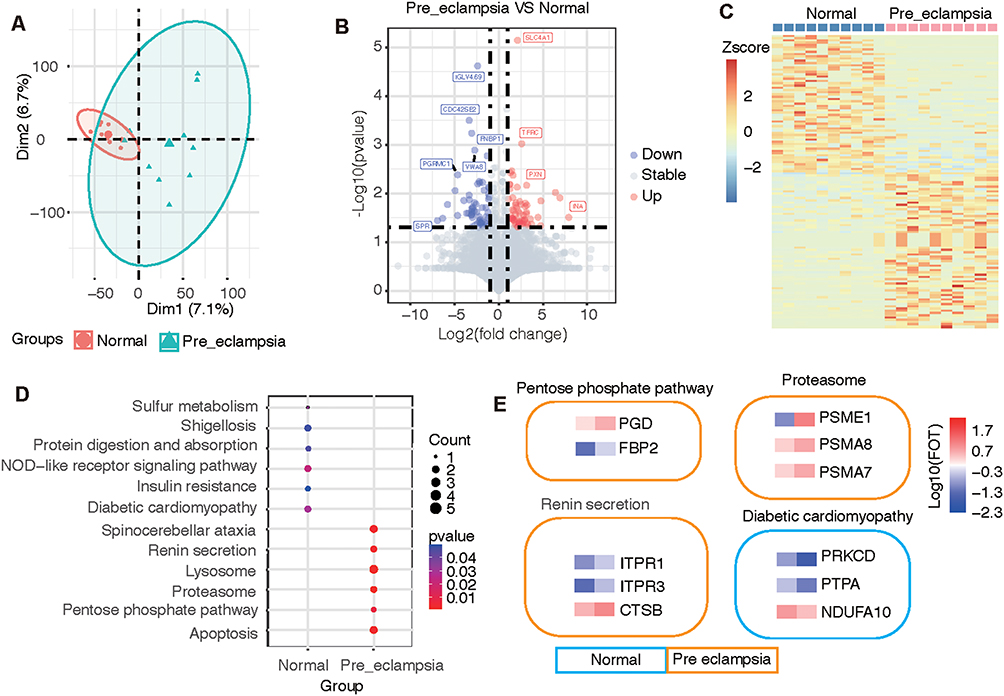 |
Figure 3 Difference and cluster analyses of plasma protein expression in early pregnancy between the preeclampsia and normal groups. (A) Principal component analysis divided the differential protein population between the two groups. (B) Volcano map listing the differentially expressed proteins in the two groups. (C) Heatmap showing the clustering results of the most significantly different proteins between the two groups. (D) KEGG pathway analysis classified the two groups of differential proteins according to the pathways. (E) The characteristic proteins belonging to the differential pathway are listed. |
The PCA results also showed a difference between GDM patients and normal controls (Figure 4A). The upregulated DEGs in the GDM group included PLEC and JUP, both of which were annotated as intercellular junctions of the epithelium; ACAA1, CELA3A, ADH5, and ITPR3 were also elevated in the GDM group. The downregulated genes in the GDM group included VWA8, TBL1XR1, COLEC10, and POLR2A (Figure 4B). The elevation of plasma cell-junction proteins implied the possibility of the excessive degeneration of epithelial cells, and the increased metabolism-related enzymes were partly due to the hypermetabolic state. Cluster analysis using differentially expressed proteins clearly distinguished between the two sample groups (Figure 4C). Pathway analysis showed that annotated “viral protein-interacting cytokine and receptor pathways”, “spinocerebellar ataxia”, “proteasome”, “pancreatic secretion”, “fatty acid degradation”, “apoptotic pathway activation”, “decreased essential amino acid degradation”, “fatty liver disease related”, and “neutrophil extracellular trap formation” were upregulated in the GDM group, indicating increased protein synthesis, the inhibition of hepatic uptake of fat, suppressed inflammatory reflection, increased fatty acid catabolism, and increased apoptosis in the GDM group (Figure 4D). Among the pathways, pancreas-secreted inositol 1,4,5-trisphosphate receptor 1 and 3 (encoded by ITPR1 and ITPR3, respectively), chymotrypsin-like elastase 3A (encoded by the CELA3A gene), fatty-acid-degradation-related acetyl-coenzyme A acyltransferase 1 (encoded by the ACAA1 gene), and alcohol dehydrogenase (encoded by the ADH5 gene) were found to be at high levels (Figure 4E).
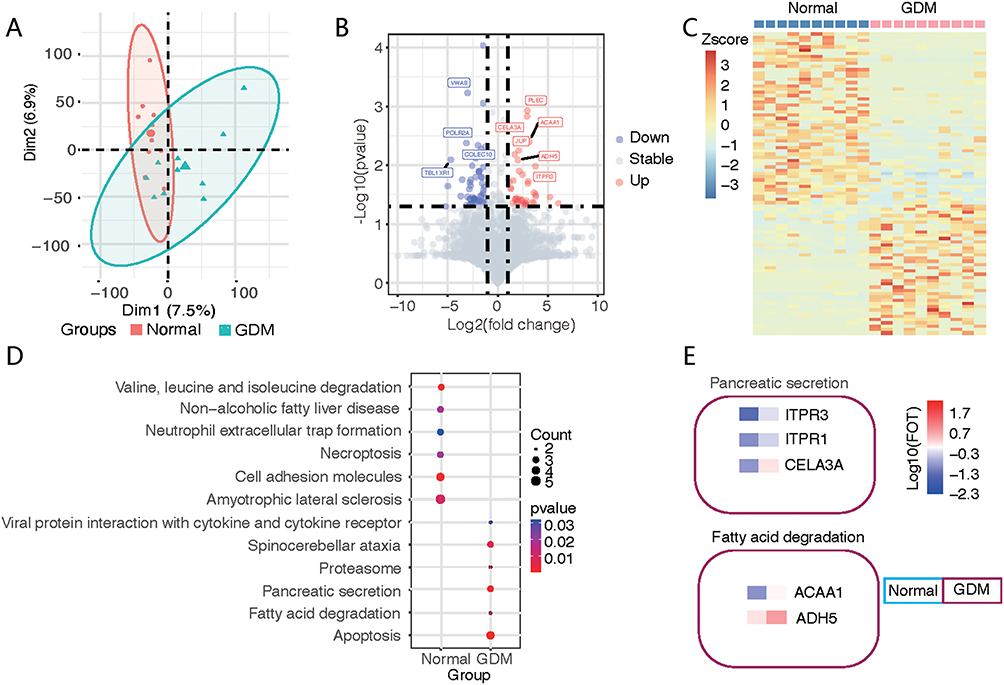 |
Figure 4 Difference and cluster analyses of plasma protein expression in early pregnancy between the GDM and normal groups. (A) Principal component analysis divided the differential protein population between the two groups. (B) Volcano map listing the differentially expressed proteins in the two groups, with red circles for the GDM group and blue circles for the normal group. (C) Heatmap showing the clustering results of the most significantly different proteins between the two groups. (D) KEGG pathway analysis classified the two groups of differential proteins according to the pathways. (E) The characteristic proteins belonging to the differential pathway are listed. |
Comparing Proteomics of Progressive Changes from the Normal to GDM to PE Group and the PE without GDM Group
To identify the molecular mechanisms underlying the occurrence of PE in GDM patients by plasma molecular markers, we analyzed the consecutive enriched protein types from the normal, GDM, and GDM+PE groups (Figure 5A). The enriched protein types were annotated as being associated with several cell types, including mucosa, myeloid dendritic cells, liver cells, hematopoietic cells, endocrine cells, gastrointestinal gland cells, blood cells, and atherosclerotic plaque cells (Figure 5B). Among these protein types, endocrine gland and digestive gland cell-associated proteins in plasma suggested that the GDM and GDM+PE groups may be associated with impaired pancreatic islets with an increasing trend. The increase in atherosclerotic plaque-associated proteins suggests that the damage to the vessel wall was progressively exacerbated during sequential changes. Using cellular pathway enrichment analysis, the changing proteins revealed a cluster of the insulin-related pathway (Figure 5C), of which the encoding genes were HDAC1, ITPR1, ACACB, PLA2G7, APOE, CP, TFRC, LTF, and MFGE8.
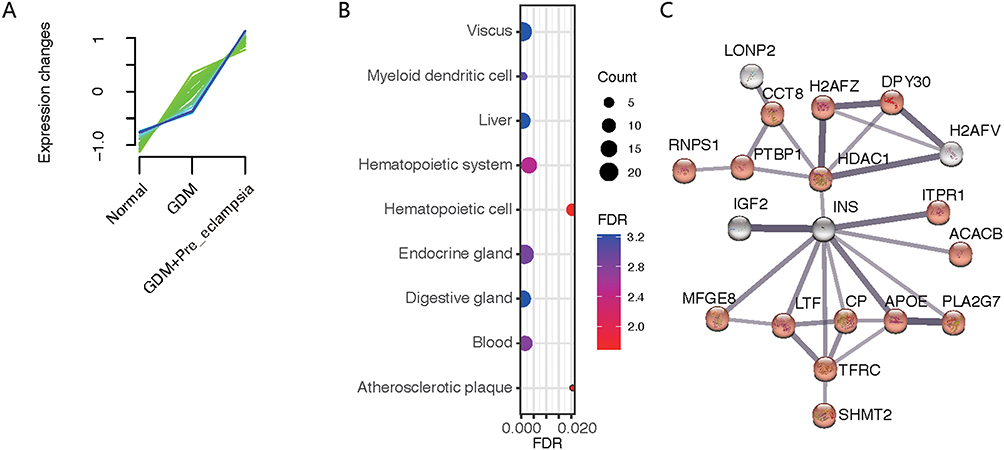 |
Figure 5 Protein analysis of fold changes in the normal to GDM group to the PE complicating GDM group. (A) The expression of some proteins tended to increase in the normal to GDM group and then to the GDM+PE group. (B) Proteins were enriched by the theoretically expressed cell types. (C) Protein interaction networks were generated by network analysis, focused on insulin (INS) at the core of regulation. |
Compared with the PE group, the GDM+PE group showed significant variations in the protein expression of 89 genes, with 5 in common (Figure 6A). The protein clusters encoded by SLC4A1, PTBP1, RNPS1, ITPR1, and TFRC showed a distinguishing capability, as shown by the heatmap (Figure 6B) and violin graph (Figure 6C). KEGG pathway enrichment analysis showed different activating pathways for PE alone and PE complicating GDM. For the former, the reckoned “innate immune system”, “apoptosis”, “receptor tyrosine kinase-related signaling”, “carbohydrate metabolism”, and “HSF1-mediated heat shock pathways” were activated. For the latter, the functions of “megakaryocyte cells in generating platelet”, “fibrin clot formation-related”, “steroid and vitamin metabolism”, and “protein biosynthesis-related” pathways were activated. ACACB and APOE were highly expressed in the GDM+PE group (Figure 6D and E).
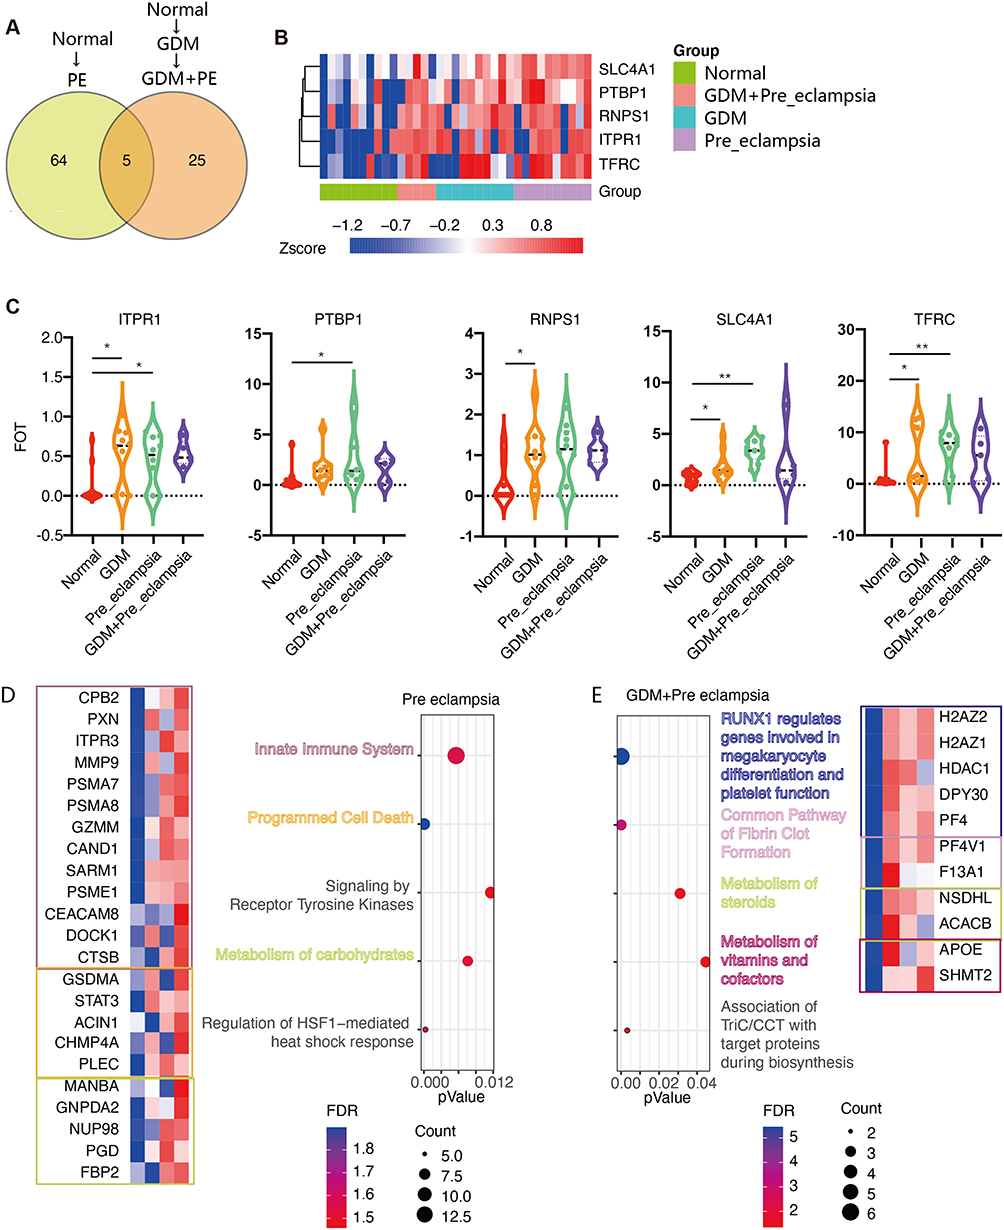 |
Figure 6 The variant levels of plasma protein expression between the PE and GDM+PE groups. (A) Compared with the normal group, in the PE-alone group, 69 proteins were significantly increased, and in the GDM+PE group, 30 proteins increased, of which 5 showed the same trend. (B) Heatmap showing 5 distinctly expressed proteins among the groups. (C) Violin graph reflecting the expression levels of these five proteins in each group. Cluster analysis showed different modes and characteristic proteins between the normal to PE group (*P<0.05, **P<0.01). (D) and normal to GDM to PE group (E). |
ELISA Verification of the sTfR, CP, ITPR1 and ApoE Concentrations in the Serum of the Four Groups
Due to the limitation of the cases with proteomics analysis, we selected sTfR (soluble TFRC), CP, ITPR1, and ApoE for verification by ELISA. Twenty patients from each group were enrolled. sTfR was slightly elevated in the GDM+PE, and GDM groups compared to the normal control group (P<0.05). CP levels were highest in the GDM+PE group, followed by the GDM, PE, and normal control groups. The concentration of ITPR1 was similar among the groups (P>0.05), and ApoE was greatly elevated in the GDM+PE and PE groups compared to the control and GDM groups. There was a trend of increase of ApoE from normal to GDM as showing from the results of proteomic analysis, but the difference was not significant (Table 1).
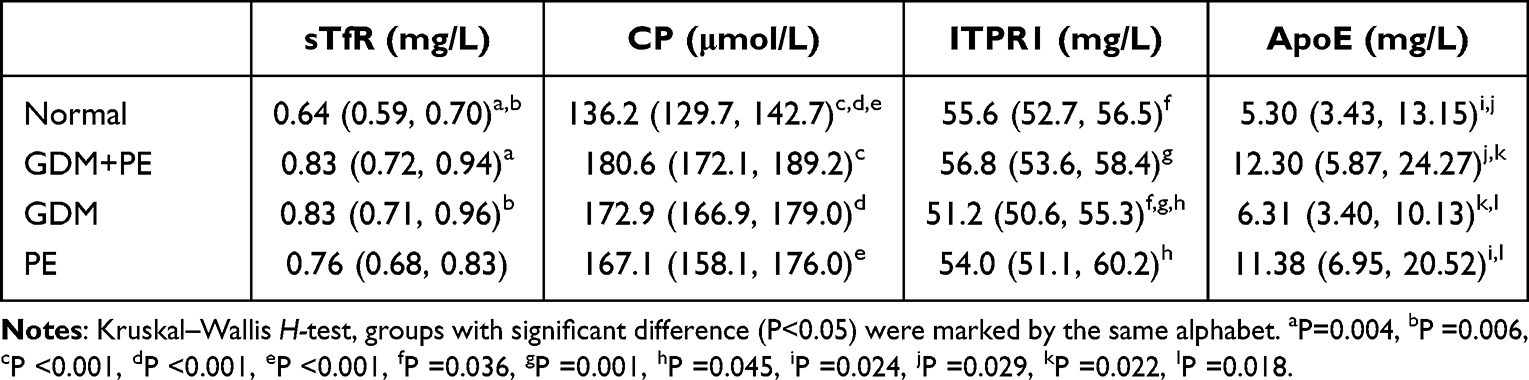 |
Table 1 Serum Levels of sTfR, CP, ITPR1, and ApoE in 20 Cases from Each Groups. Results Were Showed as Median (Quartiles) |
Discussion
Currently, GDM screening in pregnant women without risk factors is performed using the OGTT between 24 and 28 weeks of gestation. Some early biomarkers of GDM, such as plasma C-peptide, fibroblast growth factor 21 and fatty acid binding protein 4, have also been reported but are not suitable for early GDM diagnosis.15 According to the analysis in our study, some changes in plasma proteins occurred before 20 weeks of GA, involving proteasome activation, pancreatic secretion, fatty acid degradation, and apoptotic pathways, indicating the feasibility of early GDM detection by protein markers rather than OGTTs.
At present, the pathogenesis of PE is believed to include immune disorders at the maternal-fetal interface, poor remodeling of uterine arteries by trophoblasts, increased trophoblast injury, and maternal systemic endothelial cell damage.16 These injuries might begin to accumulate before the 20th week of gestation, which was reflected in the plasma proteomics of potential PE patients. In this study, renin secretion-, lysosome-, proteasome-, pentose phosphate-, and apoptosis-related pathways were enriched in the PE group, while protein absorption and nod-like receptor pathways were downregulated, indicating an overactive catabolism and inhibitory anabolism state in PE patients. These results also reinforced that PE is a systemic and multiorgan syndrome. Metabolism should be targeted for therapeutic purposes.
In contrast to the plasma protein profiles of patients with GDM alone and PE alone, in this study, we found that pregnant women who developed PE complicating GDM had some characteristic increased plasma protein expression at 12–20 weeks of gestation, such as TFRC, CP, and APOE, which are involved in iron transportation and lipid metabolism.
Iron is a multifunctional micronutrient involved in the synthesis of heme for carrying oxygen and in electron transport in mitochondrial respiration for generating energy and DNA synthesis.17 Maternal iron demand increases significantly during pregnancy to adapt to the placental and fetal development.18 TFRC is a transferrin receptor on the cell surface, expressed in the form of a homologous dimer, and part of the extracellular domain of TfR1 that can be detected when released into the blood after ablation. Iron uptake by transferrin occurs in many kinds of mammalian cells. TFRC expression is upregulated in anemia and hypoxia.19 Elevated sTfR levels are associated with a higher prevalence of cardiovascular disease.20 In the Chinese Health and Nutrition Examination Survey study, sTfR levels were shown to be positively correlated with systolic and diastolic blood pressure at baseline, and high sTfR levels independently predicted hypertension onset.21 Therefore, elevated sTfR in GDM+PE patients shares a common pathway with cardiovascular diseases in elderly individuals, as pregnancy might predispose women to a high risk of cardiovascular disease. CP is a polycopper oxidase that is produced mainly in the liver. It carries 40–70% of plasma copper and plays an important role in iron regulation and antioxidant processes.22 In addition, most of the 18 eligible studies reviewed supported a direct relationship between elevated CP levels and the incidence of coronary heart disease.23 Therefore, combined with the results of our bioinformatics analysis, it is suggested that sTfR and CP may be useful plasma markers for predicting the occurrence of PE in GDM patients.
Moreover, the mechanism of abnormal iron transport in GDM+PE patients deserves further study in the placenta. PE is considered to be a disease of placental origin. Syncytiotrophoblasts are the main barrier between maternal and fetal circulation, and they are also important cells that mediate iron transport during pregnancy. In addition to the needs of the fetus, the placenta itself is also an energy-guzzling organ that consumes approximately 40% of the total oxygen intake from the uterus, mainly for mitochondrial ATP synthesis to support protein production, nutrition, and fetal waste transportation.24 Excessive iron in an abnormal state (such as inflammation and hypoxia) leads to the production of superoxide compounds and then cell death, called ferroptosis.25 Previous studies have shown that the syncytiotrophoblasts of PE patients experience ferroptosis, causing excessive aging of the placenta.26
In this study, we found that ApoE levels were progressively elevated in the plasma from the GDM to GDM+PE groups, indicating that ApoE may also be a useful plasma marker for predicting the occurrence of PE in GDM patients. Previous evidence showed that in a GDM mouse model, ApoE deficiency exacerbated blood glucose levels, insulin abnormalities, and oxidative stress in the placenta.27 Abnormal lipid metabolism is involved in the pathogenesis of PE, mainly through endothelium dysfunction triggered by lipid peroxidation. For example, the uteroplacental bed shows acute atherosclerosis in PE patients. ApoE has been reported to mediate this process.28,29 Normacserrano’s study also showed that higher triglyceride and ApoE levels were associated with an increased PE risk.30
In summary, the pathway analysis in this study showed that the pathogenesis of GDM+PE was distinct from that of PE alone. Abnormal plasma iron transport and enhanced lipid metabolism may promote the development of PE in GDM patients. Several potential blood markers, such as sTfR, CP, and ApoE, could be valuable markers for predicting the occurrence of PE in GDM patients. Due to the small sample size of this preliminary study, these markers could not be directly used in practice. The clinical application still needs to be further validated in a large population. Our findings also indicate that the potential relationship between iron metabolism and the mechanism of PE needs to be further explored.
Conclusion
Through proteomics analysis of plasma in early pregnancy, PE complicating GDM may have a unique mechanism from that of PE alone. Plasma sTfR, CP and ApoE levels have potential clinical applications in early screening.
Data Sharing Statement
We confirm that the data used during the research will not be shared with anybody/broadcasted in any public domain. The datasets generated during and/or analysed during the current study are available from the corresponding author (Z. C.) on reasonable request.
Funding
This work was supported by Science and Technology Commission of Shanghai Municipality “Science and Technology Innovation Action Plan” special project of biomedical science and technology support, #22S31905800.
Disclosure
The authors report no conflicts of interest in this work.
References
1. Tsakiridis I, Giouleka S, Mamopoulos A, et al. Diagnosis and management of gestational diabetes mellitus: an overview of national and international guidelines. Obstet Gynecol Surv. 2021;76:367–381. doi:10.1097/OGX.0000000000000899
2. Gao C, Sun X, Lu L, et al. Prevalence of gestational diabetes mellitus in mainland China: a systematic review and meta-analysis. J Diabetes Invest. 2019;10:154–162. doi:10.1111/jdi.12854
3. Dugalic S, Petronijevic M, Vasiljevic B, et al. Trends of the prevalence of pre-gestational diabetes in 2030 and 2050 in Belgrade cohort. Int J Environ Res Public Health. 2022;19:6517. doi:10.3390/ijerph19116517
4. Vambergue A, Nuttens MC, Goeusse P, et al. Pregnancy induced hypertension in women with gestational carbohydrate intolerance: the diagest study. Eur J Obstet Gyn R B. 2002;102:31–35. doi:10.1016/s0301-2115(01)00556-5
5. Brown MA, Magee LA, Kenny LC, et al. Hypertensive disorders of pregnancy: isshp classification, diagnosis, and management recommendations for international practice. Hypertension. 2018;72(1):24–43. doi:10.1161/HYPERTENSIONAHA.117.10803
6. Zhang J, Meikle S, Trumble A, et al. Severe maternal morbidity associated with hypertensive disorders in pregnancy in the United States. Hypertens Pregnancy. 2003;22:203–212. doi:10.1081/PRG-120021066
7. McElwain CJ, Tuboly E, McCarthy FP, et al. Mechanisms of endothelial dysfunction in pre-eclampsia and gestational diabetes mellitus: windows into future cardiometabolic health? Front Endocrinol. 2020;11:655. doi:10.3389/fendo.2020.00655
8. Robillard PY, Dekker G, Iacobelli S, et al. An essay of reflection: why does preeclampsia exist in humans, and why are there such huge geographical differences in epidemiology? J Reprod Immunol. 2016;114:44–47. doi:10.1016/j.jri.2015.07.001
9. McCarthy FP, Ryan RM, Chappell LC. Prospective biomarkers in preterm preeclampsia: a review. Pregnancy Hypertens. 2018;14:72–78. doi:10.1016/j.preghy.2018.03.010
10. Vieira MC, Begum S, Seed PT, et al. Gestational diabetes modifies the association between PlGF in early pregnancy and preeclampsia in women with obesity. Pregnancy Hypertens. 2018;13:267–272. doi:10.1016/j.preghy.2018.07.003
11. Townsend R, Khalil A, Premakumar Y, et al. Prediction of pre-eclampsia: review of reviews. Ultrasound Obstet Gynecol. 2019;54:16–27. doi:10.1002/uog.20117
12. Lim S, Li W, Kemper J, et al. Biomarkers and the prediction of adverse outcomes in preeclampsia: a systematic review and meta-analysis. Obstet Gynecol. 2021;137:72–81. doi:10.1097/AOG.0000000000004149
13. SEQC Consortium. A comprehensive assessment of RNA-seq accuracy, reproducibility and information content by the sequencing quality control consortium. Nat Biotechnol. 2014;32:903–914. doi:10.1038/nbt.2957
14. Shi L, Reid LH, Jones WD, et al. The MicroArray Quality Control (MAQC) project shows inter- and intraplatform reproducibility of gene expression measurements. Nat Biotechnol. 2006;24:1151–1161. doi:10.1038/nbt1239
15. Omazić J, Viljetić B, Ivić V, et al. Early markers of gestational diabetes mellitus: what we know and which way forward? Biochemia Medica. 2021;31:030502. doi:10.11613/BM.2021.030502
16. Burton GJ, Redman CW, Roberts JM, et al. Pre-eclampsia: pathophysiology and clinical implications. BMJ. 2019;366:l2381. doi:10.1136/bmj.l2381
17. Duck KA, Connor JR. Iron uptake and transport across physiological barriers. Biometals. 2016;29(4):573–591. doi:10.1007/s10534-016-9952-2
18. Fisher AL, Nemeth E. Iron homeostasis during pregnancy. Am J Clin Nutr. 2017;106:1567S–1574S. doi:10.3945/ajcn.117.155812
19. Xu MM, Wang J, Xie JX. Regulation of iron metabolism by hypoxia-inducible factors. Sheng Li Xue Bao. 2017;69:598–610. PMID: 29063108.
20. Zhu S, Liu C, Zhao C, et al. Increased serum soluble transferrin receptor levels were associated with high prevalence of cardiovascular diseases: insights from the national health and nutrition examination survey 2017–2018. Front Cell Dev Biol. 2022;10:874846. doi:10.3389/fcell.2022.874846
21. Zhu Y, Chen G, Bo Y, et al. Markers of iron status, blood pressure and incident hypertension among Chinese adults. Nutr Metab Cardiovasc Dis. 2019;29:830–836. doi:10.1016/j.numecd.2019.04.012
22. Liu Z, Wang M, Zhang C, et al. Molecular functions of ceruloplasmin in metabolic disease pathology. Diabetes Metab Syndr Obes. 2022;15:695–711. doi:10.2147/DMSO.S346648
23. Arenas de Larriva AP, Limia-Pérez L, Alcalá-Díaz JF, et al. Ceruloplasmin and coronary heart disease-A systematic review. Nutrients. 2020;12(10):3219. doi:10.3390/nu12103219
24. Gao G, Li J, Zhang Y, et al. Cellular Iron Metabolism and Regulation. Adv Exp Med Biol. 2019;1173:21–32. doi:10.1007/978-981-13-9589-5_2
25. Beharier O, Kajiwara K, Sadovsky Y. Ferroptosis, trophoblast lipotoxic damage, and adverse pregnancy outcome. Placenta. 2021;108:32–38. doi:10.1016/j.placenta.2021.03.007
26. Ng SW, Norwitz SG, Norwitz ER. The impact of iron overload and ferroptosis on reproductive disorders in humans: implications for preeclampsia. Int J Mol Sci. 2019;20:13. doi:10.3390/ijms20133283
27. Li M, Hou X, Zhang R, et al. Role of apolipoprotein E in suppressing oxidative stress in gestational diabetes mellitus patients and mouse model. Int J Gynaecol Obstet. 2022;159:204–212. doi:10.1002/ijgo.14076
28. Sulistyowati S. The role of oxidative stress in the pathogenesis of pre-eclampsia. Pregnancy Hypertens. 2014;4:244. doi:10.1016/j.preghy.2014.04.014
29. Belo L, Gaffney D, Caslake M, et al. Apolipoprotein E and cholesteryl ester transfer protein polymorphisms in normal and preeclamptic pregnancies. Eur J Obstet Gyn R B. 2004;112:9–15. doi:10.1016/s0301-2115(03)00240-9
30. Serrano NC, Guio-Mahecha E, Quintero-Lesmes DC, et al. Lipid profile, plasma apolipoproteins, and pre-eclampsia risk in the GenPE case-control study. Atherosclerosis. 2018;276:189–194. doi:10.1016/j.atherosclerosis.2018.05.051
 © 2023 The Author(s). This work is published and licensed by Dove Medical Press Limited. The
full terms of this license are available at https://www.dovepress.com/terms
and incorporate the Creative Commons Attribution
- Non Commercial (unported, 3.0) License.
By accessing the work you hereby accept the Terms. Non-commercial uses of the work are permitted
without any further permission from Dove Medical Press Limited, provided the work is properly
attributed. For permission for commercial use of this work, please see paragraphs 4.2 and 5 of our Terms.
© 2023 The Author(s). This work is published and licensed by Dove Medical Press Limited. The
full terms of this license are available at https://www.dovepress.com/terms
and incorporate the Creative Commons Attribution
- Non Commercial (unported, 3.0) License.
By accessing the work you hereby accept the Terms. Non-commercial uses of the work are permitted
without any further permission from Dove Medical Press Limited, provided the work is properly
attributed. For permission for commercial use of this work, please see paragraphs 4.2 and 5 of our Terms.