Back to Journals » Infection and Drug Resistance » Volume 9
Early detection of neonatal group B streptococcus sepsis and the possible diagnostic utility of IL-6, IL-8, and CD11b in a human umbilical cord blood in vitro model
Authors Nakstad B ![]() , Sonerud T, Solevag AL
, Sonerud T, Solevag AL
Received 10 February 2016
Accepted for publication 8 April 2016
Published 8 July 2016 Volume 2016:9 Pages 171—179
DOI https://doi.org/10.2147/IDR.S106181
Checked for plagiarism Yes
Review by Single anonymous peer review
Peer reviewer comments 3
Editor who approved publication: Professor Suresh Antony
Britt Nakstad,1,2 Tonje Sonerud,1,3 Anne Lee Solevåg1
1Department of Pediatric and Adolescent Medicine, Akershus University Hospital, Lørenskog, 2Institute of Clinical Medicine, University of Oslo, Lørenskog, 3Section of Clinical Molecular Biology (EpiGen), Division of Medicine, Akershus University Hospital, Lørenskog, Norway
Background: Group B streptococcus (GBS) infection remains a major cause of neonatal morbidity and mortality, and GBS III is the predominant strain in early-onset GBS neonatal sepsis. To avoid both over- and undertreatment of infants with nonspecific signs of infection, early diagnostic tools are warranted. The aim of this study was to identify biomarkers with high sensitivity and specificity in an early stage of GBS infection. A secondary aim was to assess the utility of a human umbilical cord blood (HUCB) model system of early-onset neonatal sepsis.
Methods: Umbilical cord blood samples from 20 healthy term pregnancies were stimulated for 2 hours with a GBS III isolate from a patient and a commercially available GBS Ia strain. Nonstimulated samples served as controls. Leukocyte surface markers (CD11b, CD64, toll-like receptor [TLR] 2, TLR4, and TLR6) were analyzed by flow cytometry and soluble biomarkers by enzyme-linked immunosorbent assay (interleukin [IL]-6 and -8; interferon-γ-inducing protein [IP]-10; and S100b). The area under the receiver operating characteristic curve (AUC) was calculated for the markers.
Results: GBS III gave the highest responses and AUC values for all biomarkers. Only IL-6 and IL-8 displayed an AUC approaching 0.8 for both GBS serotypes (P<0.001). IL-8 >5,292 pg/mL had both a sensitivity and a specificity of 1.00. IL-6 >197 pg/mL had both a sensitivity and a specificity of 0.95 for GBS III stimulation. CD11b on granulocytes and monocytes was the leukocyte surface marker with the highest AUC values for both GBS serotypes.
Conclusion: In agreement with previous studies, IL-6, IL-8, and potentially CD11b could be useful in diagnosing neonatal GBS infection in an early stage. Our HUCB early-onset neonatal sepsis model may be useful for evaluating biomarkers of neonatal sepsis. The HUCB of neonates with risk factors for sepsis might even be used for diagnostic purposes, but requires further study.
Keywords: TLR4, TLR6, CD64, GBS serotypes, flow cytometry
Background
Early-onset group B streptococcus (GBS) sepsis occurs in the first week of life and is commonly caused by GBS serotypes Ia, II, III, and V.1–4 Even though intrapartum antibiotic prophylaxis has reduced the incidence of early-onset neonatal sepsis (EONS) caused by GBS dramatically,5 GBS remains a major cause of neonatal sepsis with a high morbidity and mortality rate.6 Recent population-based surveillance studies in the US revealed GBS as the etiological agent of EONS in 38%–43% of all cases, with the incidence of neonatal GBS sepsis estimated to be 0.29–0.41/1,000 live births. The majority of cases (73%) were in term neonates.7,8
Because early antibiotic treatment can limit morbidity and mortality, it is of uppermost interest to find improved methods to diagnose early neonatal GBS infection and avoid a rapid disease progression to a potentially life-threatening condition. Better diagnostic tools are also needed to limit the widespread use of unnecessary antibiotics. Increased interleukin (IL)-8 response in blood has been observed in severe and fatal sepsis9–11 and in cerebrospinal fluid in bacterial meningitis.12 Interferon-γ-inducing protein (IP)-10 is a sensitive marker of severe malaria disease13 and could also be a potential biomarker in sepsis. S100b is associated with experimental sepsis14 and poor neurological outcome in preterm infants.15
The aim of this bench study was to explore the potential usefulness of inflammatory biomarkers, including IL-6, IL-8, IP-10, and S-100b, and leukocyte receptors CD11b, CD64, and toll-like receptors [TLRs] 2, 4, and 6 in diagnosing neonatal GBS sepsis at an early stage. We analyzed the responses in human umbilical cord blood (HUCB) and speculated that the appropriate use and processing of selected biomarkers could help in the diagnosis and management of patients with neonatal GBS sepsis. A secondary aim was to assess the utility of the HUCB model system of neonatal sepsis.
Methods
GBS isolates
The study was approved by the regional ethics committee (2013/609/REK sør-øst) and the privacy data officer at Akershus University Hospital. GBS was isolated from the blood of a neonate with proven sepsis with GBS type III, subtype rib; r4 in November 2013. Written consent was obtained from the parents. The neonate was born at term with appropriate weight for age and rupture of the membranes 38 hours prior to birth. In Norway, routine screening for maternal GBS colonization is not performed, and the mother did not receive perinatal antibiotic therapy. The newborn developed respiratory distress, irritability, and low SaO2 at 6 hours after birth. C-reactive protein (CRP) and white blood cells were normal at initiation of antibiotic therapy. The GBS isolate from this patient (GBS III) and the commercially available type strain CCUG 4209 (Culture Collection, University of Gothenburg, Sweden) (GBS Ia) were grown on blood agar and incubated at 37°C and 5% CO2 for 24 hours. Bacterial cells were harvested in phosphate-buffered saline (PBS) and counted spectrophotometrically on Smart Spec Plus (Bio-Rad Laboratories Inc., Hercules, CA, USA) and heated at 60°C for 120 minutes at 600 rpm. Aliquots of 5×10⁹ colonies/mL were stored at -80°C.
Cohort of delivering mothers and pregnancies
Healthy women with uncomplicated pregnancies with no known GBS colonization or other risk factors for infection admitted to the labor and delivery unit at Akershus University Hospital, Norway, October 2014–February 2015, were asked for verbal and written consent to harvest umbilical cord blood postpartum, after cord clamping. Exclusion criteria were a history of smoking or use of medications during the pregnancy, signs of maternal infection, or other risk factors for fetal infection including prolonged rupture of membranes and preterm delivery (prior to gestational week 37+0). Demographic characteristics of the mothers, their pregnancies, and the infants are presented in Table 1.
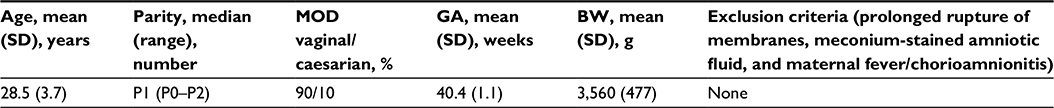 | Table 1 Characteristics of the mothers, their pregnancies, and the infants (n=20) Note: Age, age of the mother. Abbreviations: BW, birth weight; GA, gestational age; MOD, mode of delivery; SD, standard deviation. |
Blood sampling and in vitro model of GBS sepsis
The HUCB was collected in lithium heparin-coated vacutainers. The blood was transferred to tissue culture dishes and stimulated with GBS III and Ia in separate dishes in an incubator at 37°C in humidified air for 2 hours, except for in the time–response experiments. This model, but with other stimulants, has previously proven to be appropriate for keeping the cells alive prior to flow cytometry.16–19
Time series experiments and dose–response assessment
In a dose–response assessment, HUCB was stimulated for 2 hours with GBS at concentrations of 103, 105, 106, 5×10⁶, 107, 5×10⁷, 108, or 5×10⁸ cells/mL, which we, in consultation with clinical and academic microbiologists in our institution, thought would cover relevant GBS concentrations for clinical sepsis (Figure 1).20 The surface expression of CD11b increased in a dose-dependent manner and plateaued at 5×10⁷ GBS cells/mL and IL-8 at 5×10⁶ GBS cells/mL. TLR2 on monocytes and CD64 on granulocytes continued to increase at a concentration of 5×10⁸ GBS cells/mL. However, for feasibility reasons in the technical preparation of the samples, we chose to use a concentration of 108 GBS cells/mL. HUCB was then stimulated with 108 GBS III cells/mL for 15 minutes, 30 minutes, 2 hours, 4 hours, 8 hours, and 24 hours. Even though the surface expression of CD64, CD11b, and TLR2 continued to increase toward 24 hours of incubation, we chose 2 hours stimulation for our main experiments as the levels already were significantly elevated at that time and we wanted to investigate early indicators of GBS infection.
 | Figure 1 Flow chart of the study protocol. Abbreviations: GBS, group B streptococcus; PBS, phosphate-buffered saline; CD, cluster of differentiation; TLR, toll-like receptor; IL, interleukin; IP, interferon-γ-inducing protein; CXCL, chemokine ligand; S100b, S100 calcium-binding protein B. |
Preparation and measurement of cell surface markers by flow cytometry
Fluorochrome-conjugated antibodies for flow cytometry (product number in brackets): CD14-APC-H7 (560270), CD45-PerCP (345809), CD11b/Mac-1-APC (550019), and CD64-BV421 (562872) were purchased from BD Biosciences (San Jose, CA, USA). TLR2 (CD282)-PE (12-9922-42) and TLR4 (CD284)-PE (12-9917) were obtained from eBioscience (San Diego, CA, USA). TLR6 (TLR6.127)-FITC (ab72362) was from Abcam (Cambridge, UK). Mouse serum (M5905) was purchased from Sigma-Aldrich Co. (St Louis, MO, USA), FACS lysing solution (349202) from BD Biosciences, fetal bovine serum (10270106) from Thermo Fisher Scientific (Waltham, MA, USA), and IOTest® Fixative Solution (IM3515) from Beckman Coulter (Brea, CA, USA).
Baseline (0 hour) blood was prepared directly for flow cytometry. The 2-hour control was incubated with PBS and GBS cultures at a final concentration of 108 GBS cells/mL for both GBS III and GBS Ia.
HUCB was incubated with 10 μL mouse serum on ice for 10 minutes in the dark, then washed with cold PBS and centrifuged. All centrifugations were carried out at 300 g for 5 minutes at 4°C. The cells were stained with fluorochrome-conjugated antibodies on ice in the dark for 30 minutes. Tube A contained CD14-APC-H7 (5 μL), CD45-PerCP (20 μL), CD64-BV421 (5 μL), CD11b-APC (20 μL), TLR2-PE (20 μL), and TLR6-FITC (10 μL) and tube B contained CD14 (5 μL), CD45 (20 μL), and TLR4-PE (20 μL). Red cells were lysed in a FACS lysing solution, pelleted, and washed in cold PBS with 10% fetal bovine serum, and then centrifuged and the pellet was resuspended in 1×IOTest® 3 Fixative Solution, until flow cytometry analysis.
FACSCanto II flow cytometer (Table 2, configuration) and FACS Diva Software Version 7.1 (BD Biosciences) were used for the analysis. The median fluorescence intensity of the examined parameters was recorded.
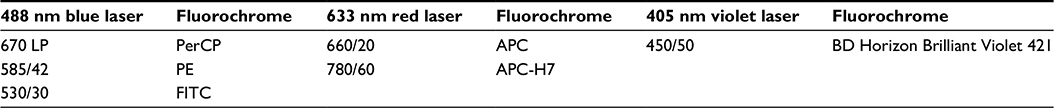 | Table 2 FACSCanto II configuration Abbreviations: APC, allophycocyanin; APC-H7, allophycocyanin-hilite7; PerCP, peridinin chlorophyll protein complex; PE, phycoerythrin; FITC, fluorescein isothiocyanate. |
Cytokine, chemokine, and S100b enzyme-linked immunosorbent assay analysis
Human IL-6, CXCL8/IL-8, and IP-10 Quantikine enzyme-linked immunosorbent assay kits were from R&D Systems, Inc. (Minneapolis, MN, USA) and S100b from Fujirebio Diagnostics (Gothenburg, Sweden).
Plasma was collected from cultures at baseline (0 hour), 2-hour control (PBS, 2 hours), and 2-hour GBS stimulation (GBS III and GBS Ia separately, 2 hours). HUCB was centrifuged at 2,000× g for 10 minutes and plasma stored at -80°C. Plasma samples were diluted if necessary and analyzed in singlets following the manufacturer’s instructions on the Varioscan instrument (Thermo Fisher Scientific) using SkanIt software Version 2.4.3.
Statistical analysis
We report the medians with interquartile ranges as the data were not normally distributed. Differences between the GBS-stimulated and control samples were tested with the Mann–Whitney U test. We calculated Pearson’s correlation coefficient (r) for associations between the different biomarkers. The area under the receiver operating characteristic curve (AUC) with 95% CI was calculated for each biomarker. We also estimated the cutoff value that would give each biomarker at least a 95% sensitivity for detecting GBS stimulation and report the corresponding specificity for that value. Statistical analyses were performed with IBM SPSS 22 for Mac (IBM Corporation, Armonk, NY).
Results
The overall responses were highest for GBS III isolated from the neonate with clinical sepsis. In general, stimulation with the commercially available GBS Ia strain resulted in responses that overlapped with those of the control samples.
Overall leukocyte responses
Specific results including the AUC values for the different surface markers are presented in Figure 2 and Table 3. The leukocyte responses showed a large interindividual variation but with significant correlation across TLRs and CDs, except for CD64 and TLR6 that did not correlate significantly (r =0.09, P=0.43).
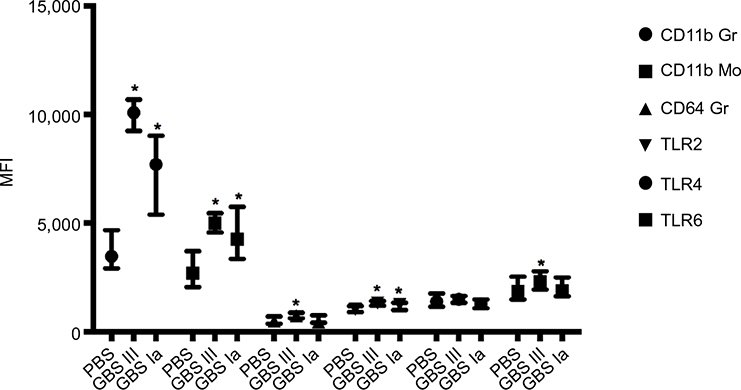 | Figure 2 Leukocyte surface markers. Notes: Values are presented as median with interquartile range. *P<0.05 compared with PBS control. Abbreviations: GBS, group B streptococcus; MFI, median fluorescence intensity; PBS, phosphate-buffered saline; TLR, toll-like receptor. |
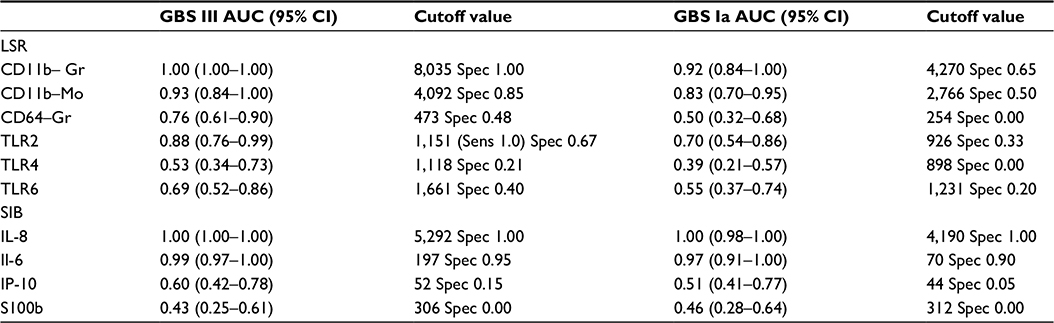 | Table 3 Area under the receiver operating characteristic curve (AUC) and the cutoff value for each biomarker that would give the test at least a 95% sensitivity for detecting group B streptococcus (GBS) III and Ia stimulation, with the corresponding specificity Abbreviations: CI, confidence interval; Gr, granulocyte; Mo, monocyte; LSR, leukocyte surface receptors; SIB, soluble inflammatory biomarkers; Spec, specificity; Sens, sensitivity; TLR, toll-like receptor; IL, interleukin; IP, interferon-γ-inducing protein. |
CD11b and CD64
Both GBS III- and GBS Ia-stimulated samples had higher granulocyte and monocyte CD11b levels compared with 2-hour PBS controls (P<0.001 for both GBS subtypes; Figure 2).
CD64 was higher in GBS III-stimulated samples compared with 2-hour PBS controls (P=0.004). CD64 in GBS Ia-stimulated samples was not different from 2-hour PBS controls (P=0.97).
Toll-like receptors
TLR2 and TLR6 were higher in GBS III-stimulated samples compared with 2-hour PBS controls (P<0.001 and 0.038, respectively; Figure 2). TLR4 was not different in GBS III-stimulated samples compared with 2-hour PBS controls (P=0.73). TLR2 was higher in GBS Ia-stimulated samples compared with control cultures (P=0.027). TLR4 and TLR6 were not different in GBS Ia-stimulated and 2-hour PBS controls (P=0.26 and 0.57, respectively).
Overall response in soluble biomarkers
Specific results including the AUC for the different soluble biomarkers are presented in Figure 3 and Table 3. The GBS III response was generally higher than the GBS Ia response. We found a significant positive correlation between IL-6 and IL-8 (r=0.82, P<0.001) and between IP-10 and S100b (r=0.26, P=0.021), but not between IP-10 and IL-6/IL-8 (r=0.13, P=0.26 and r=0.18, P=0.11, respectively) or S100b and IL-6/IL-8 (r=-0.07, P=0.53 and r=-0.40, P=0.72, respectively).
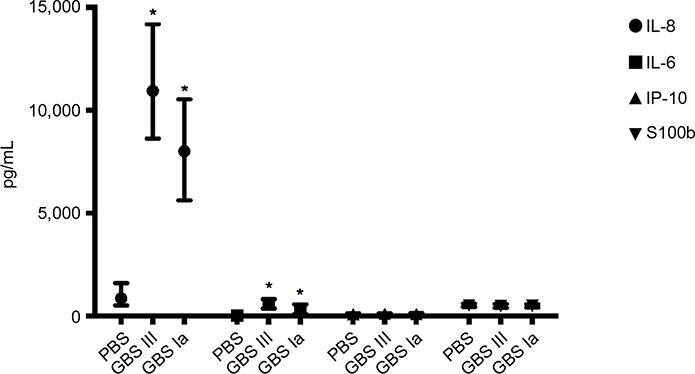 | Figure 3 Soluble inflammatory biomarkers. Notes: Values are presented as median with interquartile range. *P<0.05 compared with PBS control. Abbreviations: GBS, group B streptococcus; PBS, phosphate-buffered saline; IL, interleukin; IP, interferon-γ-inducing protein. |
IL-6 increased 85-fold from baseline and 40-fold that of PBS control samples. Both GBS III- and GBS Ia-stimulated samples had higher IL-6 levels compared with 2-hour PBS controls (P<0.001 for both GBS subtypes).
IL-8 showed a large interindividual variation, with a 1,000-fold increase in IL-8 from baseline and a 12-fold increase compared with PBS control in GBS III-stimulated samples. Both GBS III- and GBS Ia-stimulated samples had higher IL-8 levels compared with 2-hour PBS controls (P<0.001 for both GBS subtypes).
IP-10 was not different in GBS III- or GBS Ia-stimulated samples compared with 2-hour PBS controls (P>0.05) or compared with baseline.
S100b was not different in GBS III- or GBS Ia-stimulated samples compared with 2-hour PBS controls (P>0.05) or compared with baseline.
Correlation between leukocyte surface receptors and soluble markers
IL-6 correlated significantly with TLR2 (r =0.41, P<0.001), but not with TLR4 (r =0.22, P=0.060) and TLR6 (r =0.10, P=0.39). The correlations between IL-6 and CD11b on granulocytes, CD11b on monocytes, and CD64 were significant (r =0.55, P<0.001; r =0.45, P<0.001; and r =0.34, P=0.002, respectively).
IL-8 correlated with TLR2 (r =0.67, P<0.001), TLR4 (r =0.42, P<0.001), and TLR6 (r =0.31, P=0.005). The correlations between IL-8 and CD11b on granulocytes, CD11b on monocytes, and CD64 were significant (r =0.78, P<0.001; r =0.70, P<0.001; and r =0.41, P<0.001, respectively).
IP-10 correlated with CD64 (r =0.47, P<0.001), TLR2 (r =0.26, P=0.02), and TLR4 (r =0.29, P=0.01), but not with CD11b on granulocytes (r =0.14, P=0.22) or monocytes (r =0.13, P=0.26).
S100b only correlated with TLR6 (r =0.34, P=0.003).
AUC, sensitivity, and specificity
AUC values for the biomarkers are presented in Table 3. GBS III gave the highest responses and AUC values for all biomarkers. Only IL-6 and IL-8 displayed an AUC approaching 0.8 for both GBS serotypes (P<0.001). IL-8 >5,292 pg/mL had both a sensitivity and a specificity of 1.00. IL-6 >197 pg/mL had both a sensitivity and a specificity of 0.95 for GBS III stimulation. CD11b on granulocytes and monocytes were the leukocyte surface markers with the highest AUC values for both GBS serotypes.
Discussion
In this in vitro model of HUCB designed to mimic EONS, IL-6, IL-8, and CD11b were significantly elevated after 2 hours of GBS stimulation and could be sensitive and specific biomarkers of neonatal GBS sepsis at an early stage.
The GBS III isolate was from a neonate with confirmed EONS with typical clinical signs of sepsis, and we thus believe that the responses demonstrated in the present in vitro model can have direct relevance to clinical GBS infection. The commercially available GBS Ia gave weaker and in general insignificant responses, potentially due to attenuation caused by multiple laboratory passages. In addition, GBS III is known to cause more invasive disease than other serotypes.21
The ideal biomarker should be practical and sensitive and result in a larger therapeutic window and improved neonatal outcomes. Due to the potential devastating consequences of not detecting a GBS infection, we determined cutoff values for each biomarker based on a desire to maximize sensitivity at the expense of a lower specificity. Cost and processing time are feasible for analyses of the soluble biomarkers and could be implemented in routine laboratory and clinical practice. Flow cytometry requires the presence of skilled personnel and is not routinely used for acute clinical analyses in most centers yet. Future research in the area may include measuring inflammatory marker expression by real-time polymerase chain reaction, as well as other inflammatory markers such as inducible nitric oxide synthase, cyclooxygenase-2, and nitrite.
Cell surface markers
CD11b is normally expressed at a very low concentration on the surface of nonactivated neutrophils, but increases within 5 minutes of exposure to bacteria or endotoxin.22,23 This is in accordance with our time series experiments and results showing a marked increase 2 hours after exposure to GBS. Neutrophil CD11b has been found to be a promising marker for diagnosis of early infections.22 Two hours after the onset of GBS III stimulation, CD11b on granulocytes was the inflammatory marker with the highest specificity (100%) at a cutoff value that gave the test at least a 95% sensitivity, which is excellent. The cutoff value was higher than in other studies,23–26 which may be due to calibration issues and local procedures. Importantly, the other studies reported values from septic patients colonized with different types of pathogens, whereas we report values from simulated very early neonatal GBS sepsis.
In this study, CD64 has a much lower specificity for GBS stimulation compared with CD11b, in particular, for GBS Ia. Choo et al27 showed that the diagnostic accuracy of CD64 was superior to CRP when measured at the time of suspected sepsis. However, in comparison to CD11b, CD64 may be a more effective marker for the diagnosis of late-onset infection,28,29 which might be a reason for the discordant findings in our model of early-onset GBS sepsis.
The TLR-mediated inflammatory response to neonatal pathogens seems to be differentially regulated by different pathogens.30 In simulated GBS sepsis we found that only TLR2 had a reasonable sensitivity and specificity for GBS III, but not for GBS Ia.
Soluble markers
The cytokines IL-6 and IL-8 were markedly elevated in GBS-stimulated HUCB. IL-6 and IL-8 had a strong positive correlation, indicating that both these markers may be useful in the diagnosis of early GBS sepsis.
IL-8 was the one marker with the strongest positive correlation to all the other parameters, except for IP-10 and S100b. IL-8 was also the marker with the greatest increase and the highest AUC for both GBS subtypes. We have previously shown that simulated Escherichia coli infection is significantly associated with increased IL-8.16 IL-8 is a potent activator and chemoattractant of neutrophils and has been demonstrated to upregulate neutrophil CD11b. IL-8 thus stands out as a representative biomarker for the inflammatory cascade associated with very early GBS disease and is synthesized much earlier after exposure to an infective process or tissue damage than CRP.31 As the concentration of CRP increases rather slowly in the initial phase, CRP has been considered a specific but late marker of neonatal infection.32 It has previously been argued that the most reliable laboratory test is the combined measurement of CRP and a cytokine (IL-6 and IL-8), besides clinical symptoms.33 IL-8 in combination with either CRP34 or CD11b24 has been suggested. Our results indicate that this may be a reasonable approach, even very early (2 hours) and at a low GBS load (108 GBS/mL) simulating the first stages of developing sepsis.
S100b, a biomarker available for routine analysis in our hospital, was not increased in our experiments, which could be due to the in vitro HUCB model used. S100b is not restricted to neuronal tissues,35 but may be elevated in blood during severe sepsis alone, and release of S100b may also depend on the gestational age of the infant.36 It has been speculated that the rate of release of serum S100b can be a sensitive readout of ongoing sepsis, but we could not prove any increase in S100b after 2 hours of stimulation. We cannot rule out that S100b may be a tentative biomarker for late-onset sepsis and septic or asphyctic encephalopathy.37,38 This needs further research.
Utility of the HUCB model system
HUCB is composed of all the elements found in neonatal whole blood and is rich in hematopoietic cells. Besides using HUCB as a model for EONS, incubating HUCB from neonates with risk factors for sepsis to measure inflammatory biomarkers may offer a noninvasive diagnostic option. IL-6 and IL-8, as well as CD11b respond early, and analysis of these biomarkers may be feasible within 2 hours if cord blood is harvested in high risk deliveries for neonatal sepsis.
Strengths and limitations
We analyzed two different strains of GBS, one of which was isolated from a septic neonate. The simulated GBS sepsis response was tested in time–response and dose–response experiments in blood that until birth had been circulating in the newborn infant. Current knowledge supports our findings and our study generates hypotheses to be further explored in the clinical setting. GBS III is the predominant strain in early-onset GBS sepsis, but still only represents about half of the infections. Thus, if a biomarker is not appreciably elevated in infection with other type strains, one could argue that it would not be reliable in detecting early-onset GBS sepsis in general. However, the commercially available GBS Ia strain has been exposed to several steps of preparation, which may attenuate the strains pathogenicity.
We did not relate the biomarker responses to the concentration of leukocytes in the HUCB, but our model represents a natural habitat of leukocytes with leukocyte and biomarker concentrations as in vivo. Variations in leukocyte numbers should therefore be representative for the natural variation. As pregnant women without risk factors or symptoms of infection are not routinely screened for GBS in Norway, the GBS status of the women from which we harvested HUCB was unknown. Different GBS colonization status in the women may have contributed to the large interindividual variation in the biomarker responses.
The model does not include responses in vivo and inflammatory responses in body tissues and organ involvement in sepsis are therefore excluded. A large number of hypotheses were tested and statistical tests were performed without adjusting for multiple comparisons. However, we consider it less probable that the main findings could be due to statistical coincidences because of the systematic trend, in particular, in the IL-8, IL-6, and CD11b observations.
Finally, the cord blood was harvested from only term pregnancies. Premature neonates may display immune system immaturity beyond that of term babies, which could specifically predispose premature newborns to bacterial infection resulting in organ sequelae.43 The fact that a majority of newborn infants who receive antibiotic treatment are preterm, and therefore more likely to benefit from avoiding unnecessary treatment, may limit the applicability of our results. However, chemokines including IL-6 and IL-8 have been found to be unaffected by gestational and postnatal age,28 and neutrophils from preterm infants express CD64 during bacterial infections similar to those from term infants.34 Also, the majority of early-onset GBS sepsis still occurs in term infants.
Conclusion
GBS resulted in marked changes in inflammatory cell receptors and cytokines in a model of very early neonatal GBS sepsis. IL-8 and IL-6, as well as CD11b on monocytes and neutrophils are sensitive and specific biomarkers of simulated GBS infection. HUCB as a model and diagnostic tool has a widespread potential.
Acknowledgments
We wish to thank the participating women and the staff in the labor unit at Akershus University Hospital for facilitating the collection of blood samples for the study. We also wish to thank Truls M Leegaard, Anita Blomfeldt, and Trond E Ranheim at the Department of Multidisciplinary Laboratory Medicine and Biochemistry, Division of Diagnostics and Technology for help in obtaining GBS cultures for the study, all employed at Akershus University Hospital, Lørenskog, Norway.
Author contributions
All authors contributed toward data analysis, drafting and critically revising the paper and agree to be accountable for all aspects of the work.
Disclosure
The authors report no conflicts of interest in this work.
References
Weisner AM, Johnson AP, Lamagni TL, et al. Characterization of group B streptococci recovered from infants with invasive disease in England and Wales. Clin Infect Dis. 2004;38(9):1203–1208. | ||
Zaleznik DF, Rench MA, Hillier S, et al. Invasive disease due to group B Streptococcus in pregnant women and neonates from diverse population groups. Clin Infect Dis. 2000;30(2):276–281. | ||
Harrison LH, Elliott JA, Dwyer DM, et al. Serotype distribution of invasive group B streptococcal isolates in Maryland: implications for vaccine formulation. Maryland Emerging Infections Program. J Infect Dis. 1998;177(4):998–1002. | ||
Edmond KM, Kortsalioudaki C, Scott S, et al. Group B streptococcal disease in infants aged younger than 3 months: systematic review and meta-analysis. Lancet. 2012;379(9815):547–556. | ||
Bauserman MS, Laughon MM, Hornik CP, et al. Group B Streptococcus and Escherichia coli infections in the intensive care nursery in the era of intrapartum antibiotic prophylaxis. Pediatr Infect Dis J. 2013;32(3):208–212. | ||
Centers for Disease Control and Prevention. Diminishing racial disparities in early-onset neonatal group B streptococcal disease – United States, 2000–2003. MMWR Morb Mortal Wkly Rep. 2004;53(23):502–505. | ||
Stoll BJ, Hansen NI, Sanchez PJ, et al; Eunice Kennedy Shriver National Institute of Child Health and Human Development Neonatal Research Network. Early onset neonatal sepsis: the burden of group B Streptococcal and E. coli disease continues. Pediatrics. 2011;127(5):817–826. | ||
Weston EJ, Pondo T, Lewis MM, et al. The burden of invasive early-onset neonatal sepsis in the United States, 2005-2008. Pediatr Infect Dis J. 2011;30(11):937–941. | ||
Zhou M, Cheng S, Yu J, Lu Q. Interleukin-8 for diagnosis of neonatal sepsis: a meta-analysis. PLoS One. 2015;10(5):e0127170. | ||
Marty C, Misset B, Tamion F, Fitting C, Carlet J, Cavaillon JM. Circulating interleukin-8 concentrations in patients with multiple organ failure of septic and nonseptic origin. Crit Care Med. 1994;22(4):673–679. | ||
Andaluz-Ojeda D, Bobillo F, Iglesias V, et al. A combined score of pro- and anti-inflammatory interleukins improves mortality prediction in severe sepsis. Cytokine. 2012;57(3):332–336. | ||
Halstensen A, Ceska M, Brandtzaeg P, Redl H, Naess A, Waage A. Interleukin-8 in serum and cerebrospinal fluid from patients with meningococcal disease. J Infect Dis. 1993;167(2):471–475. | ||
Wangala B, Vovor A, Gantin RG, et al. Chemokine levels and parasite- and allergen-specific antibody responses in children and adults with severe or uncomplicated Plasmodium falciparum malaria. Eur J Microbiol Immunol (Bp). 2015;5(1):131–141. | ||
Huang H, Tu L. Expression of S100 family proteins in neonatal rats with sepsis and its significance. Int J Clin Exp Pathol. 2015;8(2):1631–1639. | ||
Rogers LK, Graf AE, Bhatia A, Leonhart KL, Oza-Frank R. Associations between maternal and infant morbidities and sRAGE within the first week of life in extremely preterm infants. PLoS One. 2013;8(12):e82537. | ||
Osterholt HC, Lundeland B, Sonerud T, Saugstad OD, Nakstad B. The impact of hyaluronan on monocyte Toll-like receptor expression in term infant cord blood. Acta Paediatr. 2012;101(7):706–713. | ||
Haddeland U, Brandtzaeg P, Nakstad B. Maternal allergy influences the proliferation of neonatal T cells expressing CCR4, CXCR5 or CD103. Clin Exp Allergy. 2007;37(6):856–864. | ||
Haddeland U, Karstensen AB, Farkas L, et al. Putative regulatory T cells are impaired in cord blood from neonates with hereditary allergy risk. Pediatr Allergy Immunol. 2005;16(2):104–112. | ||
Haddeland U, Sletten GB, Brandtzaeg P, Nakstad B. Impaired interleukin (IL)-4-associated generation of CCR4-expressing T cells in neonates with hereditary allergy risk. Clin Exp Immunol. 2005;139(2):314–322. | ||
Gutteberg TJ, Dalaker K, Vorland LH. Early response in neonatal septicemia. The effect of Escherichia coli, Streptococcus agalactiae and tumor necrosis factor on the generation of lactoferrin. APMIS. 1990;98(11):1027–1032. | ||
Davies HD, Jones N, Whittam TS, Elsayed S, Bisharat N, Baker CJ. Multilocus sequence typing of serotype III group B streptococcus and correlation with pathogenic potential. J Infect Dis. 2004;189(6):1097–1102. | ||
Ng PC. Diagnostic markers of infection in neonates. Arch Dis Child Fetal Neonatal Ed. 2004;89(3):F229–F235. | ||
Weirich E, Rabin RL, Maldonado Y, et al. Neutrophil CD11b expression as a diagnostic marker for early-onset neonatal infection. J Pediatr. 1998;132(3 Pt 1):445–451. | ||
Nupponen I, Andersson S, Jarvenpaa AL, Kautiainen H, Repo H. Neutrophil CD11b expression and circulating interleukin-8 as diagnostic markers for early-onset neonatal sepsis. Pediatrics. 2001;108(1):E12. | ||
Adib M, Ostadi V, Navaei F, et al. Evaluation of CD11b expression on peripheral blood neutrophils for early detection of neonatal sepsis. Iran J Allergy Asthma Immunol. 2007;6(2):93–96. | ||
Genel F, Atlihan F, Gulez N, et al. Evaluation of adhesion molecules CD64, CD11b and CD62L in neutrophils and monocytes of peripheral blood for early diagnosis of neonatal infection. World J Pediatr. 2012;8(1):72–75. | ||
Choo YK, Cho HS, Seo IB, Lee HS. Comparison of the accuracy of neutrophil CD64 and C-reactive protein as a single test for the early detection of neonatal sepsis. Korean J Pediatr. 2012;55(1):11–17. | ||
Ng PC, Li K, Wong RP, Chui KM, Wong E, Fok TF. Neutrophil CD64 expression: a sensitive diagnostic marker for late-onset nosocomial infection in very low birthweight infants. Pediatr Res. 2002;51(3):296–303. | ||
Fjaertoft G, Hakansson L, Ewald U, Foucard T, Venge P. Neutrophils from term and preterm newborn infants express the high affinity Fcgamma-receptor I (CD64) during bacterial infections. Pediatr Res. 1999;45(6):871–876. | ||
Sugitharini V, Pavani K, Prema A, Berla Thangam E. TLR-mediated inflammatory response to neonatal pathogens and co-infection in neonatal immune cells. Cytokine. 2014;69(2):211–217. | ||
Vigushin DM, Pepys MB, Hawkins PN. Metabolic and scintigraphic studies of radioiodinated human C-reactive protein in health and disease. J Clin Invest. 1993;91(4):1351–1357. | ||
Ng PC, Cheng SH, Chui KM, et al. Diagnosis of late onset neonatal sepsis with cytokines, adhesion molecule, and C-reactive protein in preterm very low birthweight infants. Arch Dis Child Fetal Neonatal Ed. 1997;77(3):F221–F227. | ||
Umlauf VN, Dreschers S, Orlikowsky TW. Flow cytometry in the detection of neonatal sepsis. Int J Pediatr. 2013;2013:763191. | ||
Franz AR, Steinbach G, Kron M, Pohlandt F. Reduction of unnecessary antibiotic therapy in newborn infants using interleukin-8 and C-reactive protein as markers of bacterial infections. Pediatrics. 1999;104(3 Pt 1):447–453. | ||
Haimoto H, Hosoda S, Kato K. Differential distribution of immunoreactive S100-alpha and S100-beta proteins in normal nonnervous human tissues. Lab Invest. 1987;57(5):489–498. | ||
Gazzolo D, Vinesi P, Bartocci M, et al. Elevated S100 blood level as an early indicator of intraventricular hemorrhage in preterm infants. Correlation with cerebral Doppler velocimetry. J Neurol Sci. 1999;170(1):32–35. | ||
Rodriguez-Gonzalez R, Ramos-Nuez A, Martin-Barrasa JL, et al. Endotoxin-induced lung alveolar cell injury causes brain cell damage. Exp Biol Med (Maywood). 2015;240(1):135–142. | ||
Hamed SA, Hamed EA, Abdella MM. Septic encephalopathy: relationship to serum and cerebrospinal fluid levels of adhesion molecules, lipid peroxides and S-100B protein. Neuropediatrics. 2009;40(2):66–72. | ||
Strunk T, Currie A, Richmond P, Simmer K, Burgner D. Innate immunity in human newborn infants: prematurity means more than immaturity. J Matern Fetal Neonatal Med. 2011;24(1):25–31. |
 © 2016 The Author(s). This work is published and licensed by Dove Medical Press Limited. The
full terms of this license are available at https://www.dovepress.com/terms
and incorporate the Creative Commons Attribution
- Non Commercial (unported, 3.0) License.
By accessing the work you hereby accept the Terms. Non-commercial uses of the work are permitted
without any further permission from Dove Medical Press Limited, provided the work is properly
attributed. For permission for commercial use of this work, please see paragraphs 4.2 and 5 of our Terms.
© 2016 The Author(s). This work is published and licensed by Dove Medical Press Limited. The
full terms of this license are available at https://www.dovepress.com/terms
and incorporate the Creative Commons Attribution
- Non Commercial (unported, 3.0) License.
By accessing the work you hereby accept the Terms. Non-commercial uses of the work are permitted
without any further permission from Dove Medical Press Limited, provided the work is properly
attributed. For permission for commercial use of this work, please see paragraphs 4.2 and 5 of our Terms.