Back to Journals » International Journal of General Medicine » Volume 12
Dyslipidemia in diabetes: a population-based study in Bali
Authors Suastika K ![]() , Semadi IMS
, Semadi IMS ![]() , Dwipayana IMP
, Dwipayana IMP ![]() , Saraswati MR
, Saraswati MR ![]() , Gotera W
, Gotera W ![]() , Budhiarta AAG
, Budhiarta AAG ![]() , Matsumoto K, Kajiwara N, Taniguchi H
, Matsumoto K, Kajiwara N, Taniguchi H
Received 13 May 2019
Accepted for publication 15 August 2019
Published 2 September 2019 Volume 2019:12 Pages 313—321
DOI https://doi.org/10.2147/IJGM.S215548
Checked for plagiarism Yes
Review by Single anonymous peer review
Peer reviewer comments 2
Editor who approved publication: Dr Scott Fraser
Ketut Suastika,1 I Made Siswadi Semadi,1 I Made Pande Dwipayana,1 Made Ratna Saraswati,1 Wira Gotera,1 Anak Agung Gde Budhiarta,1 Kinuyo Matsumoto,2 Naemi Kajiwara,2 Hiroshi Taniguchi3
1Division of Endocrinology and Metabolism, Department of Internal Medicine, Faculty of Medicine, Udayana University/Sanglah Hospital, Denpasar, Bali, Indonesia; 2Graduate School of Life Science, Kobe Women’s University, Kobe, Japan; 3Department of Diabetology, Graduate School of Health Sciences, Kobe University, Kobe, Japan
Correspondence: Ketut Suastika
Division of Endocrinology and Metabolism, Department of Internal Medicine, Faculty of Medicine, Udayana University/Sanglah Hospital, Jalan Kamboja, Denpasar, Bali, Indonesia
Tel +62 81 138 0916
Email [email protected]
Purpose: To establish the lipid pattern in subjects with diabetes mellitus (DM) and factors that are correlated with insulin resistance and lipid disorders in a population of Bali.
Methods: A cross-sectional population-based study which enrolled 1840 subjects (age 13–100 years) from 7 villages was carried out. Several clinical parameters were measured including age, gender, body mass index, waist circumference (WC), fasting blood glucose, total cholesterol (TC), triglycerides (TG), high-density lipoprotein cholesterol (HDL-C), low-density lipoprotein cholesterol (LDL-C), apolipoprotein (apo) A (apoA), apoB, non-HDL-C, T/HDL-C ratio, LDL-C/apoB ratio, apoB/A ratio, plasma insulin, and homeostasis of model assessment-insulin resistance (HOMA-IR).
Results: TC, TG, and non-HDL-C levels were higher in DM subjects than in normal glucose tolerance (NGT) subjects in both genders; total/HDL-C ratio was higher in subjects with DM than in NGT subjects only in men; LDL-C levels, apoB levels, and apoB/A ratios were higher and LDL/apoB was lower in subjects with DM than in NGT in women. In subjects with DM, the target for LDL-C (79%), non-HDL-C (85.2%), apoB (80%), HDL-C (34.9%), TG (46.7%), and small-dense low density lipoprotein (42.2%) was not achieved.
Conclusion: FBG was correlated with TC, TG, LDL-C, apoB, non-HDL-C levels, LDL/apoB, and apoB/apoA ratios. Subjects with DM had higher levels of TC, TG, and non-HDL-C levels in both genders; T/HDL-C ratio only in men; LDL-C, apoB/apoA ratio and lower LDL/apoB ratio only in women. Obesity was correlated with lipid levels. WC was correlated with LDL/apoB ratio, insulin level, HOMA-IR, and TG; highest absolute strength of correlation was with LDL/apoB ratio. Insulin resistance was correlated with lipid levels or ratios, especially in women. In women, HOMA-IR had a positive correlation with total/HDL-C ratio, non-HDL-C, apoB, and a negative correlation with HDL-C levels.
Keywords: HOMA-IR, dyslipidemia, diabetes
Introduction
Prevalence of diabetes mellitus (DM) is still increasing globally. Based on IDF Diabetes Atlas 2017, the prevalence of DM was 327 million among those aged 20–64 years and 98 million among those aged 65–79 years in 2017 and is estimated to be 438 million among those aged 20–64 years and 191 million among those aged 65–79 years in 2045.1 Diabetes is one of several traditional and main risk factors for atherosclerotic cardiovascular disease (ASCVD). The risk of ASCVD in DM is aggravated by common conditions coexisting with DM, especially type 2 DM (T2DM), eg, hypertension and dyslipidemia.2 A cross-sectional study in a representative sample of 5375 residents of Chongqing, aged ≥18 years, which estimated the prevalence of dyslipidemia and its associated risk factors was conducted by Qi et al.3 In the study, based on the National Cholesterol Education Program-Adult Treatment Panel III criteria, the prevalence of dyslipidemia was 35.5%. Among the 2009 patients with dyslipidemia, 44.2% had isolated hypertriglyceridemia, 14.7% had isolated hypercholesterolemia, 13.2% had mixed hyperlipidemia, and 28.0% had isolated low high-density lipoprotein cholesterol (HDL-C). Multivariable logistic regression analysis revealed that dyslipidemia was associated with age, education level, physical activity, obesity, and central obesity for both men and women.
The link between DM and ASCVD is, however, not completely understood. Hyperglycemia or glycemic control in DM is generally associated with development and poor outcome of ASCVD. Metabolic abnormalities such as disorders of production and clearance of plasma lipoprotein commonly accompany DM. Insulin resistance may be the important surrogate factor of how diabetes and obesity are related to dyslipidemia. The characteristic pattern of diabetic dyslipidemia is low HDL-C, increased triglycerides (TG), increased numbers of small-dense low-density lipoprotein (sdLDL), and postprandial lipemia. Lipid pattern in DM and the mechanisms of dyslipidemia in DM and their effects on ASCVD have been well-reviewed in several review articles.4–7
A report on prevalence, treatment and control of dyslipidemia among United States adults with DM, within the cross-sectional National Health and Nutrition Examination Survey 1999–2000, showed that less than one-third of men and only one-fifth of women with DM have controlled low-density lipoprotein cholesterol (LDL-C) (defined as <100 mg/dL); over half of men and over two-thirds of women have low levels of HDL-C (≤40 mg/dL in men or ≤50 mg/dL in women), and over half have elevated levels of TG (≥150 mg/dL). Low HDL-C was more common in Caucasians (70.1%) than in Hispanics (58.8%) or African-Americans (41.5%); 28.2% of subjects with diabetes were on lipid-lowering treatment.8
Epidemiological data on dyslipidemia in DM in Indonesia are limited and almost all subjects are scattered. The purpose of this study was to establish the lipid pattern in subjects with DM and factors that are correlated with insulin resistance and lipid disorders in a population of Bali. The result is expected to be a resource for planning prevention of ASCVD in the future in Indonesia, which has huge absolute numbers of people with DM.
Methodology
A cross-sectional survey study on dyslipidemia in DM among a population across Bali Island was carried out. A representative stratified proportionate random sample of 1840 subjects (aged 13–100 years) was enrolled from 7 villages which represented a population with different geographic characteristics (Sangsit, seashore area, 471 subjects; Pedawa, mountainous area, native Balinese, 294 subjects; Ubud, lowland and tourist area, 301 subjects; Tenganan, upland area, native Balinese, 81 subjects; Ceningan, offshore island, 305 subjects; Legian, coastal and tourist area, 288 subjects; and Pengelipuran, upland area, 100 subjects). The villages were chosen using proportionate stratified sampling. The sample size in each village depended on the size of the village population. The target sample was between 100–500 from each village according to the size of the population. We used the cut-off age of 13 years in this study because the policy in Indonesia states that age cut-off for patients in internal medicine was above 12 years old. All participants provided written informed consent, and a parent or legal guardian provided written informed consent for participants under the age of 18 years, in accordance with the Declaration of Helsinki.
Several clinical parameters were measured included age, gender, body mass index (BMI), and waist circumference (WC). Biochemical parameters included fasting blood glucose (FBG), total cholesterol (TC), TG, HDL-C, LDL-C, apolipoprotein (apo) A (apoA), apoB, non-HDL-C (TC minus HDL-C), T/HDL-C ratio, LDL-C/apoB ratio, apoB/A ratio, plasma insulin, and homeostasis model assessment of insulin resistance (HOMA-IR). Plasma apoA and apoB levels were measured only in 591 subjects, and plasma insulin and HOMA-IR were measured in only 322 subjects.
Classification of impaired fasting glycemia (IFG) and DM was based on the American Diabetes Association (2018),9 ie, IFG if FBG levels were ≥100 mg/dL and <126 mg/dL; and DM if FBG level was ≥126 mg/dL. Normal glucose tolerance (NGT) was defined as the level of blood glucose 2 hours after oral glucose tolerance test lower than 140 mg/dL. Non-HDL-C was determined by TC minus HDL-C. Based on lipid levels target of therapy in subjects with DM, several lipid parameters were categorized as uncontrolled or out of target if LDL-C was ≥100 mg/dL, non-HDL cholesterol ≥130 mg/dL, apoB ≥90 mg/dL, HDL-C ≤40 mg/dL in men and ≤50 mg/dL in women, and TG ≥150 mg/dL.9,10 sdLDL was defined as LDL-C/apoB ratio <1.2. HOMA-IR was calculated by formula: (fasting insulin [mU/mL] x FBG [mg/dL])/405.
The data of this study were expressed descriptively. The correlations between clinical parameters were analyzed by Pearson’s correlation coefficient; ANOVA with Fisher’s least significant difference post hoc test was used to compare means of various biochemical or clinical parameter measures across three groups (NGT, IFG, and DM). Chi-squared test for association or independence was used for the comparison between the level of LDL-C, apoB, HDL-C, TG, and sdLDL among NGT, IFG, and DM group. In all statistical analyses, values of p<0.05 were considered to indicate significant statistical analysis.
The study was approved by Ethical Committee Faculty of Medicine Udayana University and Sanglah Hospital (Ethical Certification No. 211/Skrt/V/2008).
Results
The characteristics of subjects by gender were shown in Table 1. The correlation between obesity (measured by BMI and WC) and lipid pattern, insulin and HOMA-IR was shown in Table 2. In general, BMI and WC had a significant correlation with lipid levels and ratios except BMI with total/HDL-C ratio, insulin and HOMA-IR and WC with LDL-C. WC, but not BMI, had a correlation with insulin and HOMA-IR (r=0.360, p<0.001; and r=0.355, p<0.001; respectively). HOMA-IR only had a correlation with HDL-C level (r=−0.304, p<0.001) in men, whereas in women, HOMA-IR had a correlation with TG level (r=0.268, p=0.001), HDL-C level (r=−0.285, p<0.001), apoB (r=0.292, p=0.017), non-HDL-C (r=0.307, p=0.011), total/HDL-C ratio (r=0.386, p=0.001), and apoB/A ratio (r=0.271, p=0.026) (Table 3). The association between FBG and lipid levels by gender was shown in Table 4. FBG had a very weak correlation with TC, TG, and non-HDL-C levels in men (r=0.085, p=0.010; r=0.134, p<0.001; r=0.072, p=0.030; respectively). In women, FBG was significantly correlated with more lipid parameters compared to men, ie, with TC (r=0.241, p<0.001), TG (r=0.337, p<0.001), LDL-C (r=0.147, p=0.002), apoB (r=0.299; p<0.001), non-HDL-C (r=0.258, p<0.001), LDL/apoB ratio (r=−0.200, p=0.001), and apoB/A ratio (r=0.232, p<0.001). FBG with TG and HOMA-IR had the two highest levels of correlation, especially in women, compared to other lipid levels and ratios, but values of correlation coefficient r actually implied a weak relationship between FBG and TG and a moderate relationship between FBG and HOMA-IR (Table 4). The difference in lipid levels and ratios by glucose tolerance were shown in Table 5. In men, TC (201.08 vs 185.15 mg/dL, p=0.003), TG (162.41 vs 128.27 mg/dL, p=0.002), and non-HDL-C (154.83 vs 139.33 mg/dL, p=0.003) levels were significantly higher in subjects with DM compared to subjects with NGT. In women, TC (217.97 vs 186.01 mg/dL, p<0.001), TG (173.22 vs 98.03 mg/dL, p<0.001), LDL-C (138.36 vs 118.35 mg/dL, p=0.002), apoB (121.17 vs 87.15 mg/dL, p<0.001), non-HDL-C (167.55 vs 132.91 mg/dL, p<0.001), LDL/apoB ratio (1.23 vs 1.37, p=0.002), and apoB/A ratio (0.84 vs 0.63, p<0.001) levels or ratios were significantly higher (except for LDL/apoB ratio which was lower) among subjects with DM than subjects with NGT.
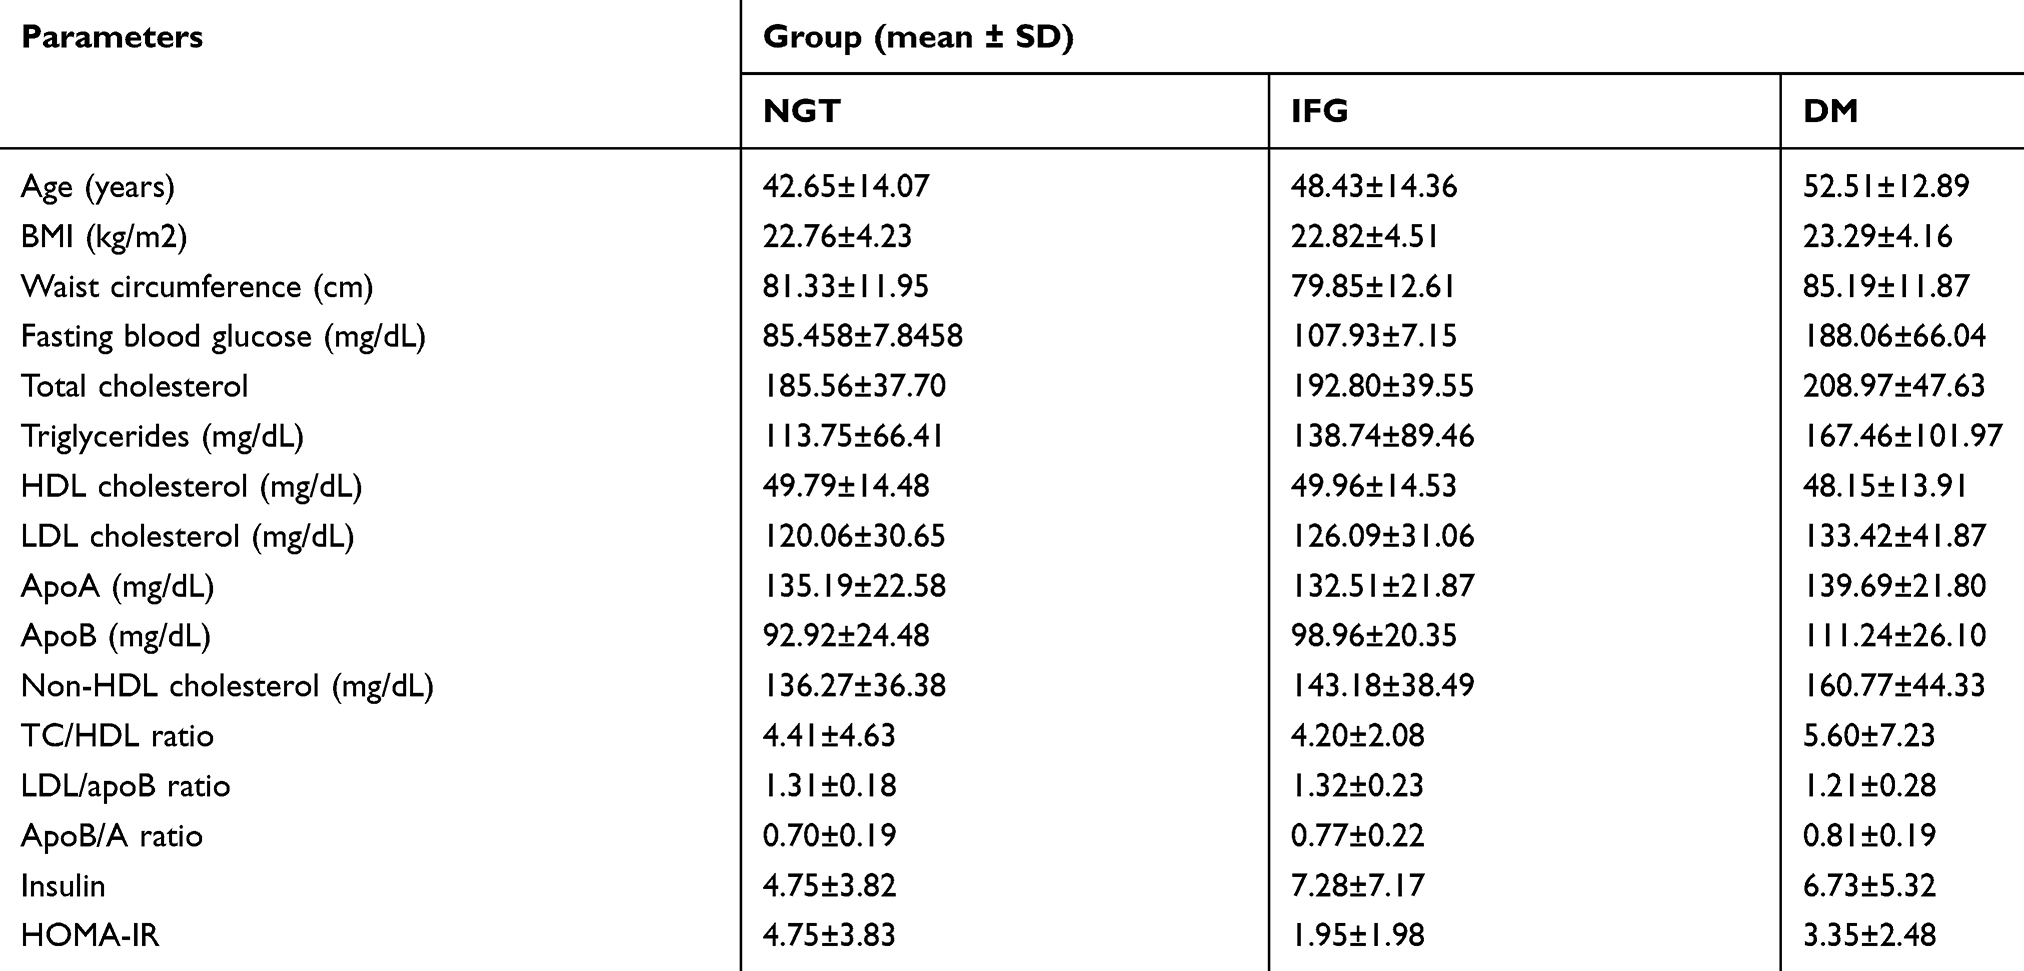 |
Table 1 Characteristics of the study population by glucose tolerance (n=1840) |
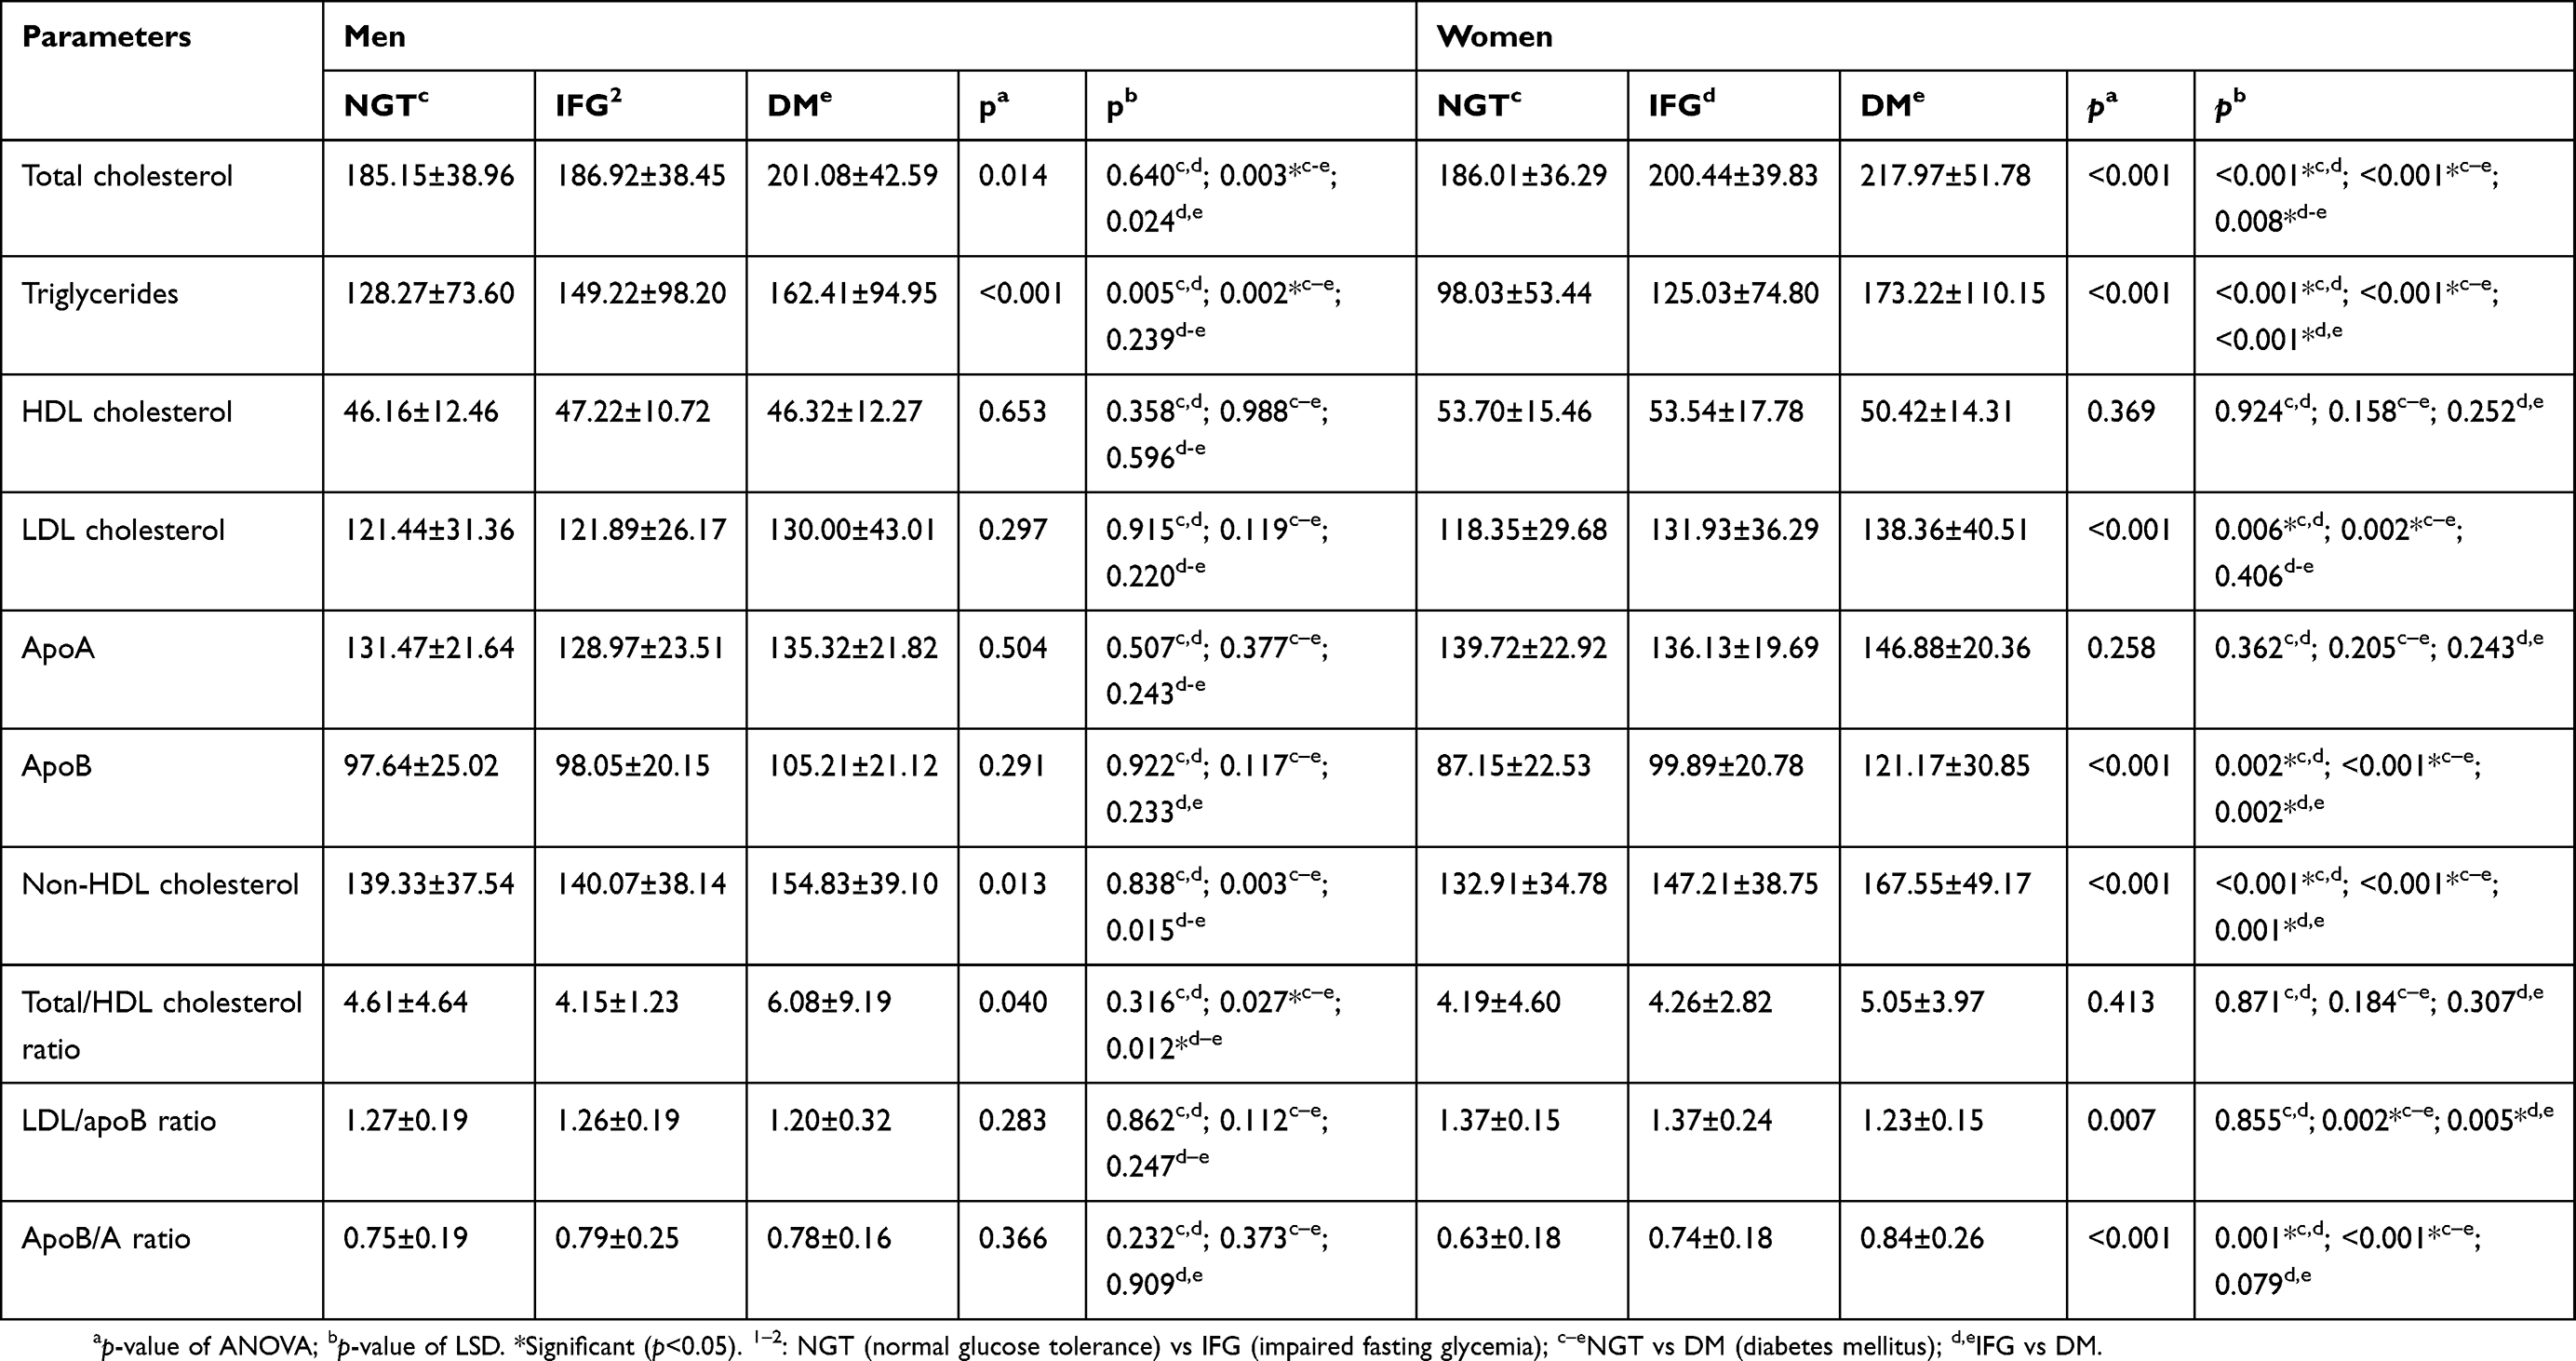 |
Table 2 Mean lipid profile by gender and glucose tolerance in the study population (n=1840) |
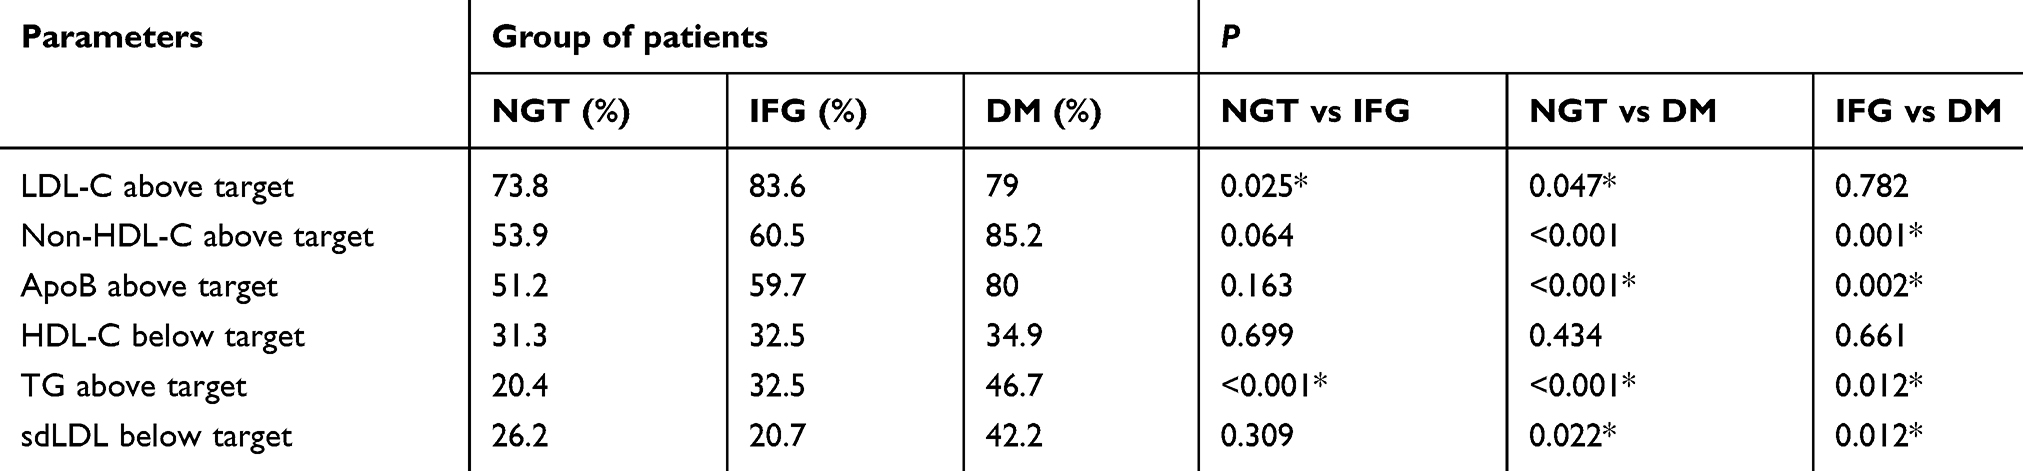 |
Table 3 Distribution of dyslipidemia by glucose tolerance |
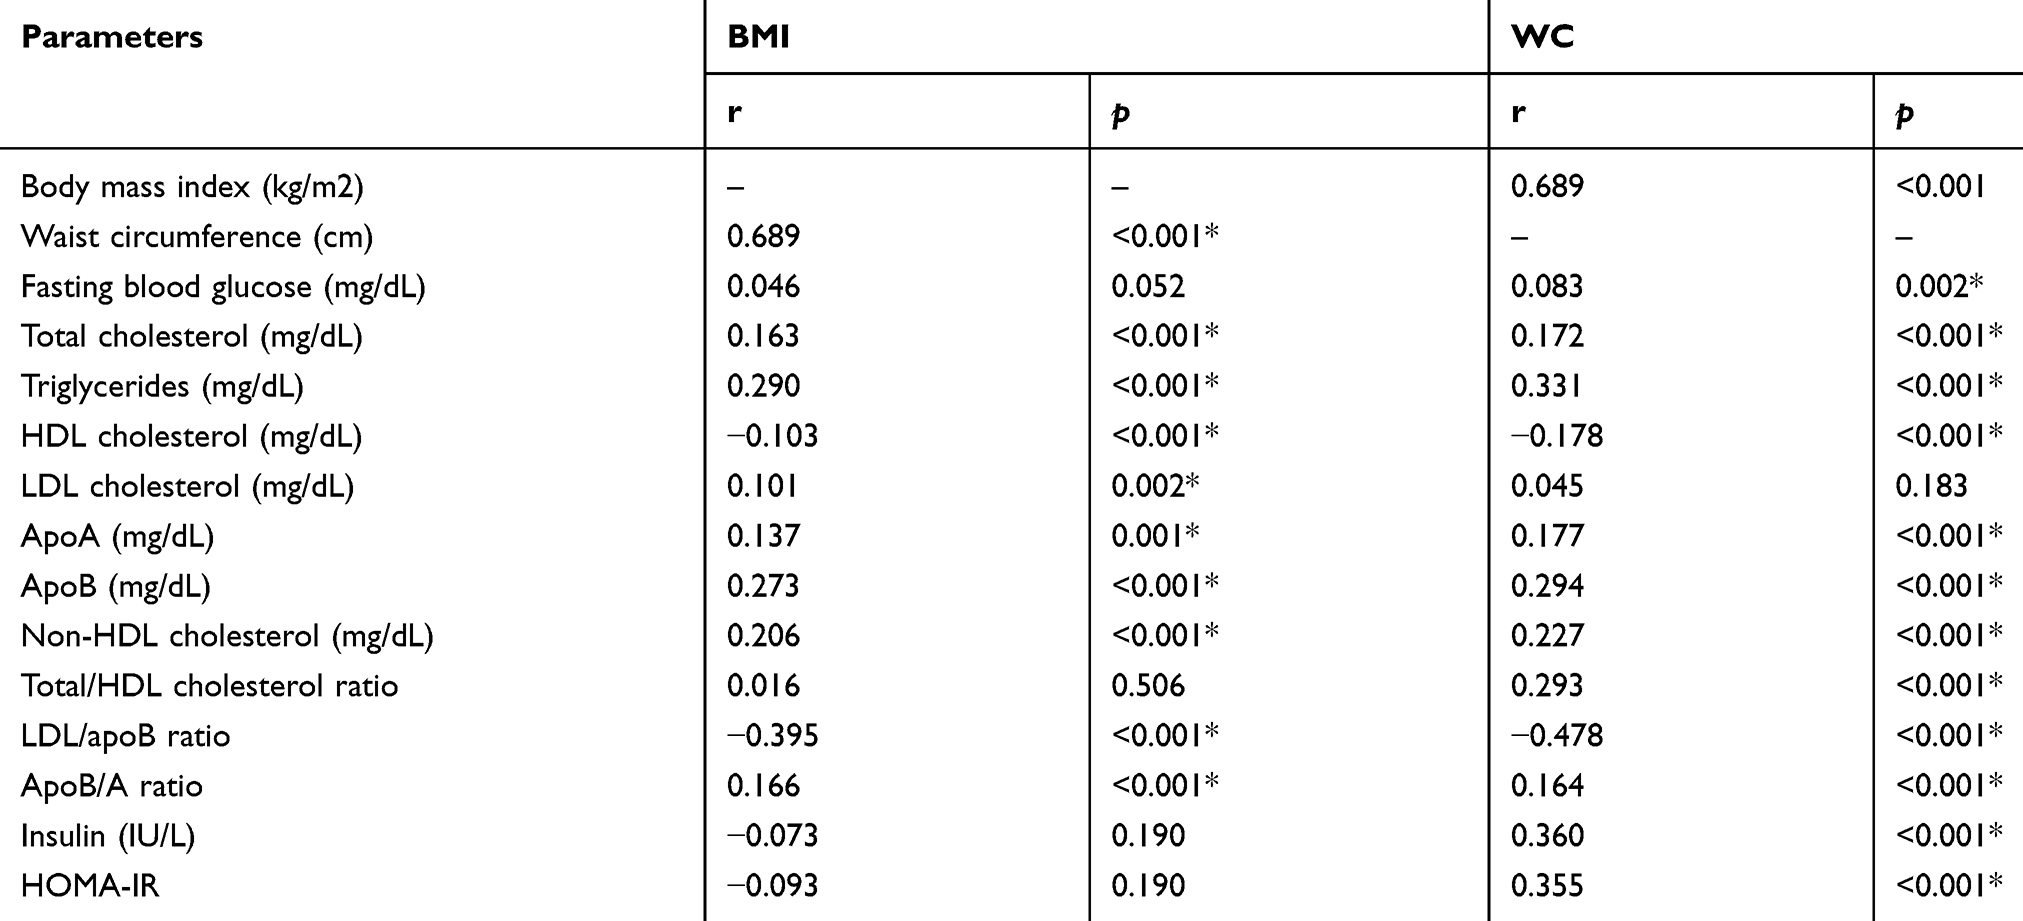 |
Table 4 Correlation of BMI and WC and FBG, lipid levels, insulin, and HOMA-IR |
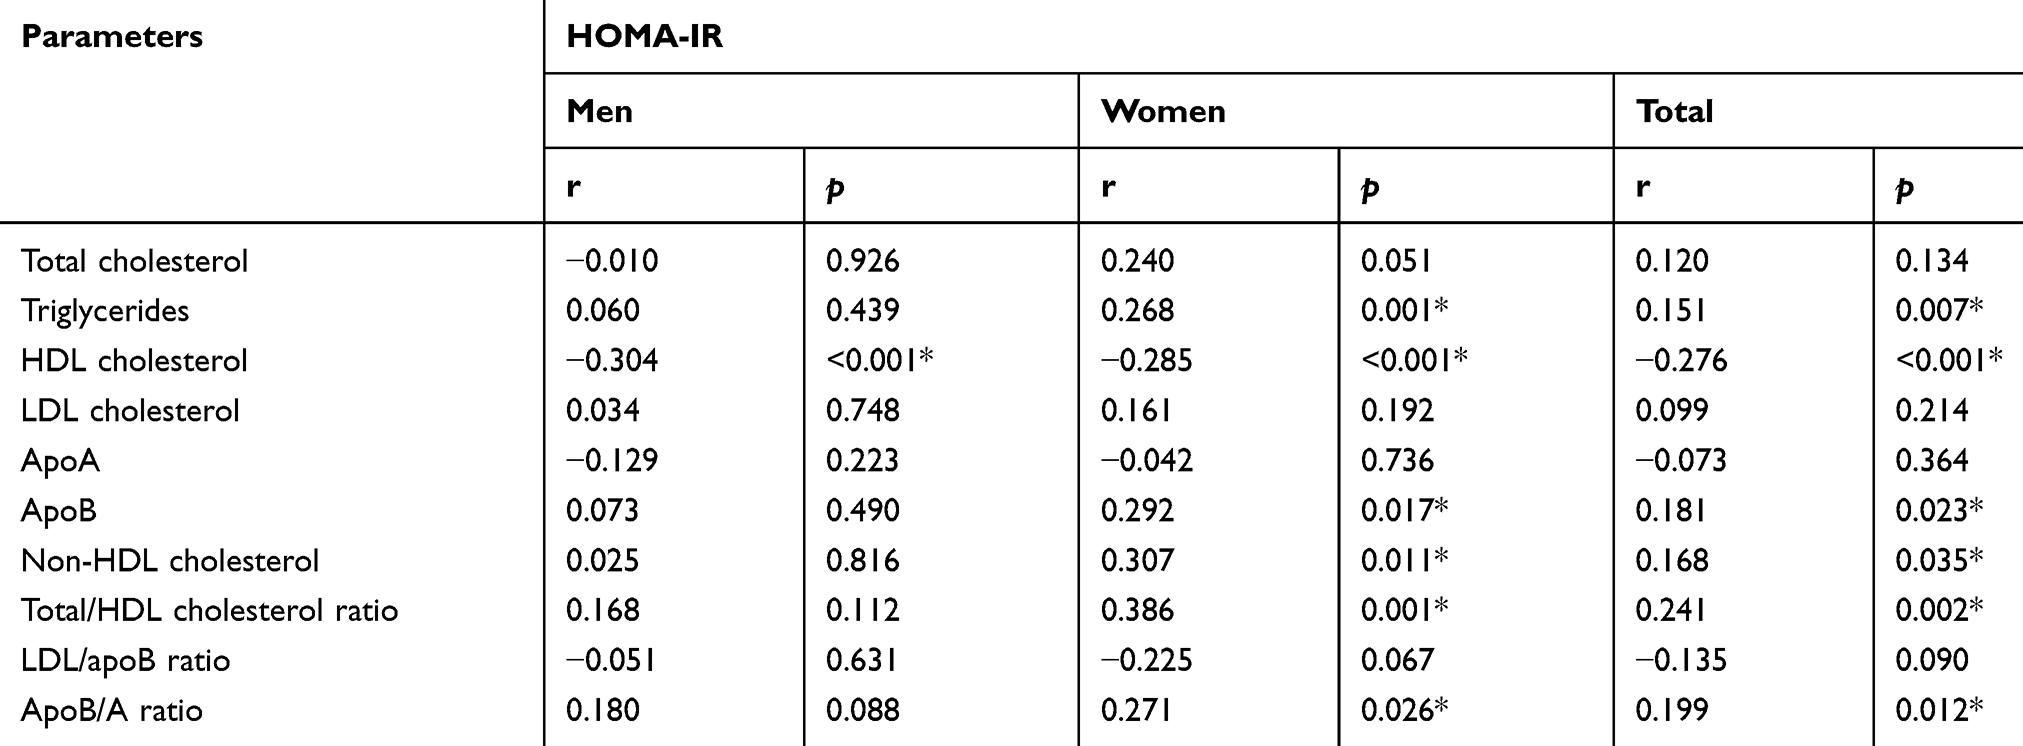 |
Table 5 Correlation of HOMA-IR and lipid levels |
Based on lipid level treatment target, the number of subjects with DM who had not achieved the target was high. The frequency of uncontrolled lipid levels and sdLDL was found to be higher in subjects with DM than in subjects with NGT and IFG (except LDL-C level which was higher in subjects with IFG compared to subjects with DM). The prevalence of uncontrolled dyslipidemia target in subjects with DM was as follows: high LDL-C was 79.0%, high non-HDL-C was 85.2%, high apoB was 80%, low HDL-C was 34.9%, high TG was 46.7%, and sdLDL was 42.2% (Figure 1). There was a significant difference between the level of LDL-C in NGT vs IFG (p=0.025) and NGT vs DM group (p=0.047). The level of non HDL-C was significantly different only in IFG vs DM group (p=0.001). The levels of apoB and sdLDL were significantly different in NGT vs DM (p<0.001 and p=0.022) and IFG vs DM group (p=0.002 and p=0.012). The level of TG was significantly different in NGT vs IFG (p<0.001), NGT vs DM (p<0.001), and IFG vs DM group (p<0.012) (Table 6). This study did not consider the use of lipid-lowering agents in the subjects because the subjects were villagers who rarely consumed lipid-lowering agents.
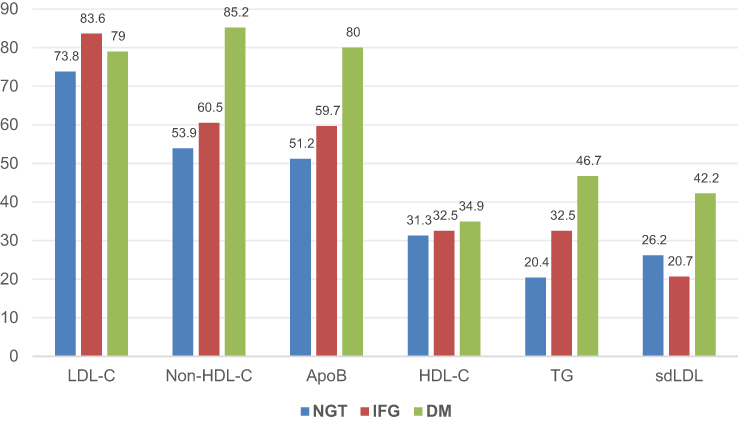 |
Figure 1 Frequency of dyslipidemia by glucose tolerance (percent). LDL-C (≥100 mg/dL), non-HDL-C (≥130 mg/dL), apoB (≥90 mg/dL), HDL-C (men <40 mg/dL, women <50 mg/dL), TG (≥150 mg/dL), sdLDL (LDL-C/apoB <1.2). |
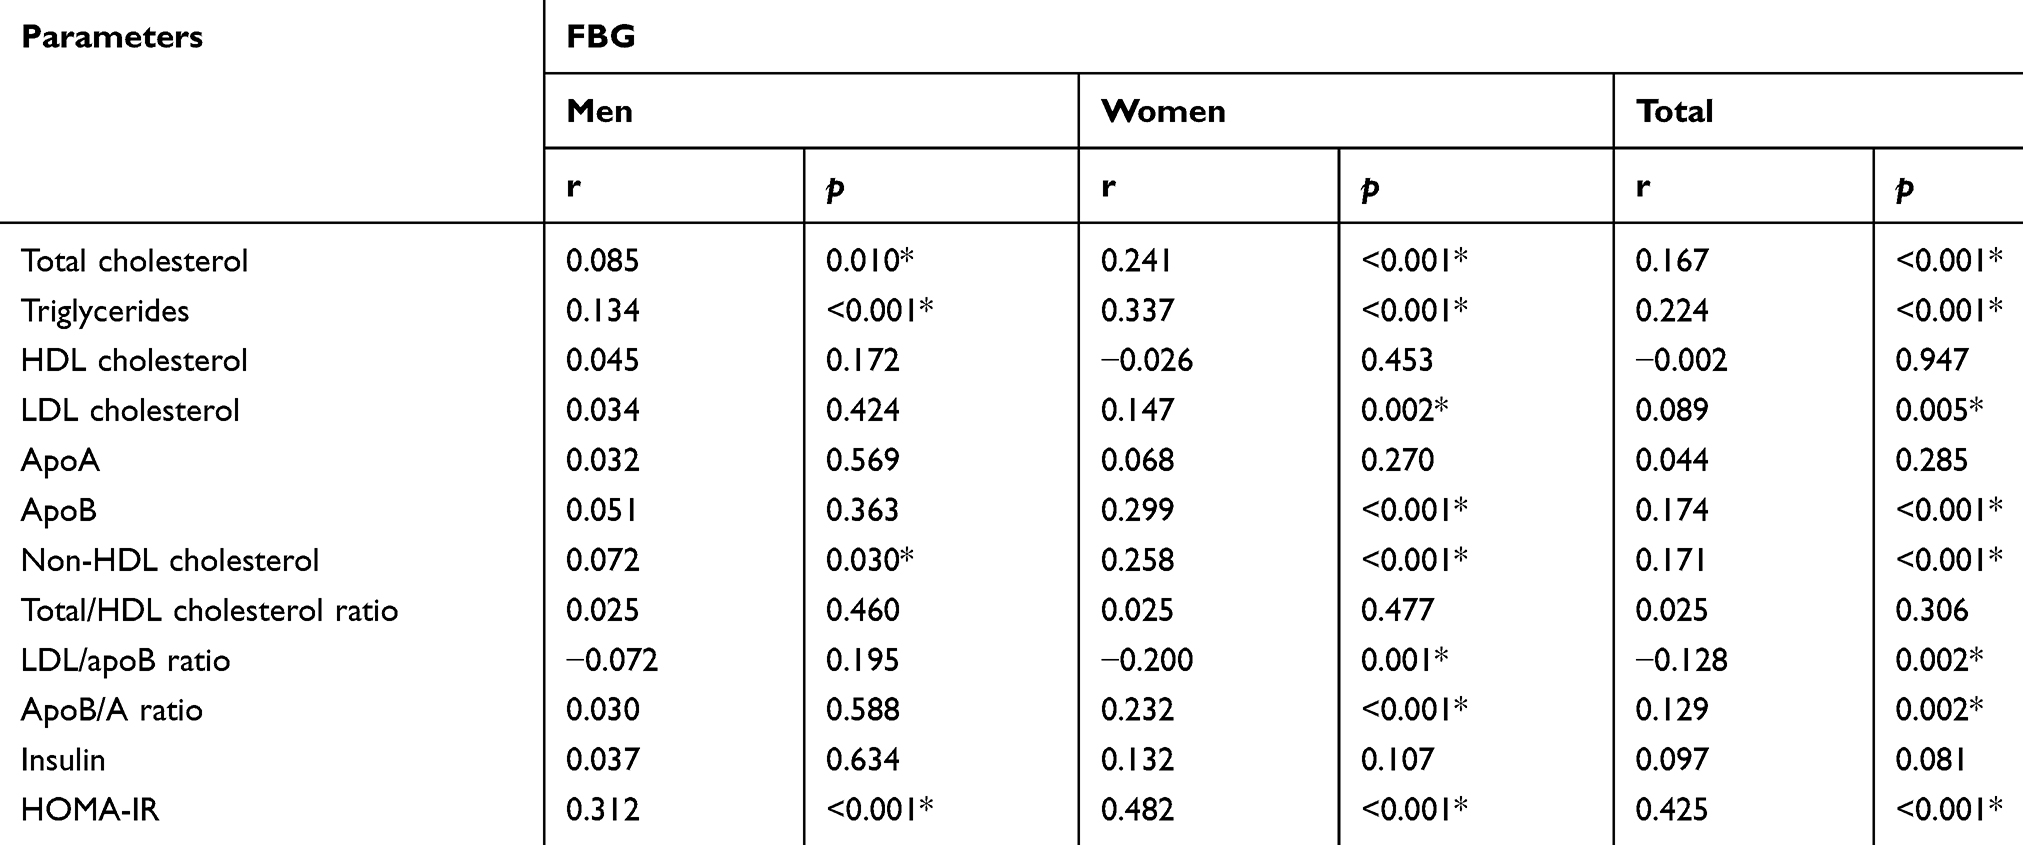 |
Table 6 Correlation of FBG and lipid levels, insulin and HOMA-IR |
Discussion
It was found, in this study, that obesity had a correlation with lipid levels. WC mainly had a correlation with LDL/apoB ratio, insulin level, HOMA-IR, and TG. Insulin resistance (HOMA-IR) had a correlation with lipid levels or ratios, especially in women. In women, HOMA-IR mainly had a correlation with total/HDL-C ratio, non-HDL-C, apoB, and HDL-C (negative correlation) levels.
Prevalence of DM and dyslipidemia increases with increased BMI. The clinical manifestations of obesity related to glucose and lipid metabolism disorders are hyperglycemia, elevated very low density lipoprotein (VLDL) TG and apoB (sdLDL), low HDL-C, and metabolic syndrome.11,12 It is consistent with the results of this study which found that WC, as one parameter of obesity, had a correlation with LDL/apoB ratio, insulin level, HOMA-IR, and TG. A population-based study in Georgia revealed that insulin resistance (HOMA-IR) was positively correlated with age, apoB, apoB/apoA-I ratio, metabolic syndrome components (excluding HDL-C), LDL-C, fasting insulin, and TC and negatively correlated with HDL-C and apoA-I in both genders. In the logistic regression models, gender, age, apoB/apoA-I ratio, diastolic pressure, HDL-C, LDL-C, FBG, and TG were the covariates significantly associated with IR.13 Environmental factors such as smoking influenced the lipid profile (by aggravating atherogenic dyslipidemia) in subjects with insulin resistance.14 Similar to other studies, this study also showed that obesity and insulin resistance had a consistent correlation with levels of TG, HDL, apoB, and LDL/apoB ratio (atherogenic dyslipidemia). Non-HDL-C, an important risk factor for ASCVD, also had a correlation with obesity and insulin resistance in this study.
This study showed that FBG had a correlation with TC, TG, LDL-C, apoB, non-HDL-C levels, LDL/apoB, and apoB/apoA ratios. Subjects with DM had higher levels of TC, TG, and non-HDL-C levels in both genders; T/HDL-C ratio only in men; LDL-C, apoB/apoA ratio and lower LDL/apoB ratio only in women. Both carbohydrate and lipid metabolism are interconnected with their physiological pathways. Obviously, alteration of one affects the other.
Prevalence of dyslipidemia in India, defined as derangement or abnormality in any one of the serum lipids, was found to be 97.2%. Dyslipidemia in DM individuals with good glycemic control was better than in those with poor glycemic control.15 FBG level correlated significantly with TC, TG, and VLDL-C.16 A study on prevalence and pattern of dyslipidemia among T2DM patients at a rural-based hospital in Gujarat, India reported by Pandya et al,17 revealed that mean serum cholesterol level was 188.9±43.70, mean serum TG was 174.6±69.44, mean serum HDL was 46.2±17.08, mean serum LDL was 105.9±34.06, and mean serum VLDL level was 33.4±11.08 mg/dL. Out of 171 DM patients, 36.3% patients had high serum cholesterol level, 35.7% had low serum HDL level, 56.1% had high serum TG level, 57.3% had serum LDL level above normal range; and 49.7% showed high serum VLDL level. A study enrolling 5400 patients with T2DM from 178 centers across India, showed the following: primary end-point of LDL-C level below ADA 2010 target was achieved in a total of 48.74% patients. Gender and age were associated with lipid levels. Control rates of HDL-C, TG, and TC were 60.48%, 57.54%, and 92.2%, respectively.18 ApoB/apoA1 ratio was found to be significantly higher in diabetic patients when compared to normal subjects. The apoB, TC, LDL-C, and apoB/apoA1 ratio showed a positive correlation with insulin resistance. ApoA1 showed a negative correlation with insulin resistance. Subjects with diabetes had higher TG, apoB, and apoB/apoA1 ratio, and lower HDL-C and apoA1 than in control subjects.19 A study in China showed that apoB/apoA-I ratios were significantly increased across the spectrum of individuals with NGT, pre-diabetes, and T2DM. Women showed higher levels of apoB/apoA-I ratio and apoB than men in the pre-diabetic and T2DM groups, but not in the NGT group.20 Patterns of lipid level or ratio are very similar between all studies, which DM mediated by insulin resistance induces atherogenic dyslipidemia. The prevalence of subjects with uncontrolled lipid levels in this study was higher than in the studies in India (previously mentioned), it may be due to different sample-based recruitment. Both reports from India were hospital-based, whereas our report was population-based in some villages in Bali in which all subjects were not treated. A study by Zheng et al, in China, did not include prevalence of uncontrolled lipid levels in diabetes patients.20
DM, through insulin resistance, can induce dyslipidemia, but otherwise dyslipidemia can also become a predictor of development of DM in the future. Themechanism might be mediated metabolically or through genetic background.21 Insulin resistance is responsible for: a) a reduction in apoB degradation, leading to an increased apoB level in hepatocytes (including apoB degradation by PERPP); b) increased MTP expression; and c) increased activity of two factors involved in the formation of VLDL1, phospholipase D1, and ARF-1. Moreover, peripheral insulin resistance is responsible for increased levels of NEFA, which activate VLDL production.22
Genetic predisposition has a role in the relationship of dyslipidemia and T2DM risk. Low HDL-C genotype score or high TG genotype score are related to elevated T2DM risk.21 In a 4-year retrospective longitudinal study in non-diabetic Korean subjects, the ratio of TC to HDL and apoB to HDL showed a significant association with increased risk of T2DM: odds ratio 1.340 (95% confidence interval 1.166–1.538); and 1.338 (95% confidence interval 1.162–1.540), respectively. The odds ratio for the development of type 2 diabetes increased significantly as the tertiles of the baseline ratio of TC to HDL and apoB to HDL increased from the first to the third tertile.23 The difference or variation of dyslipidemia levels or pattern between several studies may be partly influenced by difference in environmental and genetic background.
Conclusion
In this study we could therefore conclude that: 1) FBG had a correlation with TC, TG, LDL-C, apoB, non-HDL-C levels, LDL/apoB, and apoB/apoA ratios; 2) subjects with DM had higher levels of TC, TG, and non-HDL-C levels in both genders; T/HDL-C ratio only in men; LDL-C, apoB/apoA ratio and lower LDL/apoB ratio only in women; 3) obesity was correlated with lipid levels; 4) WC was correlated with LDL/apoB ratio, insulin level, HOMA-IR, and TG; highest absolute strength of correlation was with LDL/apoB ratio; 5) insulin resistance was correlated with lipid levels or ratios, especially in women; and 6) in women, HOMA-IR had a positive correlation with total/HDL-C ratio, non-HDL-C, apoB, and a negative correlation with HDL-C levels. Our focus on the treatment of lipid abnormalities in diabetes could decrease the risk of cardiovascular events. It will lead to the expectation that patients with diabetes will have longer, healthier lives.
Acknowledgment
This study was funded by the Udayana University Faculty of Medicine, Denpasar, Indonesia, Kobe Women’s University, Japan, and partly supported by a Grant-in-Aid for Scientific Research (B): Overseas Grant (Grant No. 12576021 and 20406018) from the Japan Society for the Promotion of Science, Japan.
Disclosure
The authors declared no conflicts of interest in this work.
References
1. International Diabetes Federation. IDF diabetes atlas. Eight Edition 2017. Online version of IDF Diabetes Atlas: www.diabetesatlas.org. ISBN: 978-2-930229-87-4. Accessed in June 25, 2018.
2. American Diabetes Association. Cardiovascular disease and risk management: standards of Medical Care in Diabetes-2018. Diabetes Care. 2018;41(Suppl. 1):S86–S104. doi:10.2337/dc18-0733
3. Qi L, Ding X, Tang W, Li Q, Man D, Wang Y. Prevalence and risk factors associated with dyslipidemia in Chongqing, China. Int J Inviron Res Public Health. 2015;12:13455–13465. doi:10.3390/ijerph121013455
4. Goldberg IJ. Diabetic dyslipidemia: causes and consequences. J Clin Endoc Met. 2001;86:965–971. doi:10.1210/jcem.86.3.7304
5. Brunzell JD, Davidson M, Furberg CD, et al. Lipoprotein management in patients with cardiometabolic risk. consensus statement from the American Diabetes Association and the American College of Cardiology Foundation. Diabetes Care. 2008;31:811–822. doi:10.2337/dc08-9018
6. Miller M, Stone NJ, Ballantyne C, et al. Triglycerides and cardiovascular disease? A scientific statement from the American Heart Association. Circulation. 2011;123:2292–2333. doi:10.1161/CIR.0b013e3182160726
7. Schofield JD, Liu Y, Rao-Balakrisna P, Malik RA, Soran H. Diabetes Dyslipidemia. Diabetes Ther. 2016;7:203–219. doi:10.1007/s13300-016-0167-x
8. Jacobs MJ, Kleisli T, Pio RJ, et al. Prevalence and control of dyslipidemia among persons with diabetes in the United States. Diab Res Clin Pract. 2005;70:263–269. doi:10.1016/j.diabres.2005.03.032
9. Xiang AH, Wang X, Martinez MP, et al.; American Diabetes Association. Maternal gestational diabetes mellitus, Type 1 diabetes, and Type 2 diabetes During pregnancy and risk of ADHD in Offspring. Diabetes Care. 2018;41(Suppl. 12):S2502–S2508. doi:10.2337/dc18-0733
10. Jellinger PS, Handelsman Y, Rosenblit PD, et al. AACE 2017 guidelines. American Association of Clinical Endocrinologists and American College of Endocrinology guidelines for management of dyslipidemia and prevention of cardiovascular disease. Endocr Pract. 2017;23(Suppl 2):1–87. doi:10.4158/EP171764.APPGL
11. Bays HE, Toth PP, Kris-Etherton PM, et al. Obesity, adiposity, and dyslipidemia: a consensus statement from the National Lipid Association. J Clin Lipidol. 2013;7:304–383. doi:10.1016/j.jacl.2013.04.001
12. Klop B, Elte JWF, Cabezas MCC. Dyslipidemia in obesity: mechanisms and potential targets. Nutrients. 2013;5:1218–1240. doi:10.3390/nu5041218
13. Makaridze Z, Giorgadze E, Asatiani K. Association of the Apolipoprotein B/Apolipoprotein A-I ratio, metabolic syndrome components, total cholesterol, and low-density lipoprotein cholesterol with insulin resistance in the population of Georgia. Internat J Endocrinol. 2014;2014:8. Article ID 925650. doi:10.1155/2014/925650
14. Cibickova L, Karasek D, Langova K, et al. Correlation of lipid parameters and markers of insulin resistance: does smoking make a difference? Physiol Res. 2014;63(Suppl. 3):S387–S393.
15. Kaithala C, Namburi HK, Bandaru SS, Bandaru SBS, Adla N, Puchchakayala G. Prevalence of dyslipidemia and its association with glycemic control in Indian Type 2 diabetes population. Rom J Diabetes Nutr Metab Dis. 2016;23:277–283.
16. Dixit AK, Dey R, Suresh A, et al. The prevalence of dyslipidemia in patients with diabetes mellitus of ayurveda Hospital. J Diabetes Metab Dis. 2014;13:58. doi:10.1186/2251-6581-13-58
17. Pandya H, Lakhani JD, Dadhania J, Trivedi A. The prevalence and pattern of Dyslipidemia among Type 2 diabetic patients at Rural Based Hospital in Gujarat, India. Indian J Clin Pract. 2012;22:36–44.
18. Mithal A, Majhi D, Shunmugavelu M, Talwarkar PG, Vasnawala H, Raza AS. Prevalence of dyslipidemia in adult Indian diabetic patients: a cross sectional study (SOLID). Indian J Endocrinol Metab. 2014;18:642–647. doi:10.4103/2230-8210.139220
19. Sathvika RP, Abraham P, Sudha R, Jones E. Assessment of insulin resistance and ApoB/ApoA1 ratio in Type Ii diabetes patients. Nat J Basic Med Sci. 2013;3:211–215.
20. Zheng S, Han T, Xu H, et al. Associations of apolipoprotein B/apolipoprotein A-I ratio with pre-diabetes and diabetes risks: a cross-sectional study in Chinese adults. MJ Open. 2017;7:e014038. doi:10.1136/bmjopen-2016-014038
21. Qi Q, Liang L, Doria A, Hu FB, Qi L. Genetic predisposition to dyslipidemia and Type 2 diabetes risk in two prospective cohorts. Diabetes. 2012;61:745–752. doi:10.2337/db11-1254
22. Verges B. Pathophysiology of diabetic dyslipidemia: where are we? Diabetologia. 2015;58:886–899.
23. Seo MH, Bae JC, Park SE, et al. Association of lipid and lipoprotein profiles with future development of Type 2 Diabetes in nondiabetic Korean subjects: a 4-year retrospective, longitudinal study. J Clin Endocrinol Metab. 2011;96:E2050–E2054. doi:10.1210/jc.2011-1857
 © 2019 The Author(s). This work is published and licensed by Dove Medical Press Limited. The
full terms of this license are available at https://www.dovepress.com/terms
and incorporate the Creative Commons Attribution
- Non Commercial (unported, 3.0) License.
By accessing the work you hereby accept the Terms. Non-commercial uses of the work are permitted
without any further permission from Dove Medical Press Limited, provided the work is properly
attributed. For permission for commercial use of this work, please see paragraphs 4.2 and 5 of our Terms.
© 2019 The Author(s). This work is published and licensed by Dove Medical Press Limited. The
full terms of this license are available at https://www.dovepress.com/terms
and incorporate the Creative Commons Attribution
- Non Commercial (unported, 3.0) License.
By accessing the work you hereby accept the Terms. Non-commercial uses of the work are permitted
without any further permission from Dove Medical Press Limited, provided the work is properly
attributed. For permission for commercial use of this work, please see paragraphs 4.2 and 5 of our Terms.