Back to Journals » Drug Design, Development and Therapy » Volume 15
Dynamics of Endocytosis and Degradation of Antibody-Drug Conjugate T-DM1 in HER2 Positive Cancer Cells
Authors Liang K, Mei S, Gao X, Peng S, Zhan J
Received 12 October 2021
Accepted for publication 14 December 2021
Published 24 December 2021 Volume 2021:15 Pages 5135—5150
DOI https://doi.org/10.2147/DDDT.S344052
Checked for plagiarism Yes
Review by Single anonymous peer review
Peer reviewer comments 2
Editor who approved publication: Dr Tuo Deng
Keying Liang, Shengsheng Mei, Xiangzheng Gao, Shanshan Peng, Jinbiao Zhan
Department of Biochemistry, Cancer Institute of the Second Affiliated Hospital (Key Laboratory of Cancer Prevention and Intervention, China National Ministry of Education), School of Medicine, Zhejiang University, Hangzhou, 310058, People’s Republic of China
Correspondence: Jinbiao Zhan
Department of Biochemistry, Cancer Institute of the Second Affiliated Hospital (Key Laboratory of Cancer Prevention and Intervention, China National Ministry of Education), School of Medicine, Zhejiang University, Hangzhou, Zhejiang, 310058, People’s Republic of China
Tel/Fax +86 571-88208273
Email [email protected]
Purpose: T-DM1 is an antibody–drug conjugate (ADC) consisting of trastuzumab and DM1 linked together. T-DM1 binds to human epidermal growth factor receptor-2 (HER2) in tumors and then triggers the endocytosis of T-DM1 and release of payload. Therefore, endocytosis efficacy is considered as a critical step for the initiation of T-DM1 therapy; however, the endocytosis mechanism of T-DM1 remains poorly understood. Meanwhile, HER2 is regarded as an internalization-resistant receptor, which hinders the endocytosis and effectiveness of T-DM1. The present study is to explore the T-DM1 endocytosis pathway, which may provide insights into the internalization mechanism of ADCs and help to improve efficacy.
Methods: Confocal microscopy and flow cytometry were used to analyse T-DM1 intracellular trafficking and endocytosis efficiency, while Western blot assay was performed to detect T-DM1 degradation.
Results: We found that intracellular T-DM1 was increased to 50% within 12 h. T-DM1 was colocalized with cholera toxin B (CTxB), a lipid raft marker, within 2 h and then degraded in lysosome. Upon overexpression of caveolin-1 (CAV-1) and utilization of caveolae/lipid-raft disruptors, we found that temporal CAV-1 upregulation significantly facilitated T-DM1 endocytosis and degradation, whereas nystatin and lovastatin disrupted caveolae/lipid-raft structure and inhibited T-DM1 degradation. We demonstrate that T-DM1 internalizes through the lipid raft-mediated endocytosis in a CAV-1 dependent manner, rather than through the clathrin-mediated endocytosis in HER2-positive cancer cells.
Conclusion: Our findings suggest that modulation of the caveolae/lipid-raft mediated endocytosis may be a possible option for improving the clinical therapeutic effect of T-DM1 because it plays a key role in regulating T-DM1 internalization.
Keywords: antibody–drug conjugate, T-DM1, endocytosis, lipid rafts, caveolae, caveolin-1
Introduction
Trastuzumab emtansine (T-DM1) is an antibody–drug conjugate composed of monoclonal antibody trastuzumab against HER2 and cytotoxic payload DM1 connected by a covalent linker. It has been approved by the FDA for the treatment of HER2 positive metastatic breast cancer. Although patients with HER2 positive breast cancer have received encouraging clinical benefits from T-DM1 treatment, progressive drug resistance, HER2 heterogeneity and insensitivity may occur in patients, affecting the disease-free survival.1,2 In order to improve the efficacy and safety of ADCs, a better understanding of the mechanism of action is especially important. Upon binding to HER2, T-DM1 is able to be internalized via HER2 receptor-mediated endocytosis and releases the free toxin into the cytosol. This means that the anti-cancer efficacy of T-DM1 mainly relies on their uptake by HER2 positive cancer cells. However, the mechanism of T-DM1 and HER2 internalization has not yet to be fully elucidated.
As a special member of ErbB-family, HER2 is known as an orphan receptor and is prevalently expressed on the cell surface.3 It has also been reported that HER2 is resistant to endocytosis by forming a stable complex with heat shock protein 90 (Hsp90)4,5 or internalized HER2 rapidly recycles to the plasma membrane.6–8 HER2 has previously been found to be concentrated on the membrane protrusions and to colocalize with monosialoteterahexosyl ganglioside (GM1), a lipid raft marker.9 Moreover, HER2 has been reported to interact with Hsp90 and raft-associated flotillin-1 to form the complex and stabilize at the plasma membrane.10 These results suggest that HER2 may be located in the lipid raft microdomains.
Lipid raft is microdomain located in the plasma membrane and is enriched with cholesterol and sphingolipid. Caveolae is considered as the major subtype of lipid raft. Caveolae/lipid raft mediates the internalization of ligands, receptors and extracellular molecules, such as cholera toxin B (CTxB), albumin and Simian virus 40 (SV40) in a clathrin-independent endocytosis. Caveolin-1 (CAV-1) is the main scaffolding protein of caveolae. As one of the isoforms of the caveolin family in mammals, CAV-1 is abundantly expressed in various tissues.11 Besides, CAV-1 is involved in many biological events, such as cholesterol homeostasis, receptor-mediated endocytosis, cancer cell migration and metastasis, signal transduction and lipid transport.12 Several lines of investigation have found that CAV-1 is associated with the cell-surface HER2 level,13–15 affects trastuzumab binding16,17 and T-DM1 internalization.18–20 All these findings have raised questions about how T-DM1 is internalized and what the role CAV-1 plays in T-DM1 endocytosis.
In this study, confocal microscopy and flow cytometry were used to detect the internalization efficacy of T-DM1. We also employed the overexpression, knockdown of CAV-1, and two caveolae/lipid raft disruptors to evaluate the role of CAV-1 in T-DM1 endocytosis. All the experiments demonstrate that CAV-1 modulates the T-DM1 internalization via caveolae/lipid raft-mediated endocytosis.
Materials and Methods
Cell Lines and Cell Culture
Human gastric carcinoma NCI-N87 cells, breast cancer cell lines BT474, MDA-MB 453 and MDA-MB 231 were obtained from ATCC. NCI-N87 (ATCC Cat# CRL-5822, RRID: CVCL_1603) and BT474 (ATCC, Cat# HTB-20, RRID: CVCL_0179) were grown in DMEM (Biological Industries, Cat# 06-1055-57-1ACS). MDA-MB 453 (ATCC, Cat# HTB-131, RRID: CVCL_0418) and MDA-MB 231 (ATCC, Cat# HTB-26, RRID: CVCL_0026) were grown in RPMI 1640 (Biological Industries, Cat# 01-100-1ACS). Cells were maintained at 37°C in a humidified atmosphere containing 5% CO2 in the corresponding medium supplemented with 10% fetal bovine serum (FBS; ExCell Bio, Shanghai, Cat# FSP500) and 100 units/mL of both penicillin and streptomycin (Sangon, Shanghai, Cat# E607011).
Endocytosis of Cell-Surface Bound T-DM1
When cells grew to about 80% confluence, cells were treated with 10 μg/mL trastuzumab/T-DM1 (Genentech) at 4°C for 30 min. The cells were then washed with PBS for three times to remove unbound trastuzumab/T-DM1. After supplementing the fresh medium, cells were incubated at 37°C for different time intervals.
Confocal Microscopic Imaging to Monitor Endocytosis
Cells seeded on 15 mm poly-lysine-coated glass coverslips (NEST, Wuxi, China, Cat# 801007) were processed for confocal microscopic analysis for imaging endocytosis. In brief, subsequent to drug treatment mentioned above, cells were fixed with 4% (w/v) paraformaldehyde (PFA, Sangon, Cat# E672002) for 15 min, permeabilized with 0.4% (v/v) Triton X-100 (Sangon, Cat# A600198) for 10 min and incubated with blocking buffer containing 1% (w/v) bovine serum albumin (BSA, Sangon, Cat# A600332) for 1 h at room temperature. Subsequently, cells were stained with rabbit anti-Lamp-1 (Cell Signaling, 1:200, Cat# 9091, RRID: AB_2687579), rabbit anti-caveolin-1 (Cell Signaling, 1:200, Cat# 3267, RRID: AB_2275453), rabbit anti-HER2 (ABclonal Technology, 1:200, Cat# A2071, RRID: AB_2832988) and rabbit anti-clathrin (Proteintech, 1:300, Cat#10852-1-1AP, RRID: AB_2083025) antibodies at 4°C overnight. After washing with Tris-buffered saline buffer-Tween (TBST, supplemented with 1% Tween-20), cells were stained with anti-human FITC conjugate IgG (Beyotime, Shanghai, 1:500, Cat# A0556) or anti-rabbit Alexa Fluor 546 conjugate IgG (Invitrogen, 1:500, Cat# A-11010, RRID: AB_2534077) for 1 h at RT. Cell nucleus were stained with DAPI (Solarbio, Beijing, 1:50, Cat# C0065) for 10 min. The coverslips were mounted using the anti-fade mounting medium (Beyotime, Shanghai, Cat# P0126) and sealed with nail polish. Images were captured using a 60X oil immersion objective on a Nikon A1R confocal microscope (Nikon Instruments Inc., USA).
Visualization of Lipid Rafts by CTxB Staining
The lipid rafts were stained with CTxB conjugated to Alexa Fluor 594 (Invitrogen, Cat# C34777). Cells were seeded on coverglass slide chambers. Cells were incubated with 10 μg/mL CTxB for 30 min on ice and then washed with PBS and followed by a 30 min incubation at 37°C. Images were captured using a 60X oil immersion objective on a Nikon A1R confocal microscope, and representative cells from different views were photographed.
Flow Cytometry Analysis to Monitoring Endocytosis
Endocytosis of trastuzumab/T-DM1 was determined utilizing a quantitative flow cytometric assay as described in a previous article.21 In brief, cells were incubated at 37°C for various time points to internalized surface-bound trastuzumab/T-DM1, while the control group was incubated at 4°C as a negative control without internalization. Cells were collected in FACS staining buffer (PBS containing 2% FBS) and then stained with anti-human FITC conjugate IgG (Beyotime, Shanghai, 1:500) for 30 min on ice away from light. Mean fluorescence intensity (MFI) was collected from 10,000 cells on ACEA NovoCyteTM flow cytometer (ACEA Biosciences, USA) by exciting FITC at 488 nm and collecting emission using a 530/30 nm bandpass filter. Data analysis was performed on Flow Jo software (Becton, Dickinson and Company). Endocytosis rates were calculated using the following formula: endocytosis rates (%) = (MFI at 4°C – MFI at 37°C)/MFI at 4°C×100.
Western Blot Analysis
Whole-protein extracts from cells were obtained using RIPA lysis buffer (pH 7.4, 50 mM Tris, 150 mM NaCl, 1% Triton X-100, 1% sodium deoxycholate, 0.1% SDS, Beyotime, Cat# P0013B) supplemented with 1 mM phenylmethanesulfonyl fluoride (PMSF, Sangon, Cat# A610425) and 1 × Protease Inhibitor Cocktail (Bimake, USA, Cat# B14001). Soluble protein fractions were collected by centrifugation at 13,000 xg for 10 min at 4°C. Protein concentration was determined using BCA protein assay kit (Beyotime, Shanghai, Cat# P0010S). After the SDS-PAGE electrophoresis, proteins were transferred onto PVDF membranes (Millipore, Cat# IPVH00010). The blots were incubated with blocking buffer containing 5% (w/v) non-fat milk for 1 h at room temperature, probed with indicated primary antibodies and shaked at 4°C overnight. Unbound antibodies were washed away with TBST. The blots were incubated with HRP-conjugated secondary antibodies, goat anti-human IgG (Sangon, Shanghai, 1:2000, Cat# D110150, RRID: AB_2876788), goat anti-mouse IgG (Cell Signaling, 1:3000, Cat# 7076S, RRID: AB_330924) or goat anti-rabbit IgG (Cell Signaling, 1:3000, Cat# 7074S, RRID: AB_2099233). After washing with TBST, the blots were incubated with ECL chemiluminescent substrate reagent (Aoqianbio, Hangzhou, China, Cat#P10100) and imaged on ChemiScope imaging system (CLiNX, Shanghai). Further densitometric analysis was implemented with Image J software. The following primary antibodies are: rabbit anti-Caveolin 1 (1:1000), mouse anti-GAPDH (TransGen Biotech, Beijing, 1:4000, Cat# HC301-02, RRID: AB_2629434) and rabbit anti-HER2 (1:2000).
Cytotoxicity Assays
Cell viability was examined using MTT assay according to the manufacturer’s instruction. In brief, cells were seeded in 96-well plates at a density of 5000 cells per well overnight. Cells were pretreated with or without inhibitors for 1 h and incubated with different concentrations of T-DM1 for 96 h at 37°C. Cells were processed using standard procedures. The light absorbance of the solution was measured by a microplate reader (Thermo). Cell viability rates were calculated using the following formula: viability rate (%) = (Ad−Ab)/(Ac−Ab)×100, where Ad stands for absorbance value of the drug treated well, Ab refers to absorbance value of the blank well, and Ac refers to absorbance value of the negative control well.22
Cell Cycle Analysis
About 5 × 10⁵ cells were seeded in each well of 6-well plates overnight. Inhibition group was pretreated with 10 μM CQ for 4 h, then incubated with 10 μg/mL T-DM1 for another 48 h. Following 48 h treatment, cell cycle analysis was performed by washing cells with PBS, trypsinization and centrifugation at 1000 xg for 5 min. About 1 mL of 70% ethanol was slowly loaded to the cell suspension drop by drop, and cells were fixed at 4°C overnight. After removing the ethanol, cells were resuspended with 500 μL of propidium iodide (PI) staining buffer containing RNase A and incubated at 37°C for 30 min. Cells were then analyzed on ACEA NovoCyteTM flow cytometer.
Overexpression and Knockdown of CAV-1 Gene
CAV-1 overexpression plasmid was generated from an expression vector, pcDNA5/FRT with BamH I and Not I restriction sites. The primer sequences of the CAV-1 (GenBank accession number: NM_001172895.1) amplification were as follows: 5ʹ-GGATCCATGTCTGGGGGCAAATACG-3ʹ (forward) and 5ʹ-TTGCGGCCGCTCATTATATTTCTTTCTGCAAGTTG-3ʹ (reverse). Cells were transfected at 60–80% confluence containing 0.5 μL/cm2 Hieff TransTM Liposomal Transfection Reagent (Yeasen, Shanghai, Cat# 40802ES03). CAV-1 overexpression was evaluated 24 h after transfection by Western blot. Further experiments were performed 24 h post-transfection. Knockdown of CAV-1 was achieved by inducible expression of shRNA. The shRNA expressing vector pLKO.1-puro was used, and two putative candidate sequences (shCAV-1.1 and shCAV-1.2) and one scramble sequence were designed as follows: shCAV-1.1, 5ʹ-CCGGGACGTGGTCAAGAT
TGACTTTCTCGAGAAAGTCAATCTTGACCACGT CTTTTTP-3ʹ (forward), shCAV-1.2, 5ʹ-CCGGCC
ACCTTCACTGTGACGAAATCTCGAGATTTCGTCACAGTGAAGGTGGTTTTT-3ʹ (forward) and control shRNA, 5ʹ-CCGGCAACAAGATGAAGAGCACCAACTCGAGTTGGTGCTCTTCATCTTGTTG
TTTTTG-3ʹ (forward). Cells were transfected with shRNA vectors and selected with puromycin (1 μg/mL).
Treatments with Inhibitors
3 mM NH4Cl (Sangon, Shanghai, Cat# A501569) and 5 μM chloroquine (CQ; Sigma-Aldrich, Cat# C6628) were used to inhibit lysosome function. 10 μM Lovastatin (Meilunbio, Dalian, China, Cat# 75330–75-5) and 10 μM Nystatin (Sangon, Shanghai, Cat# A600390) were employed to inhibit caveolae/lipid-raft mediated endocytosis. 20 μM chlorpromazine (CPZ, Aladdin, Shanghai, Cat# C129569) and 20 μM pitstop 2 (Sigma-Aldrich, Cat# SML1169) were employed to inhibit clathrin-mediated endocytosis. Cells were pretreated with inhibitors at 37°C for 1 h, except for the pretreatment of Lovastatin for 24 h. Cells were then incubated in the presence of trastuzumab/T-DM1 and inhibitors for indicated time intervals. After the incubation, cells were further analyzed by different methods such as Western blot, Confocal microscopy, flow cytometry and MTT.
Statistics
For the data represented graphically, the GraphPad Prism software (GraphPad Software, USA) was applied and error bars represent ± standard error of the mean of the indicated number of independent experiments performed. Statistical significance was determined using Student’s t-test or two-way ANOVA, as appropriate. Note: * = p ≤ 0.05, ** = p ≤ 0.01, ***= p ≤ 0.001, **** = p ≤ 0.0001.
Results
Trastuzumab or T-DM1 Accumulates Intracellularly and Increases Degradation with the Time
We first investigated the dynamic process of trastuzumab or T-DM1 internalization and degradation in breast cancer cells. Briefly, 10 μg/mL of trastuzumab or T-DM1 interacted with cell-surface HER2 receptor on ice and internalization was initiated by incubating cells at 37°C for different time intervals before further analysis. Endocytosis rate was quantified by flow cytometry by calculating MFI of cell-surface bound trastuzumab or T-DM1 at different time intervals. The results shown in the histogram indicated that the intracellular trastuzumab or T-DM1 in MDA-MB 453 as well as BT474 cells were accumulated. Endocytosis rates of both trastuzumab and T-DM1 reached a relatively steady state of 40–50% between 8 and 12 h (Figure 1A and B). To further explore the degradation rates of the internalized trastuzumab or T-DM1, whole-proteins were extracted and analyzed with the Western blot assay. The results showed that in MDA-MB 453 cells, both trastuzumab and T-DM1 protein levels were decreased by almost 50% at 8 h (Figure 1C and D). We also obtained the similar results in BT474 cells (Figure 1E). The blots of trastuzumab and T-DM1 were quantitatively analyzed and indicated in bar graphs (Figure 1F and G). However, we compared the endocytosis rates of trastuzumab to that of T-DM1 and no significant difference was found.
 |
Figure 1 Internalization and degradation dynamics of trastuzumab or T-DM1 in vitro. Flow cytometry assay of the internalization rates of trastuzumab and T-DM1 in MDA-MB 453 cells (A) and in BT474 cells (B), showing accumulated trastuzumab or T-DM1 intracellularly. The mean fluorescence intensity of each group was analyzed by GraphPad Prism and showed in bar graphs, means ± SD were presented. *p < 0.05, **p < 0.01, *** p < 0.001, **** p < 0.0001 based on two-way ANOVA. Western blot assay showing the degradation of trastuzumab (C) and T-DM1 (D) in MDA-MB 453 respectively. GAPDH was used as loading control. (E) Western blot assay showing the degradation of trastuzumab and T-DM1 in BT474 cells. β-Actin was used as loading control. (F and G) Densitometric values of anti-human IgG from (C–E) were analyzed by Image J and normalized to control (time point at 0 h). The values of control were set to 100%. Means ± SD were presented. **** p < 0.0001 based on Student’s t-test. Data shown above were representative of at least two independent experiments. |
Taken together, these results suggest that trastuzumab and T-DM1 can be internalized and degraded in breast cancer cells.
Internalized T-DM1 is Degraded in Lysosome
We next observed the uptake of trastuzumab and T-DM1 by immunofluorescence confocal microscopy. The images revealed an increase in the uptake of trastuzumab and T-DM1 with treatment time of 8–12 h, showing increasing colocalization signals with LAMP-1 stained lysosome (Figure 2A and B). It was in accordance with the data analyzed by flow cytometry (Figure 1A and B) and suggested that trastuzumab or T-DM1 could be internalized and then transported to lysosome.
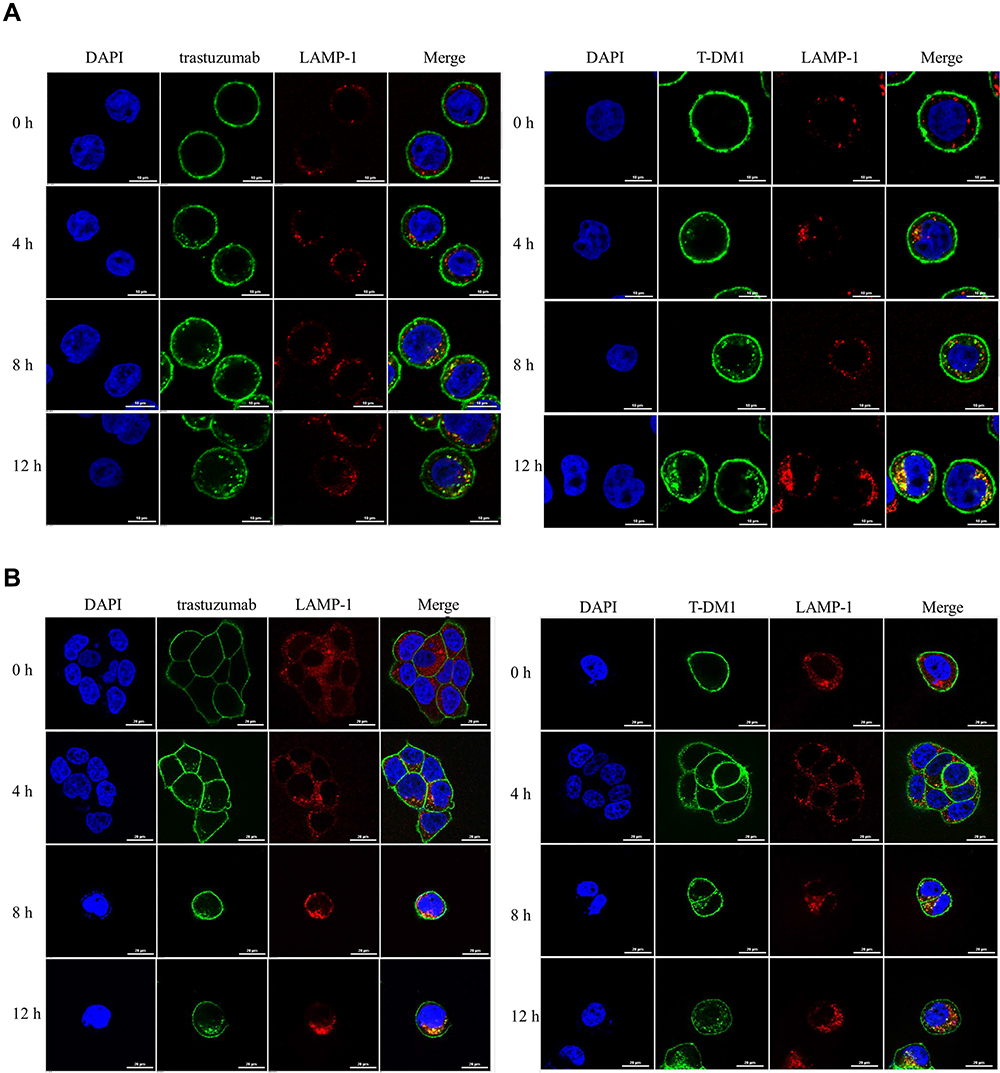 |
Figure 2 Colocalization of trastuzumab or T-DM1 with LAMP 1-stained lysosome in the different time. Confocal microscopic images of immunofluorescence staining of trastuzumab (left) or T-DM1 (right) with LAMP-1 in MAD-MB 453 cells (A) and in BT474 cells (B). Scale bars = 10 μm (A) or 20 μm (B). Green, trastuzumab or T-DM1, red, LAMP-1, blue, DAPI. n =2, two experiments were repeated. |
Base on the observation, we next hypothesized that internalized T-DM1 could eventually be degraded in the lysosome. Therefore, NH4Cl and CQ were used as lysosome inhibitors to explore whether lysosomal dysfunction could reduce T-DM1 toxicity. The MTT results revealed that MDA-MB 453 cells were highly sensitive to T-DM1, whereas pretreatment of NH4Cl or CQ decreased T-DM1 toxicity towards cells (Figure 3A left). The IC50 of the cells treated with NH4Cl+T-DM1 and CQ+T-DM1 was 459.4 ng/mL and 1830 ng/mL, respectively, both of which were much higher than the IC50 of the cells treated only with T-DM1. Compared to MDA-MB 453, BT474 cells were less sensitive to T-DM1 (Figure 3A right), which suggested that the response to T-DM1 was distinct among different HER2 positive cancer cells. The reasons may attribute to the different HER2 density or morphological factors between MDA-MB 453 and BT474 cells. MDA-MB 453 cells were grown with single round shape, while BT474 cells aggregated and made it difficult for effective drug transportation. In addition, T-DM1 is ineffective for HER2 negative MDA-MB 231 cells. Although MDA-MB 231 cells were exposed to high concentrations of T-DM1, no fatal effect was found on the cell viability (data not shown). We also determined the degradation level of T-DM1 in the presence or absence of CQ or NH4Cl. The results indicated that over the same time-course, T-DM1 degradation was inhibited with the pretreatment of CQ, while T-DM1 was significantly degraded in the absence of CQ pretreatment (Figure 3C). Nevertheless, NH4Cl pretreatment was not totally inhibit the T-DM1 degradation compared with the control group (Figure 3B). For the reason why NH4Cl and CQ showed different effects on inhibiting T-DM1 degradation, the possible explanations may be their distinct mechanisms of lysosomal alkalinization.23 Although both of them can prevent the acidification of lysosomes and therefore inhibit the activity of intraluminal degradative enzymes, NH4Cl nonspecifically increases the pH not only in lysosome lumen, but also in cytoplasm, while CQ diffuses into lysosome and undergoes protonation. Browning DJ explained that CQ entered the lysosome by diffusion, but it cannot diffuse out of the intra-lysosomal environment upon protonation to CQ2+.24 Meanwhile, we determined the cell cycle of MDA-MB 453 cells treated with different drugs (Figure 3D). Our data showed that cells treated with T-DM1 were significantly arrested in G2-M phase. Cells treated with CQ alone showed similar cell cycle percentage as control, which meant that low concentration of CQ did not affect the cell cycle. In contrast, combinational treatment of T-DM1 and CQ did not induce the same G2-M cell cycle arrest as T-DM1 did, as CQ blocked T-DM1 degradation.
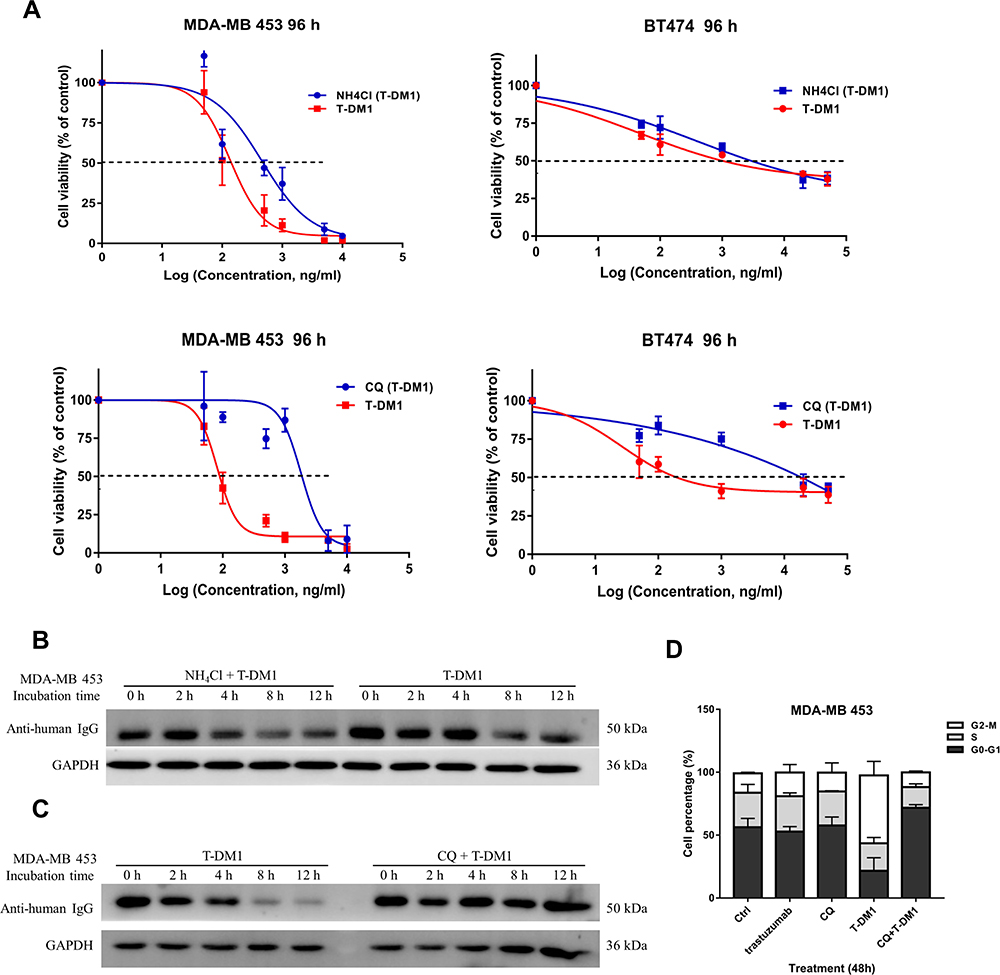 |
Figure 3 T-DM1 is degraded in lysosome. (A) Cytotoxicity assay: cell viability of HER2-positive cancer cells (MDA-MB 453, BT474) or HER2-negative cells (MDA-MB 231) with the pretreatment of NH4Cl (upper) and CQ (lower) followed with T-DM1 treatment for 96 h showing decreased drug toxicity to cancer cells than control group (only T-DM1 treatment). Mean values of independent 5 repeats of cell samples were shown and error bar indicate SD. (B) Western blot analysis of T-DM1 degradation in MDA-MB 453 demonstrating pretreatment of NH4Cl inefficiently prevented the T-DM1 degradation. (C) Western blot analysis of T-DM1 degradation in MDA-MB 453 demonstrating efficient prevention of T-DM1 degradation after the pretreatment of CQ. (D) Bar graph of cell cycle in MDA-MB 453 showing CQ pretreatment prevented the DM1 from release and caused cell cycle arrest in G2-M phase. The percentage of cell cycle phases were determined by flow cytometry. Data shown in (B), (C) and (D) were representative of two independent experiments. |
The results demonstrate that T-DM1 transports to lysosome and undergoes degradation. CQ and NH4Cl can prevent T-DM1 from degradation through inhibition of lysosomal function, and therefore block the release of free DM1 and lift the mitotic arrest.
Caveolin-1 (CAV-1) Dependent Lipid Raft is Associated with T-DM1 Endocytosis
We proved that T-DM1 could be internalized and transported to the lysosome for degradation. Then, we wanted to know whether caveolae/lipid-raft mediated endocytosis was involved in the T-DM1 and HER2 internalization. First, we discovered the relationship between lipid rafts and CAV-1, the major component of caveolae. We assessed the lipid raft level using Alexa Fluor 594-conjugated CTxB staining. Confocal microscopic images showed that CTxB signals were increased in two CAV-1 overexpressing cells compared to the corresponding control cells, indicating higher level of lipid rafts in CAV-1 overexpressing cells (Figure 4A). The overexpression of CAV-1 was confirmed by Western blot (Figure 4B). At the beginning (0 h), T-DM1 and CTxB were colocalized at the cell membrane. After 2 h of incubation, intracellular T-DM1 was colocalized with CTxB in the cytosol (Figure 4C left). The colocalization of HER2 and CTxB was also observed in both MDA-MB 453 and NCI-N87 cells (Figure 4C right). The results implied that HER2 and T-DM1 complexes could be internalized through lipid rafts.
 |
Figure 4 CAV-1 dependent lipid rafts are associated with T-DM1 endocytosis. (A) Confocal microscopic images: Lipid-raft levels (CTxB staining) were increased in CAV-1 overexpressing MDA-MB 453 cells (left) and NCI-N87 cells (right) compared to normal MB 453 cells and NCI-N87 cells. 36 h post-transfection was performed before CTxB staining for 30 min. Photography parameters were set to be the same and three different views of representative cells were showed. (B) CAV-1 overexpression was confirmed by Western blot. Ctrl group was transfected with the control plasmid. (C) Confocal images of immunofluorescence staining of T-DM1 or HER2 with CTxB respectively in MAD-MB 453 cells (upper) or NCI-N87 cells (lower). Cells were treated with T-DM1 and CTxB for 2 h. Scale bars = 10 μm. Green, T-DM1 or HER2, red, CTxB, a marker of lipid raft. n =2, experiments were repeated twice. |
T-DM1 Internalization is Through the Caveolae/Lipid-Raft Mediated Endocytosis
Considering that lipid raft level was related to CAV-1 expression, we explored the roles of CAV-1 in T-DM1 endocytosis. We found that HER2 protein levels were unchanged by the incubation of T-DM1 in MDA-MB453 cells, though intracellular T-DM1 was degraded (Figure 5A). This meant that T-DM1 internalization did not accelerate the HER2 degradation. We next performed the overexpression of CAV-1, a key mediator of caveolae/lipid-raft mediated endocytosis to further prove our speculation. The CAV-1 overexpression system was established by transfecting the pcDNA5/FRT-CAV-1 plasmids to MDA-MB 453 cells. Expression of exogenous CAV-1 could be detected 24 h after transfection (Figure 5B). In order to find the association between CAV-1 and HER2, we detected the HER2 level following the CAV-1 overexpression in MDA-MB 453 cells. HER2 was degraded as CAV-1 was up-regulated at the same time without T-DM1 treatment (Figure 5C). After treatment with T-DM1, increased degradation of HER2 was found when cells were overexpressed with CAV-1. It was observed that both HER2 and T-DM1 protein levels were remarkably decreased from 4 h to 8 h, while simultaneously CAV-1 protein level was increasing compared to the control group (Figure 5E). The relative T-DM1 was quantitatively analyzed and indicated in the bar graph (Figure 5F). T-DM1 internalization was also quantified by flow cytometry, indicating that the internalization rate of T-DM1 in CAV-1 overexpression group at 12 h reached 60%, which was over 10% higher than the control one (Figure 5D).
 |
Figure 5 Overexpression of CAV-1 induces the T-DM1 internalization in MDA-MB 453 cells. (A) T-DM1 was degraded and HER2 level kept constant in normal MDA-MB 453 cells. (B) Evaluation of CAV-1 overexpression in MDA-MB 453 cells from 24 h to 72 h after transient transfection. (C) Downregulation of HER2 was induced by CAV-1 overexpression 24 h post-transfection without T-DM1 incubation. (D) Flow cytometry assay of the internalization rates of T-DM1 showing the accumulation of intracellular T-DM1 in CAV-1 overexpression group was higher compared to the control group. The mean fluorescence intensity of each group was analyzed by GraphPad Prism and showed in bar graphs, means ± SD were presented. * p < 0.05, *** p < 0.001 based on two-way ANOVA. (E) Transient overexpression of CAV-1 accelerated HER2 and T-DM1 degradation. Treatment of T-DM1 was performed 24 h post transfection of CAV-1 overexpression plasmid. (F) Densitometric values of T-DM1 in panel E were analyzed by Image J and normalized to control (time point at 0 h). The values of control were set to 100%. Means ± SD were presented. **** p < 0.0001 based on two-way ANOVA. Data shown above were representative of at least two independent experiments. |
CAV-1 shRNA expressing vectors or inhibitors of caveolae/lipid raft-mediated endocytosis pathway were used for the following experiments. Considering the low basal level of CAV-1 in MDA-MB 453 cells, we chose NCI-N87 (gastric carcinoma), which was HER2 positive with intermediate CAV-1 level. HER2 protein level remained unchanged with the treatment of T-DM1 in NCI-N87 cells (Figure 6A). Next, we found that the degradation of HER2 and T-DM1 were inhibited in CAV-1 shRNA knockdown cells compared to the control group of scramble shRNA (Figure 6B). Moreover, nystatin and lovastatin were used to block the caveolae/lipid-raft mediated endocytosis pathway. Nystatin is a specific lipid raft-inhibiting reagent,25 and lovastatin is clinically available for normalizing blood cholesterol level. As we expected, both nystatin and lovastatin significantly inhibited T-DM1 degradation, while HER2 protein level remained steady with or without nystatin or lovastatin pretreatment (Figure 6C and D). The relative T-DM1 was shown in bar graphs on the right.
 |
Figure 6 CAV-1 knockdown via RNA interference or inhibitors targeting cholesterol inhibits T-DM1 degradation in NCl-N87 cells. (A) Treatment of T-DM1 did not induce the HER2 degradation in normal NCl-N87 cells. (B) Knockdown of CAV-1 in NCl-N87 cells using shRNA inhibited T-DM1 degradation while HER2 protein level remained stable. (C) Inhibition of T-DM1 degradation by lipid-raft disruptor Nystatin. Cells were pretreated with 10 μM Nystatin for 1h. (D) Lipid-raft disruptor lovastatin inhibited the degradation of T-DM1. Cells were pretreated with 10 μM lovastatin for 24 h. Data shown in (A–D) were representative of two independent experiments. GAPDH was used as loading control. Densitometric values of T-DM1 in (C) and (D) were analyzed by Image J and normalized to control (time point at 0 h). The values of control were set to 100%. Means ± SD were presented. ** p < 0.01, *** p < 0.001, **** p < 0.0001 based on two-way ANOVA. |
T-DM1 Internalization is Clathrin-Independent
Clathrin-mediated endocytosis (CME) is the classic receptor-mediated endocytosis, so we wonder if T-DM1 could alternatively internalize through the CME. We observed that there was no colocalization of intracellular T-DM1 with clathrin-coated pits in MDA-MB 453 and NCI-N87 cells (Figure 7A). Next, two specific inhibitors were used to block the CME. Chlorpromazine (CPZ) prevents the assembly of clathrin-coated pits in the plasma membrane and pitstop 2 inhibits CME by associating it with the terminal domain of clathrin. Endocytosis rate of T-DM1 was quantified by flow cytometry. No significant differences in T-DM1 endocytosis were found in cells with or without pretreatment of CPZ or pitstop 2 (Figure 7B and C). It proved that T-DM1 endocytosis was independent of CME.
 |
Figure 7 Internalization of T-DM1 is independent on clathrin-mediated endocytosis pathway. (A) Confocal images of immunofluorescence staining of T-DM1 with clathrin in MAD-MB 453 cells (upper) or NCI-N87 cells (lower). Cells were treated with 10 μg/m T-DM1 for 0.5 h. Scale bars = 10 μm. Green, T-DM1; red, clathrin. The plot profiles on the right were correlated to the white lines in the merged images, showing the lack of colocalization of T-DM1 and clathrin. (B and C) Quantitative flow cytometry assay of the T-DM1 internalization rates in MDA-MB453 (left) and NCI-N87 (right) cells with the pretreatment of 20 μM CPZ or 20 μM pitstop 2 respectively. No inhibitory effect on T-DM1 endocytosis was shown with the use of CPZ and pitstop 2. Data were analyzed by GraphPad Prism and showed in bar graphs. Means ± SD were presented. No significant difference was found. Data shown above were representative of two independent experiments. |
Based on the above results, we confirm that T-DM1 endocytosis is through the caveolae/lipid raft-mediated endocytosis, which is regulated by CAV-1, and T-DM1 endocytosis is not dependent on clathrin-mediated endocytosis.
Discussion
As one of the antibody-based therapeutics, ADC is more effective and precise for tumors than conventional chemotherapeutic agents. So far, 14 ADCs have been approved and more than 277 are currently in different stages of development. Although there are non-internalizing ADCs have been developed to liberate their payload in the tumor extracellular space, the majority of the ADCs need to be internalized to take effect.26,27 Therefore, internalization is of crucial importance to the anti-cancer efficacy of ADC and it is necessary to decipher the mechanism of ADCs internalization.
In general, endocytosis of large molecules, such as monoclonal antibodies (mAbs) or ADCs, is categorized into three major pathways, clathrin-mediated, caveolae-mediated endocytosis, and micropinocytosis.28,29 To efficiently kill tumor cells, T-DM1 must be internalized via HER2 receptor-mediated endocytosis and be degraded efficiently. In this work, we studied the dynamic process of T-DM1 internalization and explored the role of CAV-1 via caveolae/lipid raft-mediated endocytosis pathway in T-DM1 uptake.
Although T-DM1 endocytosis is HER2-mediated, HER2 is restricted to the cell surface. There is controversial evidence for the internalization of HER2 with antibodies or ADCs. Some articles suggested that mAbs (trastuzumab, pertuzumab) or T-DM1 promoted intracellular HER2 level because of an antibody-mediated internalization process,5,30 while others indicated that mAbs rarely down-regulated the amount of HER2 in the plasma membrane.8,9,31,32 In this study, we found that HER2 level maintained a steady state when cells were incubated with T-DM1, including BT474 (data not shown), MDA-MB453 and NCI-N87. It was indicated that T-DM1 had a limited effect on inducing HER2 internalization, but T-DM1 was dramatically internalized and degraded in lysosome. Meanwhile, the internalization of trastuzumab and T-DM1 was at the same rate. This meant that DM1, the payload conjugation did not affect the internalization rate.
It has been reported that CAV-1 was negatively correlated with HER215 and CAV-1 expression could mediate the HER2 trafficking.16,17 Upregulation of CAV-1 may enhance sensitivity of HER2 positive breast cancer cells to T-DM120 or attenuate the antibody-dependent cell mediated cytotoxicity (ADCC) effect of trastuzumab17 by promoting the endocytosis of trastuzumab. However, opposite evidence showed that caveolae-mediated endocytosis may be a possible mechanism of T-DM1 resistance.33 Our findings demonstrated that intracellular T-DM1 and HER2 could be colocalized with lipid rafts. However, HER2 receptors may rapidly recycle into the plasma membrane after they unload T-DM1 in lipid rafts before reaching lysosome as T-DM1 internalized without downregulating HER2. CAV-1 overexpression induced the formation of lipid rafts and promoted T-DM1 internalization. Degradations of T-DM1 and HER2 were also accelerated by CAV-1 overexpression and were inhibited by CAV-1 downregulation.
In order to confirm the involvement of caveolae/lipid rafts in T-DM1 internalization, two cholesterol inhibitors were used to disrupt the caveolae/lipid-rafts. Cholesterol is one of the major components of the lipid bilayer of the cell membranes. It is enriched in the caveolae/lipid rafts. The variety of cholesterol abundance affected the cell shape and fluidity, and modulated the downstream signal transduction and the distribution of cell membrane proteins.34 Cholesterol regulates the transcriptional level of CAV1 through two steroid regulatory elements in the CAV1 promoter.35 Nystatin binds and sequesters the membrane cholesterol without altering the amount of cellular cholesterol.25,36 Lovastatin inhibits the enzyme 3-hydroxy-3-methylglutaryl coenzyme A (HMG-CoA) reductase. Pretreatment of nystatin or lovastatin could inhibit caveolae/lipid raft-mediated endocytosis pathway, and eventually block the T-DM1 degradation.
Several studies have mentioned about the additive effect of lovastatin in regulating the HER2 distribution. Lovastatin was found to downregulate CAV-1 expression in vivo and increase HER2 availability at the cell membrane, which resulted in the improvement of trastuzumab or pertuzumab binding and therapy.16,37 However, lovastatin had been reported to facilitate the internalization and intracellular degradation of HER2.34 In our work, we found that the combinational treatment of lovastatin and T-DM1 did not decrease HER2 level. Although different statins approved by the FDA, such as pitavastatin, lovastatin and simvastatin,38 have been proved to suppress the growth of breast cancer and have been proceeding in different stages of clinical trials as adjuvant therapy, the inhibitory effect of lovastatin on T-DM1 degradation implied that lovastatin or any other cholesterol-lowering drugs may reduce the therapeutic benefit of HER2-directed ADCs.
Actually, CAV-1 not only facilitates the ADC internalization via the caveolae-mediated endocytosis but also plays different roles in caveolae-independent biological activities. CAV-1 deficiency and lipid raft disruption promoted autophagy via enhancing the lysosomal function in human breast cancer cells.39 CAV-1 influenced the insulin receptor-mediated signaling, insulin secretion and possibly in diabetes.40 Metformin, the diabetes drug increased the expression of CAV-141 and enhanced the T-DM1 toxicity in breast cancer cell lines and animal models.18,42 The functions of CAV-1 are complex, and CAV-1 is closely associated with breast cancer development. Therefore, we may consider that CAV-1 may be a novel biomarker for targeting HER2-positive tumors with T-DM1 or mAbs.
Besides, our data showed that T-DM1 might not be regulated by CME. Inhibitors specific to the CME did not significantly inhibit T-DM1 internalization. Therefore, considering that T-DM1 endocytosis is HER2 receptor-mediated, caveolae/lipid raft-mediated endocytosis may be the major clathrin-independent endocytosis pathway of T-DM1.
Conclusion
In summary, our results indicate that CAV-1 may act as a key modulator for regulating T-DM1 internalization via caveolae/lipid raft-mediated endocytosis. Upregulating CAV-1 using pharmacological modulators could enhance T-DM1 internalization and may benefit from therapeutic efficacy. Last but not least, the CAV-1 expression level in breast cancer tissues may be useful to predict drug response and resistance.
Abbreviations
ADC, antibody–drug conjugate; CAV-1, caveolin-1; CME, clathrin-mediated endocytosis; CPZ, chlorpromazine; CQ, chloroquine; CTxB, cholera toxin B; HER2, human epidermal growth factor receptor-2; T-DM1, Trastuzumab emtansine.
Acknowledgments
This work was supported by the National Natural Science Foundation of China [grant no. 81872784]. We wish to thank for technique supports in Confocal Microscopy and Flow Cytometry from Core Facilities of Zhejiang University School of Medicine.
Disclosure
The authors report no conflicts of interest in this work.
References
1. Verma S, Miles D, Gianni L, et al. Trastuzumab emtansine for HER2-positive advanced breast cancer. N Engl J Med. 2012;367(19):1783–1791. doi:10.1056/NEJMoa1209124
2. Hurvitz SA, Dirix L, Kocsis J, et al. Phase II randomized study of trastuzumab emtansine versus trastuzumab plus docetaxel in patients with human epidermal growth factor receptor 2-positive metastatic breast cancer. J Clin Oncol. 2013;31(9):1157–1163. doi:10.1200/JCO.2012.44.9694
3. Ceresa BP. Spatial regulation of epidermal growth factor receptor signaling by endocytosis. Int J Mol Sci. 2012;1:72–87.
4. Citri A, Alroy I, Lavi S, et al. Drug-induced ubiquitylation and degradation of ErbB receptor tyrosine kinases: implications for cancer therapy. EMBO J. 2002;21(10):2407–2417. doi:10.1093/emboj/21.10.2407
5. Bertelsen V, Stang E. The mysterious ways of ErbB2/HER2 trafficking. Membranes. 2014;4(3):424–446. doi:10.3390/membranes4030424
6. Harari D, Yarden Y. Molecular mechanisms underlying ErbB2/HER2 action in breast cancer. Oncogene. 2000;19(53):6102–6114. doi:10.1038/sj.onc.1203973
7. Hendriks BS, Opresko LK, Wiley HS, Lauffenburger D. Coregulation of epidermal growth factor receptor/human epidermal growth factor receptor 2 (HER2) levels and locations: quantitative analysis of HER2 overexpression effects. Cancer Res. 2003;5:1130–1137.
8. Austin CD, De Maziere AM, Pisacane PI, et al. Endocytosis and sorting of ErbB2 and the site of action of cancer therapeutics trastuzumab and geldanamycin. Mol Biol Cell. 2004;15(12):5268–5282. doi:10.1091/mbc.e04-07-0591
9. Hommelgaard AM, Lerdrup M, van Deurs B. Association with membrane protrusions makes ErbB2 an internalization-resistant receptor. Mol Biol Cell. 2004;15(4):1557–1567. doi:10.1091/mbc.e03-08-0596
10. Pust S, Klokk TI, Musa N, et al. Flotillins as regulators of ErbB2 levels in breast cancer. Oncogene. 2013;32(29):3443–3451. doi:10.1038/onc.2012.357
11. Williams TM, Lisanti MP. The caveolin proteins. Genome Biol. 2004;5(3):214. doi:10.1186/gb-2004-5-3-214
12. Gupta R, Toufaily C, Annabi B. Caveolin and cavin family members: dual roles in cancer. Biochimie. 2014;107 Pt B:188–202. doi:10.1016/j.biochi.2014.09.010
13. Lee SW, Reimer CL, Oh P, Campbell DB, Schnitzer JE. Tumor cell growth inhibition by caveolin re-expression in human breast cancer cells. Oncogene. 1998;16(11):1391–1397. doi:10.1038/sj.onc.1201661
14. Sagara Y, Mimori K, Yoshinaga K, et al. Clinical significance of Caveolin-1, Caveolin-2 and HER2/neu mRNA expression in human breast cancer. Br J Cancer. 2004;91(5):959–965. doi:10.1038/sj.bjc.6602029
15. Park SS, Kim JE, Kim YA, Kim YC, Kim SW. Caveolin-1 is down-regulated and inversely correlated with HER2 and EGFR expression status in invasive ductal carcinoma of the breast. Histopathology. 2005;47(6):625–630. doi:10.1111/j.1365-2559.2005.02303.x
16. Pereira PMR, Sharma SK, Carter LM, et al. Caveolin-1 mediates cellular distribution of HER2 and affects trastuzumab binding and therapeutic efficacy. Nat Commun. 2018;9(1):5137. doi:10.1038/s41467-018-07608-w
17. Sekhar SC, Kasai T, Satoh A, et al. Identification of caveolin-1 as a potential causative factor in the generation of trastuzumab resistance in breast cancer cells. J Cancer. 2013;4(5):391–401. doi:10.7150/jca.6470
18. Chung YC, Chang CM, Wei WC, et al. Metformin-induced caveolin-1 expression promotes T-DM1 drug efficacy in breast cancer cells. Sci Rep. 2018;8(1):3930. doi:10.1038/s41598-018-22250-8
19. Indira Chandran V, Mansson AS, Barbachowska M, et al. Hypoxia attenuates trastuzumab uptake and Trastuzumab-Emtansine (T-DM1) cytotoxicity through redistribution of phosphorylated caveolin-1. Mol Cancer Res. 2020;18(4):644–656. doi:10.1158/1541-7786.MCR-19-0856
20. Chung YC, Kuo JF, Wei WC, Chang KJ, Chao WT. Caveolin-1 dependent endocytosis enhances the chemosensitivity of HER-2 positive breast cancer cells to Trastuzumab Emtansine (T-DM1). PLoS One. 2015;10(7):e0133072. doi:10.1371/journal.pone.0133072
21. Kumar GA, Sarkar P, Jafurulla M, et al. Exploring endocytosis and intracellular trafficking of the human Serotonin(1A) receptor. Biochemistry. 2019;58(22):2628–2641. doi:10.1021/acs.biochem.9b00033
22. Abdollahpour-Alitappeh M, Lotfinia M, Bagheri N, et al. Trastuzumab-monomethyl auristatin E conjugate exhibits potent cytotoxic activity in vitro against HER2-positive human breast cancer. J Cell Physiol. 2019;234(3):2693–2704. doi:10.1002/jcp.27085
23. Fedele AO, Proud CG. Chloroquine and bafilomycin A mimic lysosomal storage disorders and impair mTORC1 signalling. Biosci Rep. 2020;4:BSR20200905.
24. Browning DJ. Pharmacology of chloroquine and hydroxychloroquine. In: Hydroxychloroquine and Chloroquine Retinopathy. 2014:35–63.
25. Wei X, She G, Wu T, Xue C, Cao Y. PEDV enters cells through clathrin-, caveolae-, and lipid raft-mediated endocytosis and traffics via the endo-/lysosome pathway. Vet Res. 2020;51(1):10. doi:10.1186/s13567-020-0739-7
26. Rossin R, Versteegen RM, Wu J, et al. Chemically triggered drug release from an antibody-drug conjugate leads to potent antitumour activity in mice. Nat Commun. 2018;10(1):1484. doi:10.1038/s41467-018-03880-y
27. Kobayashi H, Choyke PL. Near-infrared photoimmunotherapy of cancer. Acc Chem Res. 2019;52(8):2332–2339. doi:10.1021/acs.accounts.9b00273
28. Mosesson Y, Mills GB, Yarden Y. Derailed endocytosis: an emerging feature of cancer. Nat Rev Cancer. 2008;8(11):835–850. doi:10.1038/nrc2521
29. Gerber HP, Koehn FE, Abraham RT. The antibody-drug conjugate: an enabling modality for natural product-based cancer therapeutics. Nat Prod Rep. 2013;30(5):625–639. doi:10.1039/c3np20113a
30. Yarden Y, Sliwkowski MX. Untangling the ErbB signalling network. Nat Rev Mol Cell Biol. 2001;2(2):127–137. doi:10.1038/35052073
31. Hughes JB, Rodland MS, Hasmann M, Madshus IH, Stang E. Pertuzumab increases 17-AAG-induced degradation of ErbB2, and this effect is further increased by combining pertuzumab with trastuzumab. Pharmaceuticals. 2012;5(7):674–689. doi:10.3390/ph5070674
32. Szymanska M, Fosdahl AM, Nikolaysen F, et al. A combination of two antibodies recognizing non-overlapping epitopes of HER2 induces kinase activity-dependent internalization of HER2. J Cell Mol Med. 2016;20(10):1999–2011. doi:10.1111/jcmm.12899
33. Sung M, Tan X, Lu B, et al. Caveolae-mediated endocytosis as a novel mechanism of resistance to Trastuzumab Emtansine (T-DM1). Mol Cancer Ther. 2018;17(1):243–253. doi:10.1158/1535-7163.MCT-17-0403
34. Zhang J, Li Q, Wu Y, et al. Cholesterol content in cell membrane maintains surface levels of ErbB2 and confers a therapeutic vulnerability in ErbB2-positive breast cancer. Cell Commun Signal. 2019;20(1):15. doi:10.1186/s12964-019-0328-4
35. Bist A, Fielding PE, Fielding CJ. Two sterol regulatory element-like sequences mediate up-regulation of caveolin gene transcription in response to low density lipoprotein free cholesterol. Proc Natl Acad Sci USA. 1997;94(20):10693–10698. doi:10.1073/pnas.94.20.10693
36. Yamaguchi H, Takeo Y, Yoshida S, et al. Lipid rafts and caveolin-1 are required for invadopodia formation and extracellular matrix degradation by human breast cancer cells. Cancer Res. 2009;69(22):8594–8602. doi:10.1158/0008-5472.CAN-09-2305
37. Pereira PMR, Mandleywala K, Ragupathi A, et al. Temporal modulation of HER2 membrane availability increases pertuzumab uptake and pretargeted molecular imaging of gastric tumors. J Nucl Med. 2019;60(11):1569–1578. doi:10.2967/jnumed.119.225813
38. Altwairgi AK. Statins are potential anticancerous agents (review). Oncol Rep. 2015;3(3):1019–1039. doi:10.3892/or.2015.3741
39. Shi Y, Tan SH, Ng S, et al. Critical role of CAV1/caveolin-1 in cell stress responses in human breast cancer cells via modulation of lysosomal function and autophagy. Autophagy. 2015;11(5):769–784. doi:10.1080/15548627.2015.1034411
40. Haddad D, Al Madhoun A, Nizam R, Al-Mulla F. Role of Caveolin-1 in diabetes and its complications. Oxid Med Cell Longev. 2020;116(5):9761539. doi:10.1021/acs.chemrev.5b00381
41. Salis O, Bedir A, Ozdemir T, Okuyucu A, Alacam H. The relationship between anticancer effect of metformin and the transcriptional regulation of certain genes (CHOP, CAV-1, HO-1, SGK-1 and Par-4) on MCF-7 cell line. Eur Rev Med Pharmacol Sci. 2014;11:1602–1609.
42. Chung YC, Chiu HH, Wei WC, Chang KJ, Chao WT. Application of trastuzumab emtansine in HER-2-positive and KRAS/BRAF-mutated colon cancer cells. Eur J Clin Invest. 2020;e13255. doi:10.1111/eci.13255
 © 2021 The Author(s). This work is published and licensed by Dove Medical Press Limited. The
full terms of this license are available at https://www.dovepress.com/terms
and incorporate the Creative Commons Attribution
- Non Commercial (unported, 3.0) License.
By accessing the work you hereby accept the Terms. Non-commercial uses of the work are permitted
without any further permission from Dove Medical Press Limited, provided the work is properly
attributed. For permission for commercial use of this work, please see paragraphs 4.2 and 5 of our Terms.
© 2021 The Author(s). This work is published and licensed by Dove Medical Press Limited. The
full terms of this license are available at https://www.dovepress.com/terms
and incorporate the Creative Commons Attribution
- Non Commercial (unported, 3.0) License.
By accessing the work you hereby accept the Terms. Non-commercial uses of the work are permitted
without any further permission from Dove Medical Press Limited, provided the work is properly
attributed. For permission for commercial use of this work, please see paragraphs 4.2 and 5 of our Terms.