Back to Journals » Journal of Hepatocellular Carcinoma » Volume 9
Dynamic Lymphocyte Changes Following Transarterial Radioembolization: Association with Normal Liver Dose and Effect on Overall Survival
Authors Young S ![]() , Ragulojan R, Chen T
, Ragulojan R, Chen T ![]() , Owen J, D'souza D, Sanghvi T, Golzarian J, Flanagan S
, Owen J, D'souza D, Sanghvi T, Golzarian J, Flanagan S
Received 26 November 2021
Accepted for publication 20 January 2022
Published 4 February 2022 Volume 2022:9 Pages 29—39
DOI https://doi.org/10.2147/JHC.S350219
Checked for plagiarism Yes
Review by Single anonymous peer review
Peer reviewer comments 6
Editor who approved publication: Prof. Dr. Imam Waked
Shamar Young,1 Ranjan Ragulojan,1 Ting Chen,1 Joshua Owen,1 Donna D’souza,1 Tina Sanghvi,2 Jafar Golzarian,1 Siobhan Flanagan1
1University of Minnesota, Department of Radiology, Division of Interventional Radiology, Minneapolis, MN, 55455, USA; 2Minneapolis VA Medical Center, Department of Radiology, Minneapolis, MN, 55455, USA
Correspondence: Shamar Young, Tel +1 612-624-6189
, Email [email protected]
Objective: To evaluate the dynamic changes of lymphocytes following transarterial radioembolization (TARE) for hepatocellular carcinoma (HCC) and their relationship to normal liver dose (NLD).
Materials and Methods: A total of 93 patients who underwent 102 treatments were retrospectively reviewed. Absolute lymphocyte counts pretreatment and at 1, 3, 6, and 12 months were evaluated. Kaplan–Meier, Spearman correlation, receiver operating characteristic (ROC) curve, and area under the curve (AUC) analyses were performed.
Results: The mean absolute lymphocyte count at baseline was 1.25 ± 0.79 103/μL which was significantly greater than 1 (0.71 ± 0.47 103/μL, p< 0.0001), 3 (0.79 ± 0.77 103/μL, p=0.0003), and 6 (0.81 ± 0.44 103/μL, p=0.0001) months, but not significantly different than 12 (0.92 ± 0.8 103/μL, p=0.12) months post treatment. There was a modest negative correlation between NLD and lymphocyte count at 1 month (rho= − 0.216, p=0.03), which strengthened at 3 months post treatment (rho= − 0.342, p=0.008). AUC of ROC analysis between absolute lymphocyte count ≤ 1 103/μL or > 1 103/μL at 1, 3, 6, and 12 months post treatment was 0.625, 0.676, 0.560, and 0.794, respectively. Univariate analysis of overall survival when separating patients by a lymphocyte count of ≤ 1 103/μL and > 1 103/μL demonstrated a significant difference at 1 (HR: 0.56, 95% CI: 0.33– 0.95, p=0.03), 3 (HR: 0.41, 95% CI: 0.18– 0.94, p=0.035) and 6 (HR: 0.36, 95% CI: 0.17– 0.77, p=0.008) months post treatment, but not pretreatment or at 12 months.
Conclusion: NLD may correlate with lymphocyte depression at 1 and 3 months and lymphopenia may portend a worse overall survival in the post treatment setting.
Keywords: hepatocellular carcinoma, transarterial radioembolization, lymphocytes
Introduction
Transarterial radioembolization (TARE) has become an accepted treatment option for hepatocellular carcinoma (HCC) patients.1–3 However, our knowledge of dosimetry and its importance in clinical outcomes is still evolving.3–5 While several studies have focused on tumor absorbed dose and how it relates to clinical outcomes,3,6,7 relatively few studies have evaluated the relationship of normal liver dose (NLD) to toxicities.5,8
Lymphocytes are known to be radiosensitive, and the liver is known to be a hematopoietic organ.9 Given this, it is not surprising that several studies have documented lymphocyte reduction following TARE.8,10–14 However, there is still lack of detailed understanding of the dynamic changes in lymphocytes, how the changes relate to dose distribution, and if they impact survival. These questions are of particular importance for several reasons. First, immunotherapy is a developing HCC treatment15 and the ability to combine locoregional therapies and immunotherapy is of great interest with early studies demonstrating reason to be hopeful.16,17 TARE is of particular interest as preclinical studies of external beam radiation have suggested that higher doses of radiation to the tumor increase the likelihood of inducing a positive immune response.18,19 Given the ability to achieve very high tumoral doses when treating with TARE, it would seem like an ideal candidate for synergistic treatment algorithms. However, if TARE depresses lymphocytes by too much this potential may never be realized. Second, lymphopenia has been shown to correlate with poorer overall survival (OS) in some studies of HCC patients.20 This raises the question as to whether inducing lymphopenia following TARE would portend worse outcomes as well. Therefore, more data are needed on the dynamic changes of lymphocytes, as well as factors that may predict these changes. For instance, the correlation between lymphocyte reduction and normal liver dose (NLD), tumoral dose, perfused volume, and particle load is to this point unknown.
The purpose of this study is to evaluate the dynamic changes in lymphocytes following TARE, as well as determine factors that may correlate with these changes, particularly how NLD affects these changes.
Materials and Methods
After receiving Institutional Review Board approval, all patients who underwent TARE between 1/1/2015 and 3/15/2020 were retrospectively reviewed. Inclusion criteria included having a post treatment single-photon emission computerized tomography (SPECT) computed tomography (CT), having lymphocyte data available for at least pre and 1 month post treatment time points, and being treated for HCC. Exclusion criteria included patients who had delivery from multiple arteries at one time, were treated with radioembolization or other forms of radiation within a year of initial treatment, and those who were initiated on systemic therapy within 1 year of treatment. In total 93 patients who were treated with 102 TARE treatments for HCC were included during the study period.
Transarterial Radioembolization Technique
TARE was performed in a manner similar to previously described techniques.1–3 However, in brief patients with HCC were presented at a multi-disciplinary tumor board. If patients were not candidates for curative intent surgery or thermal ablation they were considered for intra-arterial therapy. The choice of transarterial chemoembolization (TACE) or TARE was ultimately at the discretion of the performing Interventional Radiologist. However, in general those with larger lesions and with more aggressive features (infiltrative disease, portal vein tumor thrombus, etc) were more likely to undergo TARE. Patients underwent a mapping procedure utilizing technetium-99m macro-aggregated albumin (Tc 99m MAA). Following Tc 99m MAA delivery patients underwent a SPECT CT to determine distribution within the liver, lung shunt fraction, and if extra-hepatic signal was present. The dose per patient was calculated at the performing Interventional Radiologist preference utilizing a variety of dosimetry techniques, including body-surface area (BSA), Medical Internal Radiation Dose (MIRD), partition, and a multi-compartment method, during the study period. Similarly, the target absorbed dose varied over the study period. Patients returned within two weeks of mapping and the dose was delivered from the pre-determined location. Following delivery patients underwent a post TARE bremsstrahlung SPECT CT.
Calculation of Tumor and Normal Tissue Dose
In order to calculate the absorbed dose Simplicit90y™ (Mirada Medical, Denver, CO) software was utilized. Pretreatment dynamic contrast enhanced magnetic resonance imaging (MRI)s or CTs were used to draw 3D regions of interest (ROI) by a single interventional radiologist with greater than 5 years of experience. The perfused volume, including the normal and tumoral tissues were contorted using the lowest relevant isodose curve. The normal tissue was obtained by subtracting the tumoral tissue from the total perfused volume. Co-registration was evaluated and adjusted to fit the anatomic structures within the y90 bremsstrahlung SPECT CT and ensure accuracy. The activity delivered was calculated by measuring the predelivery activity with a dose calibrator (Mirion Technologies Inc, Atlanta, GA) and subtracting the residual activity after delivery. The activity was then entered in the Simplicit90y™ software. The lung shunt fraction was calculated using a standard planar calculation method and this too was entered into the Simplicit90y™ software. Simplicit90y™ uses the following mathematical formulas to reach the absorbed dose:
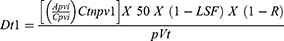
where Dt is the tumor absorbed dose in Gy, Apvi is the injected activity (GBq) of the perfused volume, Cpvi is the number of counts in the perfused volume, Ctnpv1 is the number of counts in the intersection of tumor volume and perfused volume (ie, counts in the segmented tumor volume), p is the tumor tissue density in kg/cm3, Vt is the volume of the tumor in cm3, LSF is the lung shunt fraction, and R is the residual activity.

where Dnt is the normal tissue absorbed dose in Gy, Apvi is the injected activity (GBq) of the perfused volume, Cpvi is the number of counts in the perfused volume, Cntpv1 is the number of counts in the intersection of normal tissue volume and perfused volume i (ie, counts in the segmented normal tissue volume), p is the tumor tissue density in kg/cm3, Vnt is the volume of the normal tissue in cm3, LSF is the lung shunt fraction, and R is the residual activity.
Variables Assessed
Patients lymphocyte counts at baseline as well as 1, 3, 6, and 12 months post procedure were collected. Lymphocyte percentage was calculated by dividing the post treatment lymphocyte count by the pretreatment count. The lymphocyte change was calculated by subtracting the pretreatment lymphocyte count from the post treatment count. Lymphocyte change and lymphocyte percentage were calculated to provide greater detail in the dynamic change in lymphocytes. Novel calculations of normal liver dose multiplied by perfused volume and normal liver dose divided by percent liver treated (in decimal form) were also completed and evaluated. Overall survival was calculated as time from TARE to death and censored for last known follow-up and transplant. The number of treatments available for lymphocyte analysis at 1, 3, 6, and 12 months was 102, 59, 53, and 45, respectively.
Statistical Analysis
Quantitative variables are expressed as mean ± standard deviations or median followed by interquartile range (IQR). Qualitative variables are expressed as frequencies followed by percentages in parentheses. Two-way T-test was used to analyze continuous variables and Chi-Squared was utilized to evaluate categorical data. Kaplan-Meier analysis was performed for overall survival and Cox regression was utilized to determine hazard ratios (HR). A Spearman Correlation was utilized to evaluate the relationship of various factors to lymphocyte counts. A receiver operating characteristic (ROC) curve analysis was performed and area under the curve (AUC) was reported. The ROC analysis was also utilized to identify cut off points utilizing Youden’s index. To further evaluate the data cohorts were split by absolute lymphocyte count ≤1 103/µL or >1 103/µL, consistent with prior studies.8 Similarly, they were separated by percent lymphocyte reduction and lymphocyte change. R (Version 3.4.1, The R Foundation for Statistical Computing) was used for the analysis and p-values of <0.05 were considered statistically significant.
Results
Demographic data can be found in Table 1. The mean age of the cohort was 64.6 ± 11.5 years and it included 78 (78/93, 83.9%) men and 15 (15/93, 16.2%) women. The mean absolute lymphocyte count at baseline was 1.25 ± 0.79 103/µL which was significantly greater than 1 (0.71 ± 0.47 103/µL, p<0.0001), 3 (0.79 ± 0.77 103/µL, p=0.0003), and 6 (0.81 ± 0.44 103/µL, p=0.0001) months post treatment, but not significantly different than 12 months post treatment (0.92 ± 0.8 103/µL, p=0.12). Table 2 provides the dynamic changes in lymphocyte counts in terms of absolute lymphocyte count, change in lymphocyte count, and percent change in lymphocytes.
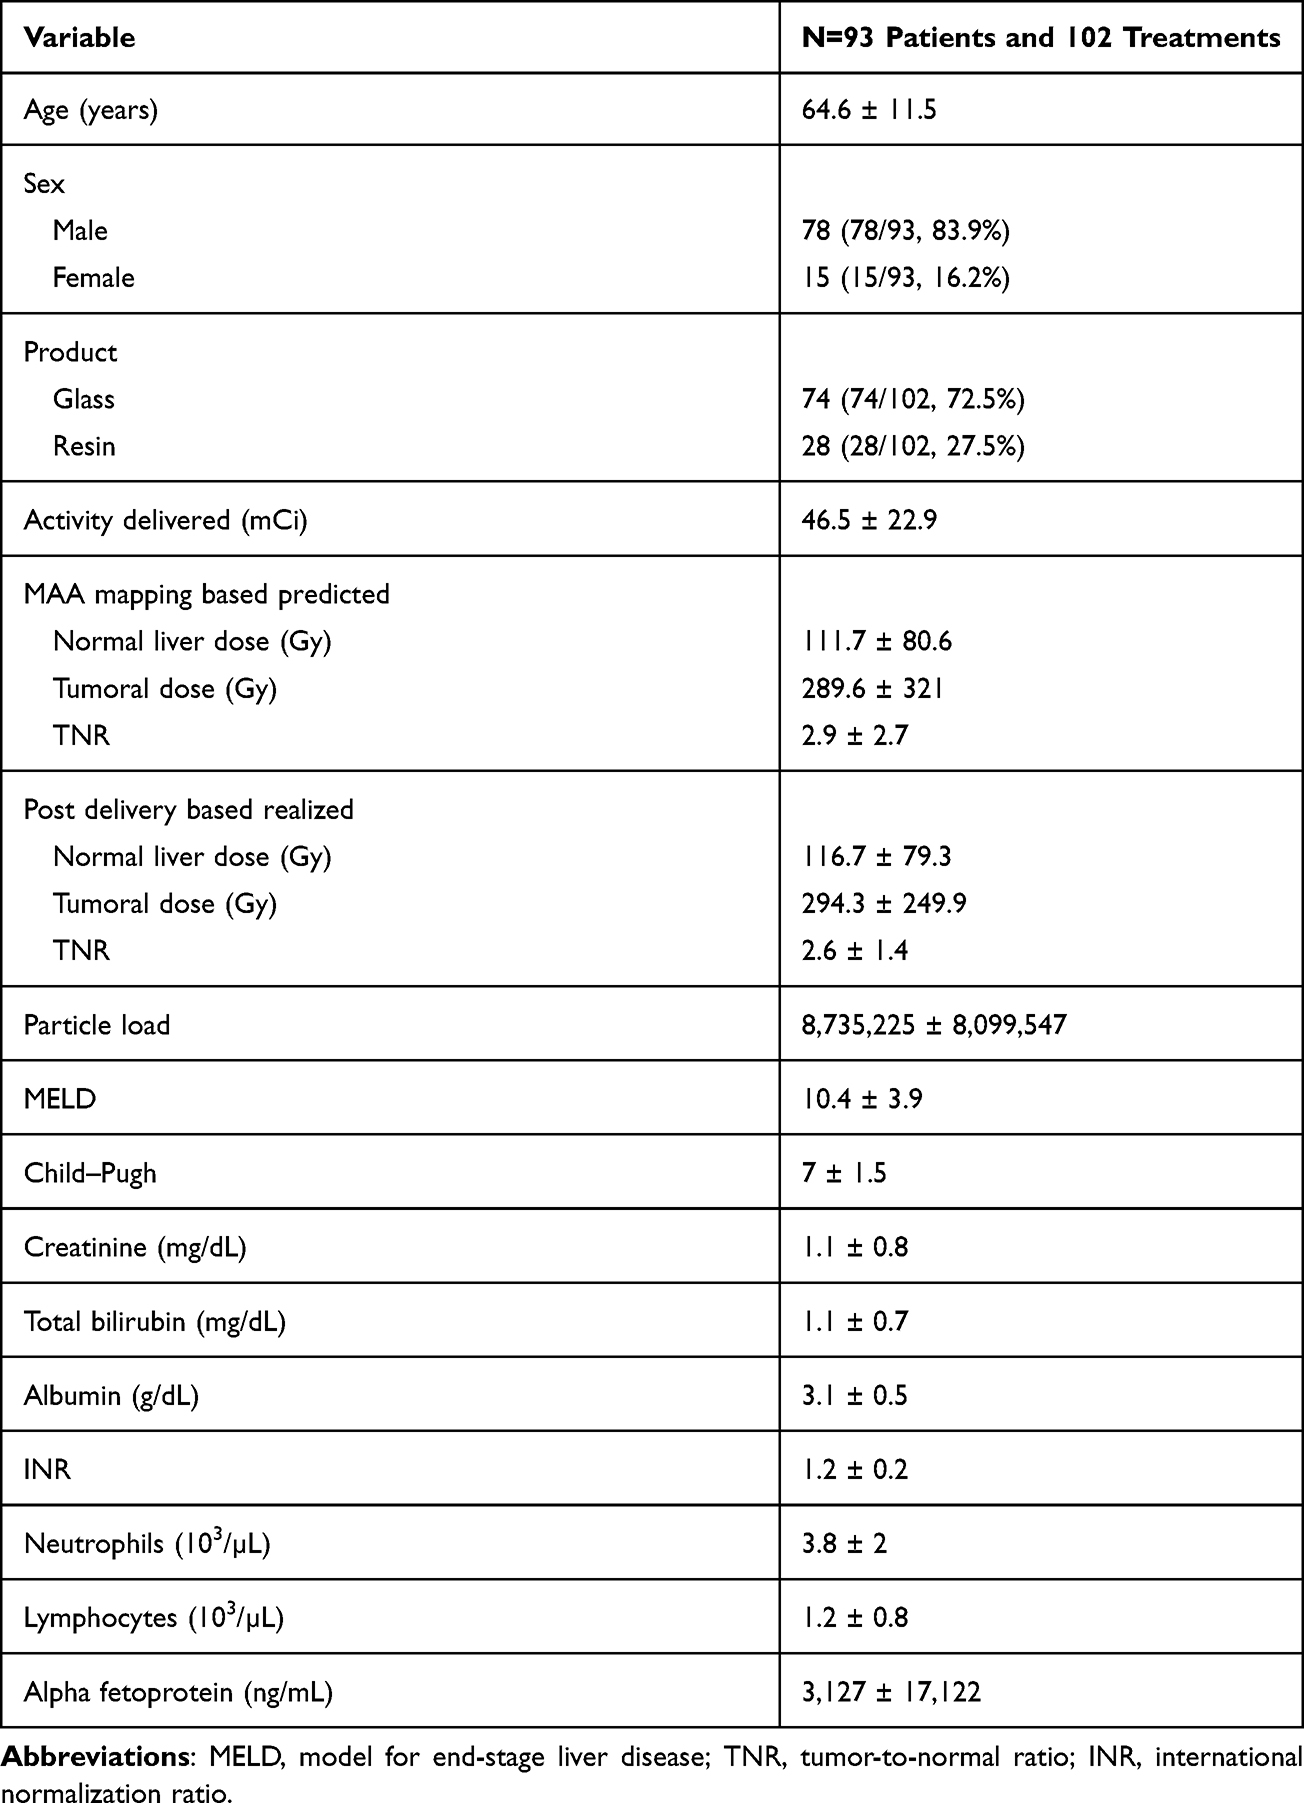 |
Table 1 Demographic Data |
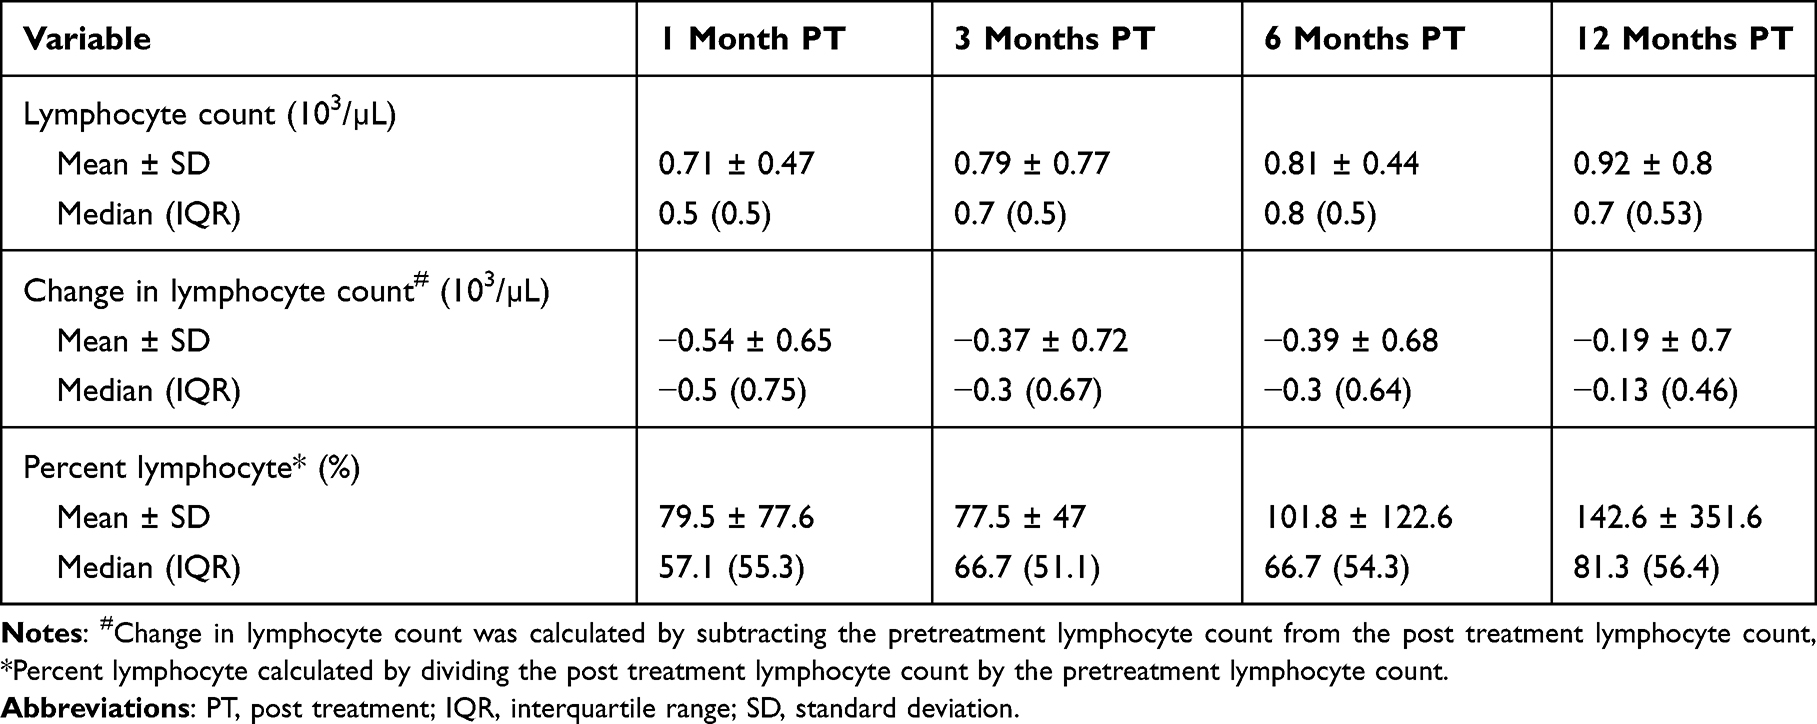 |
Table 2 Measures of Dynamic Lymphocyte Changes Following Transarterial Radioembolization |
Correlation Analysis
Table 3 demonstrates the Spearman correlation between NLD and lymphocytes. There was a modest negative correlation between NLD and lymphocyte count at 1 month post treatment (rho= −0.216, p=0.03), which strengthened at 3 months post treatment (rho= −0.342, p=0.008). However, at 6 months post treatment (rho= −0.191, p=0.17) and 12 months post treatment (rho= −0.045, p=0.77), the correlation was no longer present. At 3 months, perfused volume (0.376, p=0.003) showed a correlation, while NLD/percent liver demonstrated a negative correlation (−0.354, p=0.006). Finally, at 6 months, particle load demonstrated a correlation (0.356, p=0.01). No correlations were noted at 12 months.
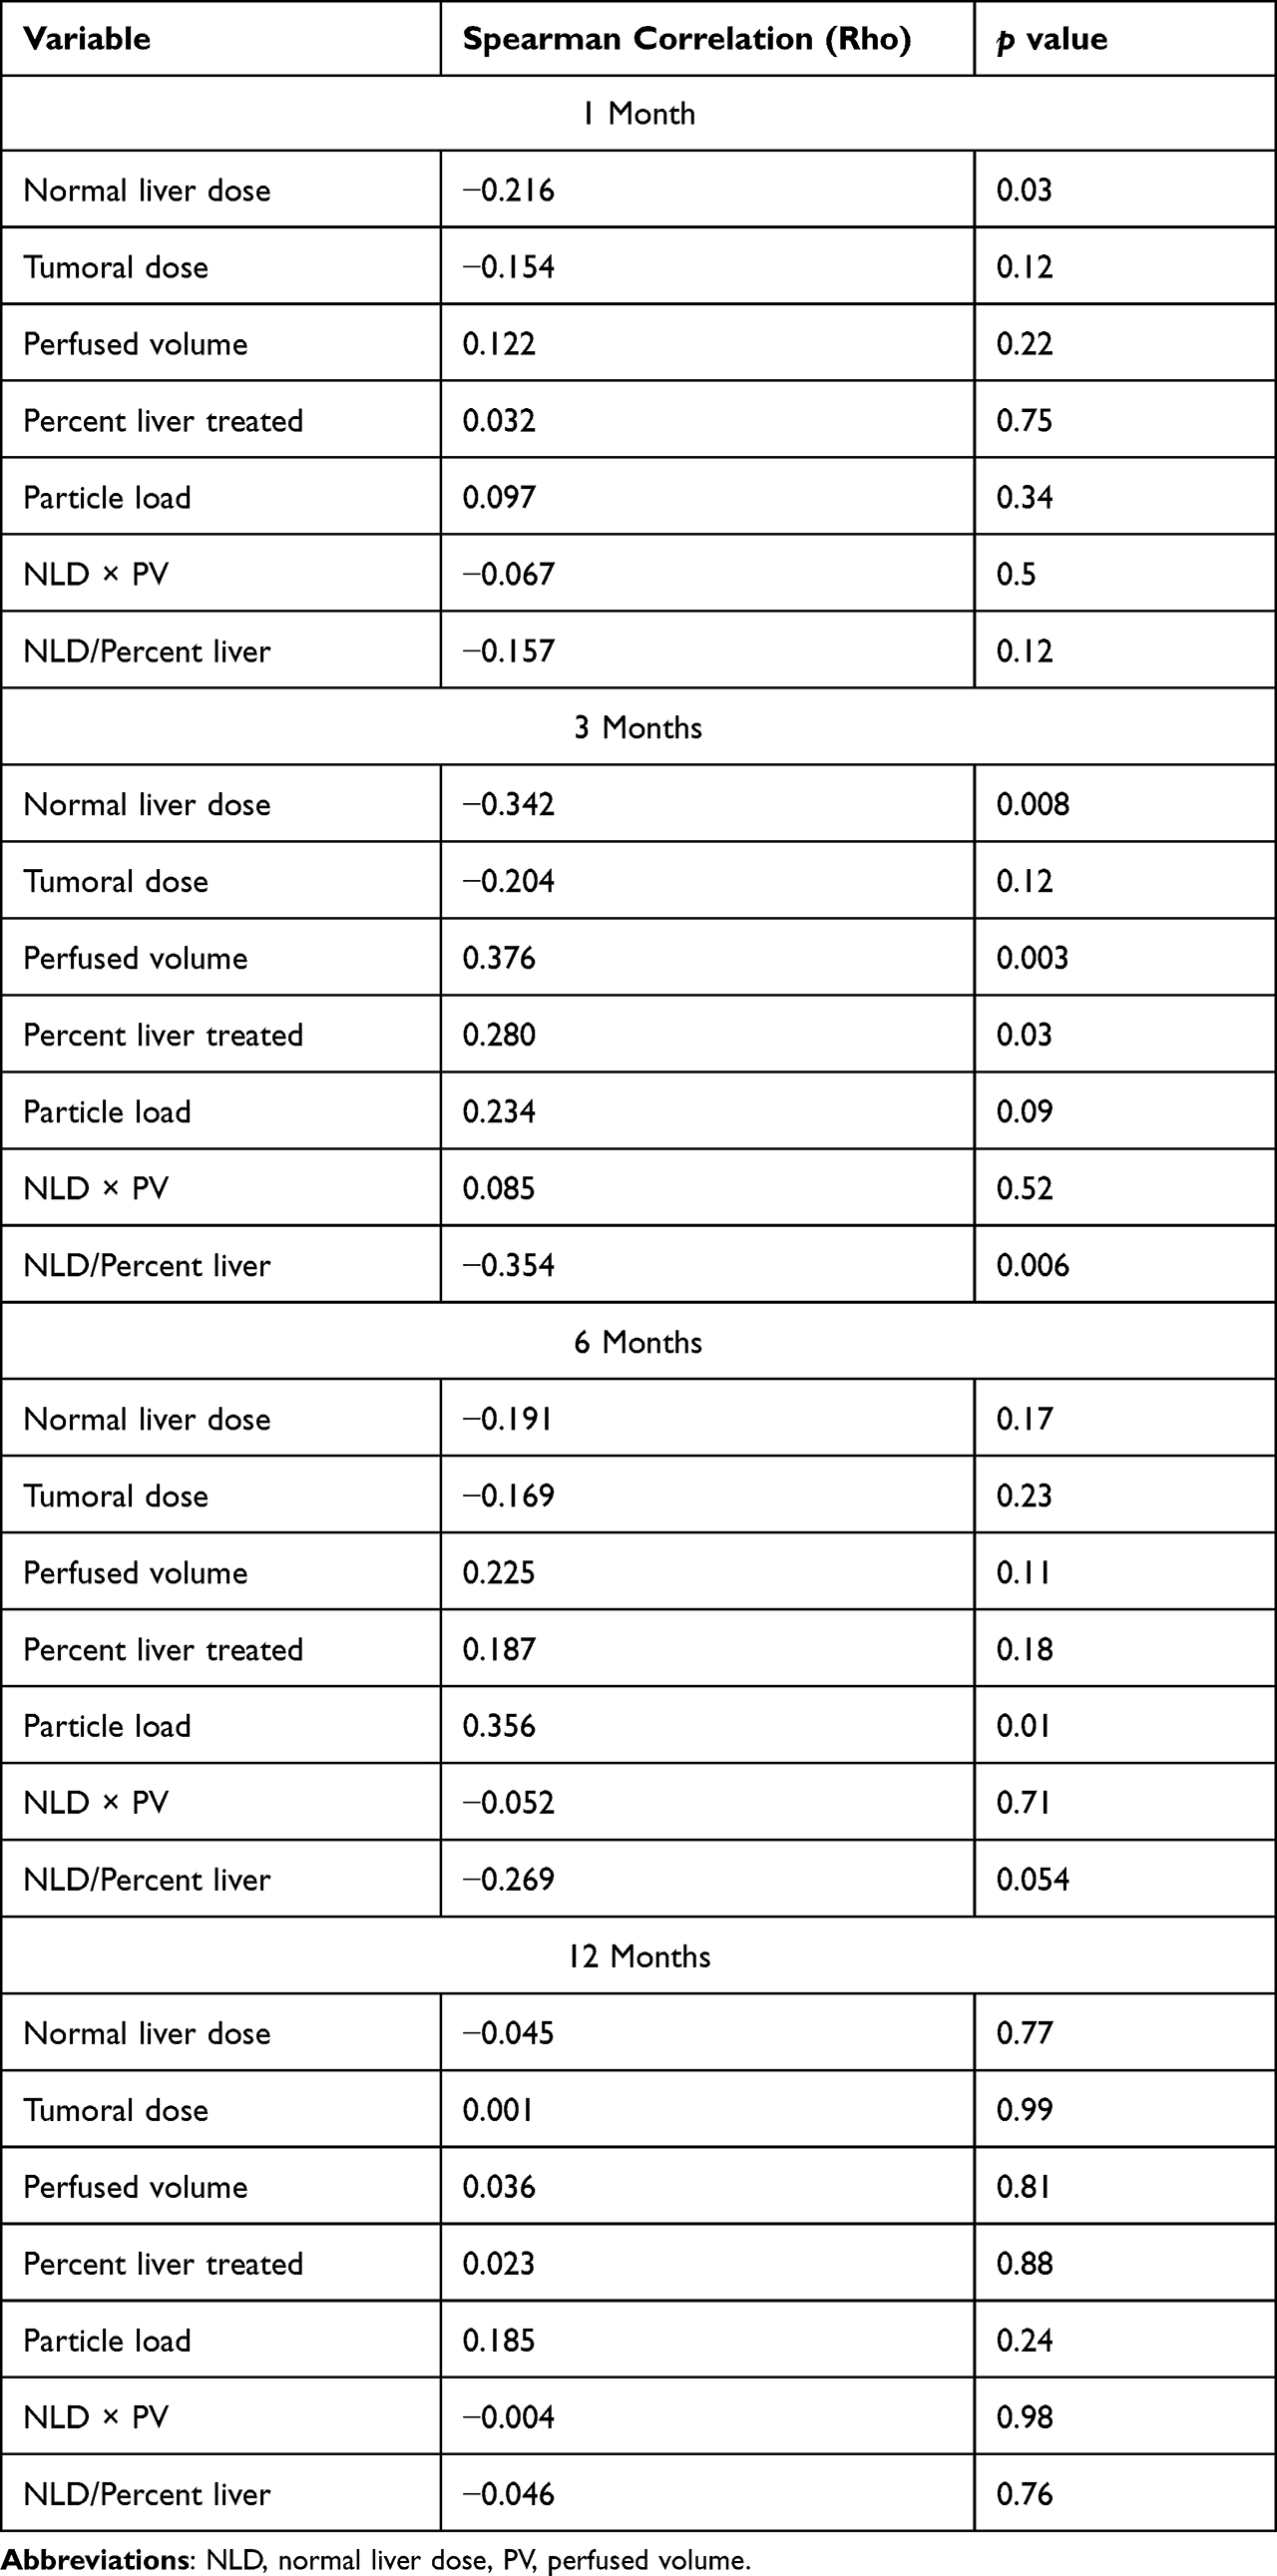 |
Table 3 Evaluation of Correlation Between Post Treatment Lymphocyte Count and Treatment-Related Variables |
ROC Analysis of NLD and Lymphocyte Count
Table 4 demonstrates AUC of ROC analysis between absolute lymphocyte count ≤1 103/µL or >1 103/µL. The AUC at 1, 3, 6, and 12 months post treatment was 0.625, 0.676, 0.560, and 0.794, respectively. Using an ROC analysis and Youden’s index the cutoff point an NLD of 62.3 Gy, 70.2 Gy, 62.2 Gy, and 60.6 Gy for 1, 3, 6, and 12 months post treatment respectively was identified.
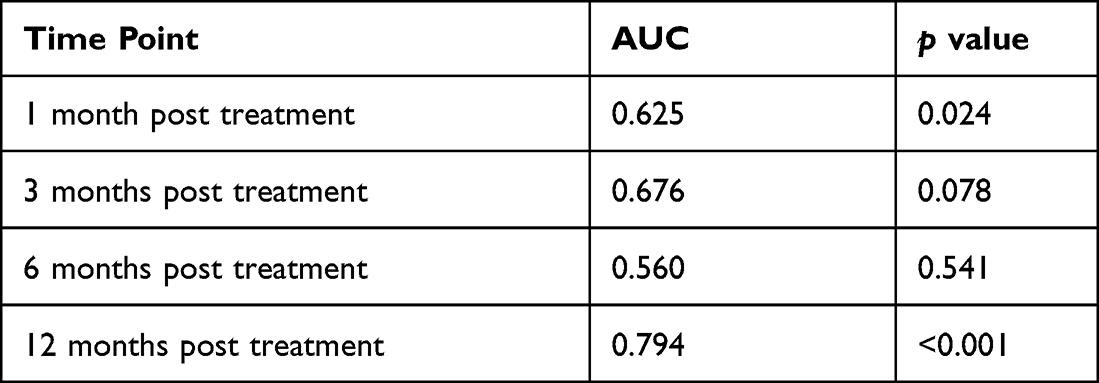 |
Table 4 Receiver Operating Correlation Curve Analysis of Lymphocytes and Normal Liver Dose |
Table 5 demonstrates comparison between cohorts when NLD cutoffs identified above were utilized. At 1 month post treatment, if patients were categorized utilizing the NLD of 62.3 Gy there was a significant difference in the lymphocyte count (p<0.001), lymphocyte percent (0.03), but not the lymphocyte change (p=0.09). At 3 months when the cohorts were separated by a NLD of 70.2 Gy there was a significant difference in percent lymphocyte (p=0.02) and lymphocyte change (p=0.049), but not lymphocyte count (p=0.5). At 6 and 12 months only the lymphocyte count (p=0.01 and p=0.003, respectively) remained significant while percent lymphocyte and lymphocyte change did not (p>0.05 for all) when utilizing 62.2 Gy and 60.6 Gy, respectively.
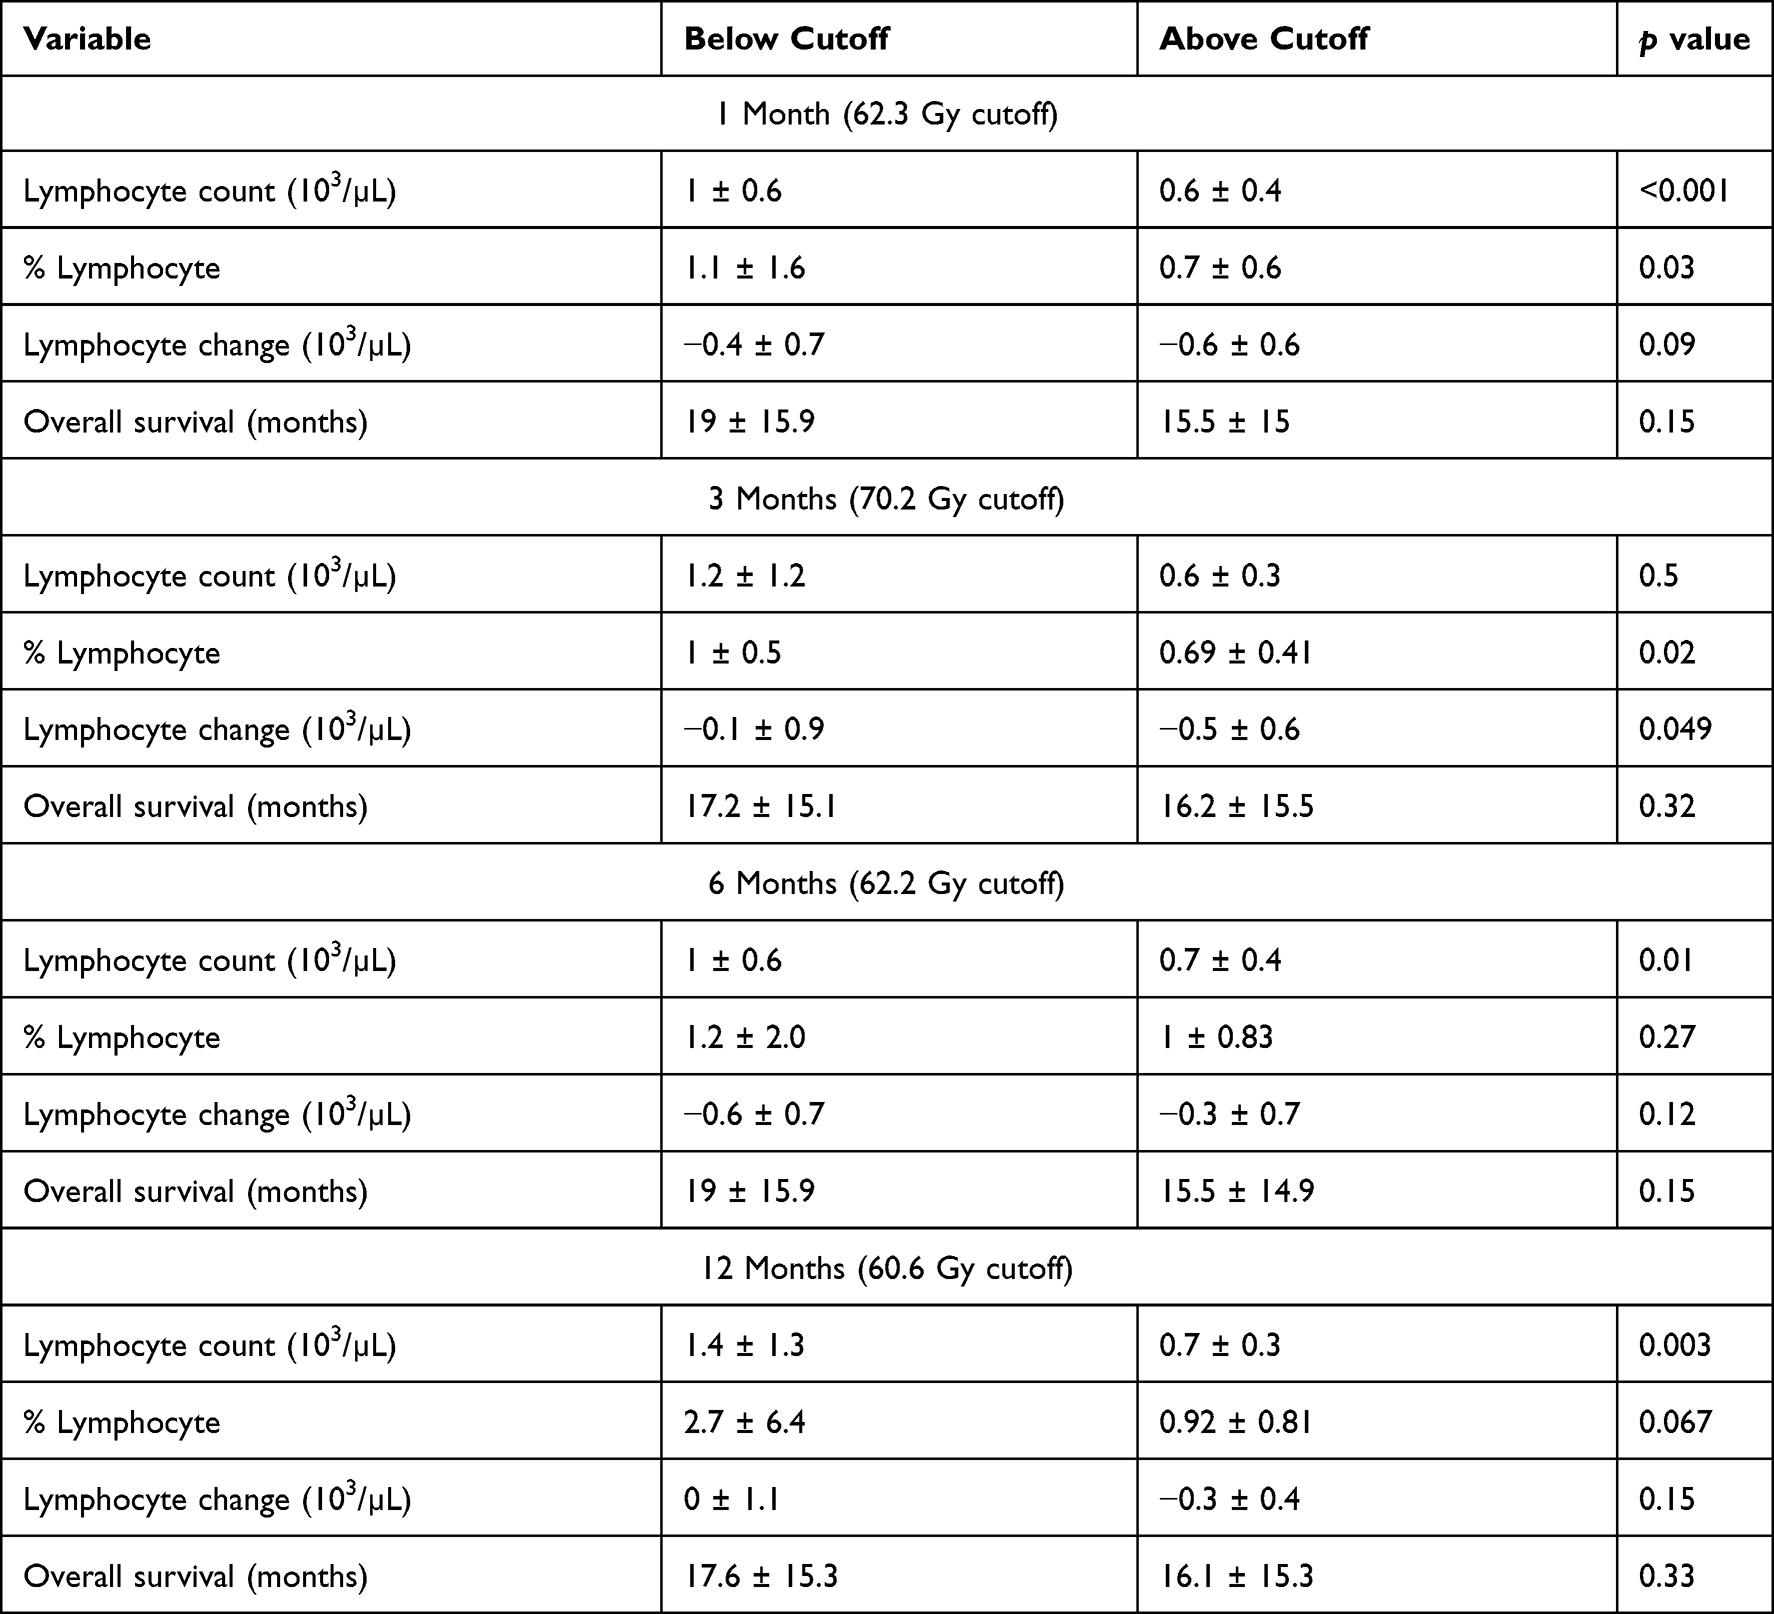 |
Table 5 Comparison of Those Above and Below Normal Liver Dose Cutoffs as Determined by Receiver Operating Correlation Curve Analysis |
Overall Survival
Figure 1 demonstrates the Kaplan–Meier curve analysis when separating patients by a lymphocyte count ≤1 103/µL and >1 103/µL. While no significant difference was found at the pretreatment time point (HR: 0.77, 95% CI: 0.47–124, p=0.28), there was a significant difference in the OS at 1 (HR: 0.56, 95% CI: 0.33–0.95, p=0.03), 3 (HR: 0.41, 95% CI: 0.18–0.94, p=0.035) and 6 months (HR: 0.36, 95% CI: 0.17–0.77, p=0.008) post treatment when separating the group in this way. However, no significant difference was seen at 12 months (HR: 0.52, 95% CI: 0.21–1.28, p=0.15) post treatment.
 |
Figure 1 (A) Kaplan–Meier overall survival curve comparing those with pretreatment absolute lymphocyte counts ≤1 103/µL or >1 103/µL (HR: 0.77, 95% CI: 0.47–124, p=0.28). (B) Kaplan–Meier overall survival curve comparing those with absolute lymphocyte counts ≤1 103/µL or >1 103/µL at 1 month post treatment (HR: 0.56, 95% CI: 0.33–0.95, p=0.03). (C) Kaplan–Meier overall survival curve comparing those with absolute lymphocyte counts ≤1 103/µL or >1 103/µL at 3 months post treatment (HR: 0.41, 95% CI: 0.18–0.94, p=0.035). (D) Kaplan–Meier overall survival curve comparing those with absolute lymphocyte counts ≤1 103/µL or >1 103/µL at 6 months post treatment (HR: 0.36, 95% CI: 0.17–0.77, p=0.008). (E) Kaplan–Meier overall survival curve comparing those with absolute lymphocyte counts ≤1 103/µL or >1 103/µL at 12 months post treatment (HR: 0.52, 95% CI: 0.21–1.28, p=0.15). |
The NLD cutoff values determined by ROC analysis were utilized to separate the study group into two cohorts. However, Kaplan–Meier survival analysis (Figure 2) failed to show a significant difference at 62.3 Gy (1 month Youden’s index) (HR: 1.23, 95% CI: 0.74–2.05, p=0.41), 70.2 Gy (3 month Youden’s index) (HR: 1.03, 95% CI: 0.63–1.69, p=0.90), 62.2 Gy (6 month Youden’s index) (HR1.23, 95% CI: 0.74–2.05, p=0.42), or 60.6 Gy (12 month Youden’s index) (HR0.98, 95% CI: 0.58–1.68, p=0.95).
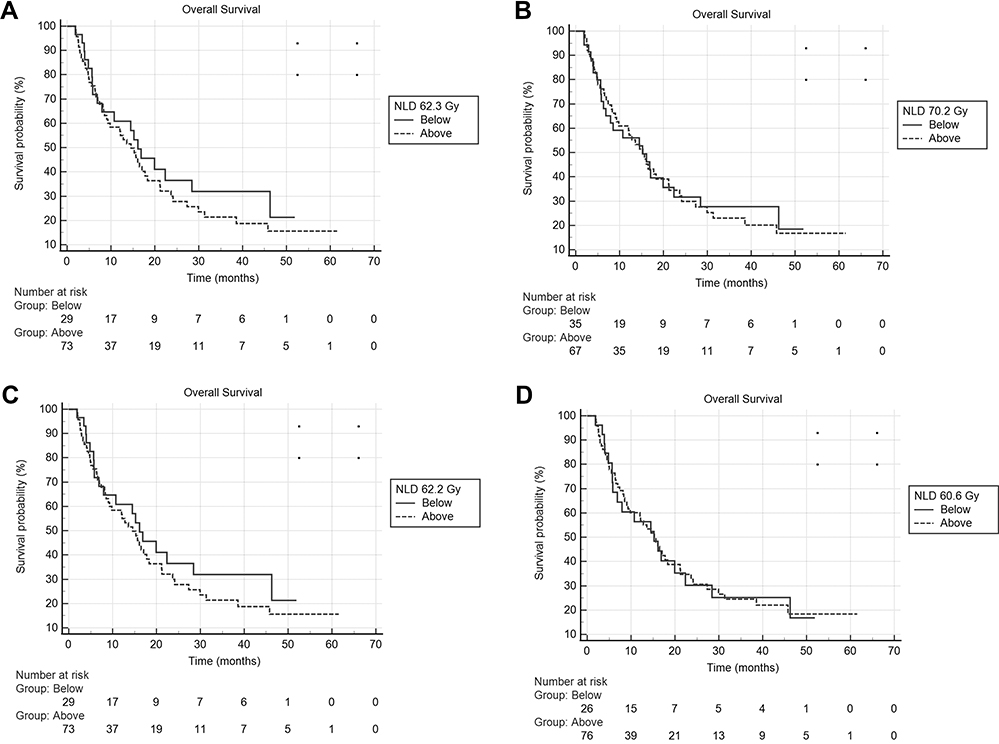 |
Figure 2 (A) Kaplan–Meier overall survival curve comparing those with normal liver dose of less than or greater than 62.3 Gy (HR: 1.23, 95% CI: 0.74–2.05, p=0.41). (B) Kaplan–Meier overall survival curve comparing those with normal liver dose of less than or greater than 70.2 Gy (HR: 1.03, 95% CI: 0.63–1.69, p=0.90). (C) Kaplan–Meier overall survival curve comparing those with normal liver dose of less than or greater than 62.2 Gy (HR1.23, 95% CI: 0.74–2.05, p=0.42). (D) Kaplan–Meier overall survival curve comparing those with normal liver dose of less than or greater than 60.6 Gy (HR0.98, 95% CI: 0.58–1.68, p=0.95). |
Discussion
While TARE has been firmly established as an effective treatment modality for HCC, our knowledge of dosimetry continues to be lacking.1–5 This is particularly true in the arena of NLD and the effects that it has on post treatment complications and laboratory values. This study was performed to test the hypothesis that NLD correlated with post treatment lymphocyte counts and during the analysis a modest negative correlation between NLD and post treatment lymphocyte count was found at 1 month (rho= −0.216, p=0.03) which strengthened at 3 months (rho= −0.342, p=0.008). The 3 month post treatment correlation was somewhat consistent with Estrade et al who found a rho of −0.29 (p=0.001) at three months post treatment when looking at NLD and lymphocyte count.8 No correlation was noted at 6 (rho= −0.191, p=0.17) and 12 (rho= −0.045, p=0.77) months. The fact that the 3 month post treatment time point showed the strongest correlation is of interest and may be related to dynamic changes in lymphocyte count following TARE. The half-life of yttrium-90 is 64.2 hours and if 5 half-lives is considered the treatment window this means it would last for approximately 13.4 days. Therefore, at 1 month, there may not have been enough time for all lymphocytes that are damaged to be cleared from the blood stream. Theoretically, this may have taken place by 3 months post treatment. Conversely, the half-life of CD 4+ and CD 8+ lymphocytes in healthy patients was found to be 87 and 77 days respectively with absolute production of 10 CD 4+ T cells/µL per day and 6 CD 8+ T cells/µL per day in one study.21 This production may explain why the correlations no longer persist at 6 and 12 months. This information is of interest when contemplating synergistic treatment algorithms incorporating TARE and immunotherapy. However, it should be noted that absolute lymphocyte counts are only a crude measure, with specific lymphocyte populations being of greater interest in the complex mechanism of cancer immunology. Despite this limitation, the data here may provide some guidance on sequencing of immunotherapy and TARE as well as guide further study.
In another evaluation of the relationship between NLD and lymphocyte count, an AUC of ROC analysis between absolute lymphocyte count ≤1 103/µL or >1 103/µL was performed. This demonstrated an AUC of 0.625, 0.676, 0.560, and 0.794 at 1, 3, 6, and 12 months post treatment respectively. While the data at 1, 3, and 6 months seem to support the correlation analysis, the fairly high AUC of 0.794 at 12 months was unexpected. This may simply relate to the relatively small cohort available for this analysis; however, further study is needed. When utilizing the ROC analysis to identify NLD cutoff points, values between 60 and 70 Gy were determined for each time point. This is different than prior authors, who when evaluating for hepatotoxicity and NLD focused primarily on development of laboratory and clinical factors that suggest liver failure. In this setting, two publications from the same research group identified NLD >100 or >120 Gy combined with a hepatic reserve of <30% to be associated with the development of liver failure.7,22 In a complex analysis based around the development of similar measures of liver failure, Chiesa et al determined that 50 or 90 Gy was an ideal cutoff depending on baseline bilirubin of less than or greater than 1.1 mg/dL.23 However, this 50 or 90 Gy was the absorbed dose to the entire non-tumoral liver, meaning the activity predicted to go to the normal liver in the perfused area was utilized to determine what the dose would be if that activity was distributed to the entire non-tumor liver area. Therefore, the 50 or 90 Gy seen in Chiesa et al's paper is much closer to the 100 or 120 Gy cutoff determined by Garin et al, than to 60–70 Gy determined here. This is likely explained by the fact that these prior authors were evaluating the NLD cutoff for developing signs of liver failure, while the current study is evaluating cutoffs for lymphocyte depression.
The OS was found to differ in cohorts with ≤1 103/µL and >1 103/µL at 1, 3 and 6 months post treatment, but not pretreatment or 12 months post treatment. This is interesting and may suggest that treatment induced lymphopenia portends a worse OS; however, further data are needed. Given the correlation of NLD and lymphocyte depression at 1 and 3 months post treatment this data may also suggest that over exposure of the normal tissue to radiation can have negative effects in some situations. However, again further data would be needed to examine this relationship. The same cannot be said of the association between survival and lymphopenia at 6 months, as a correlation between NLD and lymphocyte depression at 6 months was not seen in this study. It is possible that the 6-month correlation between survival and lymphopenia is influenced by more than simply the NLD. Few studies have evaluated the relationship between post treatment lymphopenia and OS. Estrade et al evaluated OS and lymphopenia and showed a trend towards worse overall survival in those with <1 G/L at 3 months post treatment (median OS 17.3 vs 19.9 months, p=0.058) while seeing no association at the pretreatment time point.8 These findings are fairly similar to our study, which did show a significant association between lymphopenia and OS at 3 months. Dunfee et al found that patients with lymphocyte depression had improved OS as compared to those without it post treatment, when evaluating patients with cancers other than HCC.13 However, it is difficult to extend these findings across diseases to the HCC cohort and this may explain the discrepancy in results from the Dunfee et al study and the current study.
Given the authors hypothesis that NLD would be associated with lymphopenia and pretreatment lymphopenia has been associated with poorer OS, the authors investigated the relationship between NLD and OS. The association between NLD and OS was evaluated utilizing the NLD cutoffs determined by ROC analysis at each time point, no association between OS and NLD was identified at any post treatment time point. These findings are likely explained by the relationship between tumoral and normal liver dose. Several studies recently have indicated that increased dose to the tumor3 or perfused volume,2 correlate with improved clinical outcomes and OS in certain HCC patients. As an increased tumoral dose will almost always also result in an increased NLD it is to be expected that NLD may not correlate well with OS. When taken as a whole the findings of this study namely, that NLD may correlate with lymphocyte depression, lymphopenia may correlate with poorer OS, but NLD does not seem to correlate with OS directly, this study may suggest that careful attention to TARE dosing is needed and patient context is of considerable importance.
This study has several limitations including its retrospective nature. The cohort was also fairly limited and this was furthered by the fact that not all variables were available for each patient. While dynamic lymphocyte changes were studied, no data on specific lymphocyte populations were available. Furthermore, the study period spanned several different dosimetry methods and targets at the study institution which may provide a confounding variable; however, as the post yttrium-90 delivery bremsstrahlung SPECT CT was utilized to determine NLD, these differences should be accounted for to some degree.
In conclusion, a moderate correlation between NLD and lymphocyte count may exist and be most pronounced at the 3 month post treatment. While lymphopenia was found to be associated with poorer OS at 1, 3, and 6 months post treatment no direct relationship between NLD and OS was found.
Abbreviations
AUC, area under the curve; BSA, Body surface area; CT, computed tomography; HCC, Hepatocellular carcinoma; IQR, Interquartile range; MIRD, Medical internal radiation dose; MRI, Magnetic resonance imaging; NLD, Normal liver dose; OS, Overall survival; ROC, Receiver operating characteristic; ROI, Region of interest; SPECT, Single-photon emission computerized tomography (SPECT); TACE, Transarterial chemoembolization; TARE, Transarterial radioembolization; Tc 99m MAA, Technetium-99m macro-aggregated albumin.
Ethics Approval and Informed Consent
The University of Minnesota Institutional Review Board approved this retrospective study. While consent was obtained for the procedure the IRB waived consent for this study, given all patients are asked to opt in or out of research at our institution. This study was completed in accordance with the Declaration of Helsinki. The researchers have taken every percaution to protect the information provided by patients from violating their privacy.
Consent for Publication
SY gave consent for publication on behalf of all authors.
Author Contributions
All authors contributed meet the following criteria for authorship:
- Made a significant contribution to the work reported, whether that is in the conception, study design, execution, acquisition of data, analysis and interpretation, or in all these areas.
- Have drafted or written, or substantially revised or critically reviewed the article.
- Have agreed on the journal to which the article will be submitted.
- Reviewed and agreed on all versions of the article before submission, during revision, the final version accepted for publication, and any significant changes introduced at the proofing stage.
- Agree to take responsibility and be accountable for the contents of the article.
Funding
No funding was received for this article.
Disclosure
JG and DD are consultants for Sirtex. SY is a consultant for Boston Scientific. The authors report no other conflicts of interest in this work.
References
1. Salem R, Gordon AC, Mouli S, et al. Y90 radioembolization significantly prolongs time to progression compared with chemoembolization in patients with hepatocellular carcinoma. Gastroenterology. 2016;151(6):1155–1163. doi:10.1053/j.gastro.2016.08.029
2. Salem R, Johnson GE, Kim E, et al. Yttrium-90 radioembolization for the treatment of solitary, unresectable hepatocellular carcinoma: the LEGACY study. Hepatology. 2021;74(5):2342–2352. doi:10.1002/hep.31819
3. Garin E, Tselikas L, Guiu B, et al. Personalised versus standard dosimetry approach of selective internal radiation therapy in patients with locally advanced hepatocellular carcinoma (DOSISPHERE-01): a randomized, muticentre, open-label Phase 2 trial. Lancet Gastroenerol Hepatol. 2021;6(1):17–29. doi:10.1016/S2468-1253(20)30290-9
4. Salem R, Padia SA, Lam M, et al. Clinical and dosimetric considerations for Y90: recommendations from an international multidisciplinary working group. Eur J Nucl Med Mol Imaging. 2019;46(8):1695–1704. doi:10.1007/s00259-019-04340-5
5.) Lam M, Salem S, Garin E A global study of advanced dosimetry in the treatment of hepatocellular carcinoma with Yttrium-90 glass microspheres: analyses from the TARGET study.
6. Chan KT, Alessio AM, Johnson GE, et al. Prospective trial using internal pair-production positron emission tomography to establish the Yttrium-90 radioembolization dose required for response of hepatocellular carcinoma. Int J Radiat Oncol Bio Phys. 2018;101(2):358–365. doi:10.1016/j.ijrobp.2018.01.116
7. Garin E, Rolland Y, Pracht M, et al. High impact of macroaggregated albumin-based tumour dose on response and overall survival in hepatocellular carcinoma patients treated with 90Y-loaded glass microsphere radioembolization. Liver Int. 2017;37(1):101–110. doi:10.1111/liv.13220
8. Estrade F, Lescure C, Muzellec L, et al. Lymphocytes and neutrophil-to-lymphocyte ratio variations after selective internal radiation treatment of HCC: a retrospective cohort study. Cardiovasc Intervent Radiol. 2020;43(8):1175–1181. doi:10.1007/s00270-020-02467-9
9. Venkatesulu BP, Mallick S, Lin SH, Krishnan S. A systemic review of the influence of radiation-induced lymphopenia on survival outcomes in solid tumors. Crit Rev Oncol Hematol. 2018;123:42–51. doi:10.1016/j.critrevonc.2018.01.003
10. Domouchtsidou A, Barsegian V, Mueller SP, et al. Impaired lymphocyte function in patients with hepatic malignancies after selective internal radiotherapy. Cancer Immunol Immunother. 2018;67(5):843–853. doi:10.1007/s00262-018-2141-0
11. Carr BI. Hepatic arterial 90Yttrium glass microspheres (Therasphere) for unresectable hepatocellular carcinoma: interim safety and survival data on 65 patients. Liver Transpl. 2004;10:S107–110. doi:10.1002/lt.20036
12. Salem R, Lewandowski RJ, Atassi B, et al. Treatment of unresectable hepatocellular carcinoma with use of 90Y microspheres (TheraSphere): safety, tumor response, and survival. J Vasc Interv Radiol. 2005;16(12):1627–1639. doi:10.1097/01.RVI.0000184594.01661.81
13. Dunfee BL, Riaz A, Lewandowski RJ, et al. Yttrium-90 radioembolization for liver malignancies: prognostic factors associated with survival. J Vasc Interv Radiol. 2010;21(1):90–95. doi:10.1016/j.jvir.2009.09.011
14. Li X, Montazeri SA, Paz-Fumagalli R, et al. Prognostic significance of neutrophil to lymphocyte ratio dynamics in patients with hepatocellular carcinoma treated with radioembolization using glass microspheres. Eur J Nucl Med Mol Imaging. 2021;48(8):2624–2634. doi:10.1007/s00259-020-05186-y
15. Gok Yavuz B, Hasanov E, Lee SS, et al. Current landscape and future directions of biomarkers for immunotherapy in hepatocellular carcinoma. J Hepatocell Carcinoma. 2021;8:1195–1207. doi:10.2147/JHC.S322289
16. Greten TF, Mauda-Havakuk M, Heinrich B, Korangy F, Wood BJ. Combined locoregional-immunotherapy for liver cancer. J Hepatol. 2019;70(5):999–1007. doi:10.1016/j.jhep.2019.01.027
17. Chew V, Lee YH, Pan L, et al. Immune activation underlies a sustained clinical response to yttrium-90 radioembolisation in hepatocellular carcinoma. Gut. 2019;68(2):335–346. doi:10.1136/gutjnl-2017-315485
18. Camphausen K, Moses MA, Menard C, et al. Radiation abscopal antitumor effect is mediated through p53. Cancer Res. 2003;63(8):1990–1993.
19. Filatenkov A, Baker J, Mueller AM, et al. Ablative tumor radiation can change the tumor immune cell microenvironment to induce durable complete remissions. Clin Cancer Res. 2015;21(16):3727–3739. doi:10.1158/1078-0432.CCR-14-2824
20. Nagai S, Abouljoud MS, Kazimi M, Brown KA, Moonka D, Yoshida A. Peritransplant lymphopenia is a novel prognostic factor in recurrence of hepatocellular carcinoma after liver transplantation. Transplantation. 2014;97(6):694–701. doi:10.1097/01.TP.0000437426.15890.1d
21. Hellerstein M, Hanley MB, Cesar D, et al. Directly measured kinetics of circulating T lymphocytes in normal and HIV-1-infected humans. Nat Med. 1999;5(1):83–89. doi:10.1038/4772
22. Garin E, Lenoir L, Edeline J, et al. Boosted selective internal radiation therapy with 90Y-loaded glass microspheres (B-SIRT) for hepatocellular carcinoma patients: a new personalized promising concept. Eur J Nucl Med Mol Imaging. 2013;40(7):1057–1068. doi:10.1007/s00259-013-2395-x
23. Chiesa C, Mira M, Bhoori S, et al. Radioembolization of hepatocarcinoma with (90)Y glass microspheres: treatment optimization using the dose-toxicity relationship. Eur J Nucl Med Mol Imaging. 2020;47(13):3018–3032. doi:10.1007/s00259-020-04845-4
 © 2022 The Author(s). This work is published and licensed by Dove Medical Press Limited. The
full terms of this license are available at https://www.dovepress.com/terms
and incorporate the Creative Commons Attribution
- Non Commercial (unported, 3.0) License.
By accessing the work you hereby accept the Terms. Non-commercial uses of the work are permitted
without any further permission from Dove Medical Press Limited, provided the work is properly
attributed. For permission for commercial use of this work, please see paragraphs 4.2 and 5 of our Terms.
© 2022 The Author(s). This work is published and licensed by Dove Medical Press Limited. The
full terms of this license are available at https://www.dovepress.com/terms
and incorporate the Creative Commons Attribution
- Non Commercial (unported, 3.0) License.
By accessing the work you hereby accept the Terms. Non-commercial uses of the work are permitted
without any further permission from Dove Medical Press Limited, provided the work is properly
attributed. For permission for commercial use of this work, please see paragraphs 4.2 and 5 of our Terms.