Back to Journals » Clinical Ophthalmology » Volume 17
Dynamic Infrared Imaging of Vitreous Floaters
Authors Marquez MA ![]() , Nadelson A, Magraner M, Haddock LJ, Fortun JA
, Nadelson A, Magraner M, Haddock LJ, Fortun JA
Received 13 January 2023
Accepted for publication 10 March 2023
Published 17 April 2023 Volume 2023:17 Pages 1169—1177
DOI https://doi.org/10.2147/OPTH.S399684
Checked for plagiarism Yes
Review by Single anonymous peer review
Peer reviewer comments 2
Editor who approved publication: Dr Scott Fraser
Supplementary video 1 of "Dynamic infrared imaging of vitreous floaters" [ID 399684].
Views: 1128
Marilyn A Marquez, Allie Nadelson, Maria Magraner, Luis J Haddock, Jorge A Fortun
Bascom Palmer Eye Institute, Miller School of Medicine, University of Miami, Miami, FL, USA
Correspondence: Jorge A Fortun, Email [email protected]
Background and Objective: To evaluate the use of dynamic infrared (IR) imaging as a tool for the objective evaluation of symptomatic vitreous floaters and to correlate it with the patient symptomatology.
Study Design/Materials and Methods: Retrospective study that examined 66 eyes of 44 patients with symptomatic and asymptomatic vitreous opacities. Patients were imaged using the Heidelberg Spectralis dynamic infrared (IR) image in video mode to record the vitreous movements and shadow artifacts within 30 degrees of the center of the macula. Patients were also asked how symptomatic their vitreous floaters were from absent to severe. After reviewing IR videos and OCT, a grading system was created to evaluate the floaters and a masked reader was asked to evaluate the videos and OCT based on the grading system created.
Results: A total of 66 eyes were identified and examined with the IR videos, 50 were symptomatic, and 16 were asymptomatic. After masked review and analysis of the IR videos, there were 4 characteristics that correlated with the patient’s symptoms: size, location, movement, and density of obscuration of the OCT B Scan by the vitreous opacity. A table with grading of these characteristics was created to analyze how symptomatic patients were. A masked grader was asked to grade the videos and OCT using the grading system created. A positive correlation was found between the masked grader and the symptoms of patients. (0.70039; p < 0.00001).
Conclusion: Dynamic IR video capture of vitreous opacities is a new imaging technique that can qualitatively assess vitreous opacities in a way that correlates to a patient’s symptoms. This imaging modality can provide a qualitative assessment of the patient’s severity of symptoms based on the location, density, and movement of the visualized vitreous opacities in the imaged video.
Keywords: floaters, infrared imaging, vitreous opacities, vitreous gel, myodesopsias
Introduction
The vitreous gel is a hydrated extracellular matrix comprised primarily of water, collagens, and hyaluronan organized into a homogenously transparent gel.1 Gel liquefaction results from molecular alterations that lead to dissociation of collagen from hyaluronan and aggregation of collagen fibrils forming fibers that cause increased light scattering and hence symptomatic floaters. With aging, the combination of gel liquefaction and weakened vitreoretinal adhesions results in posterior vitreous detachment. The posterior cortical vitreous that has separated has a higher density of collagen fibrils that results in increased light scattering;1 typically, patients with symptomatic floaters present after the onset of a posterior vitreous detachment. Historically, floaters have not been considered a significant problem meriting therapeutic intervention, primarily due to limited therapeutic options and because the diagnosis has been based on subjective patient self-evaluation.2 However, advances in surgical techniques and instruments for pars plana vitrectomy have opened a therapeutic option for these patients3, and recent studies using different imaging tools to document vitreous opacities and quantitatively show their visual significance have been published. Schwartz et al4 recognized a characteristic shadowing artifact on spectral-domain optical coherence tomography that was caused by prominent vitreous opacities, which they termed to a “floater scotoma”. Mamou et al5 used quantitative ultrasound (QUS) to evaluate vitreous opacities and showed that their technique can be used to measure vitreous echo densities and that their measured parameters correlate positively with the degradation in contrast sensitivity and in the patient dissatisfaction index quantified by VFQ measures. Recently Garcia-Aguirre et al6 described a technique to visualize the floaters using a dynamic ultra-widefield infrared confocal scanning laser that allows visualization of floaters in a wide area.
For acquisition of the dynamic IR video in this study, confocal laser scanning was used, which uses a laser beam that focuses on the retina. The laser beam is deflected periodically by means of oscillating mirrors to sequentially scan a two-dimensional section of the retina. This laser source can have different wavelengths, to produce infrared reflectance at the wavelength of 820 nm. The intensity of the reflected light or of the emitted fluorescent light at each point is measured with a light sensitive detector.7 This way one can visualize the floaters with the infrared light because of this obscuration caused by the vitreous density, as denser the vitreous, more easily these floaters will be visualized in the infrared movie as well as its movement with any saccade. With this technique, the examiner can visualize what the patient complains about.
This study’s purpose was to evaluate dynamic IR imaging using the Heidelberg Spectralis IR video mode as a tool for evaluating symptomatic vitreous floaters. In addition, images were reviewed by a masked reader to determine the utility of this imaging modality to objectively confirm patient’s symptomatology.
Patients/Materials and Methods
This retrospective study included 66 eyes of 44 patients with both symptomatic vitreous opacities and asymptomatic vitreous opacities. Approval for this study was obtained by the Institutional Review Board of the University of Miami School of Medicine, and procedures were conducted in accordance with the Declaration of Helsinki. Degree of symptoms (no symptoms, mild, moderate, severe) were recorded based on how much time per day they noticed the floaters and how much it affected their life based on VFQ-25 questionnaire. Patients were imaged using the Heidelberg Spectralis device IR image mode to record 30 degrees infrared (IR) videos of the vitreous movements centered around the macula and peri macular area. The patients fixated on a light that was moved to a lateral area to elicit saccadic eye movements, while the IR video was recorded to make the imaging of the vitreous opacities a dynamic process that simulates real life movement of the vitreous opacities. The recorded videos were reviewed by an unmasked reader to identify characteristics of the vitreous opacities, such as density, shadowing or location that correlated with visual significance. Opacities were graded according to a scale that was devised by the authors for the purpose of this study, considering the density of the opacities, which were labeled as “diffuse” when some details of the retina anatomy were visible through the opacity and “dense” when the details of the retina were not visible through the opacity, and the involvement of the macular area in primary gaze or after saccadic movements (Table 1, Figures 1 and 2, Supplementary Videos 1 and 2), vitreous opacities were also graded based on presence or absence of shadow artifact seen in the OCT images (Table 2, Figure 3). In addition, the videos were reviewed by a masked reader who determined if the patient was symptomatic or not depending on the identified characteristics summarized in Table 1 and Table 2.
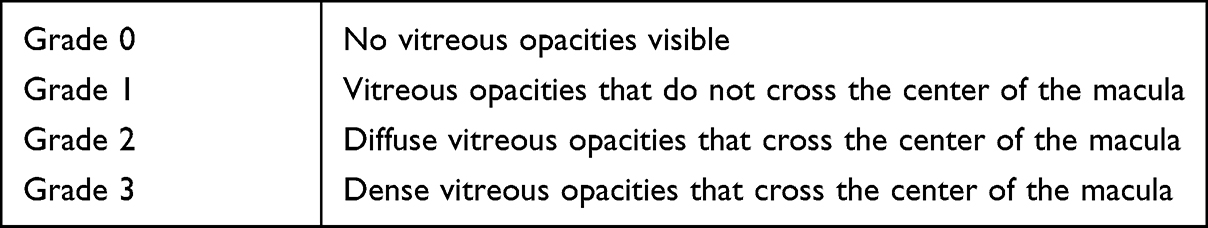 |
Table 1 Vitreous Opacities Grading Based on Infrared Imaging |
 |
Table 2 Vitreous Opacities Grading Based on Optical Coherence Tomography (OCT) Imaging |
 |
Figure 1 Infrared fundus picture of a symptomatic patient, the obscuration casted by the vitreous opacities can be visualized, the symptomatic patient had higher obscuration and more central location of the opacities. |
 |
Figure 2 Infrared fundus picture of an asymptomatic patient with the characteristic less dense vitreous opacity located peripheral to the macula, in this case is over the optic nerve. |
 |
Figure 3 OCT B Scan of a symptomatic patient. The vitreous opacities seen in the IR image on the right of the figure cast a shadow on the scans of the retina. |
Data was recorded into an excel spreadsheet (Microsoft Office). Statistical analysis was performed using web page social science statistics (https://www.socscistatistics.com). For qualitative data, we report descriptive statistics. For quantitative data, a non-parametric correlation (Spearman’s test) was performed. Statistical significance was defined as p < 0.05.
Results
This study included 66 eyes of 44 patients with visible vitreous opacities on examination, IR image and OCT (Table 3). Fifty eyes were symptomatic, and 16 eyes were asymptomatic. Of the symptomatic patients, 50 eyes of 36 patients were imaged for symptomatic vitreous opacities, of which 18 were males and 18 were females. The average age was 66.6 y (range 49–83). Of these, 34 eyes were pseudophakic, 13 eyes had tr NS cataract, 3 eyes had +1 NS cataract. Of the asymptomatic patients, 16 eyes of 11 patients were imaged for asymptomatic vitreous opacities, of which 7 were females and 4 were males. The average age was 71.45 yrs (range: 61–80). Of these, 8 eyes were pseudophakic, 3 eyes had trace NS cataract and 5 eyes had 2+ NS cataract.
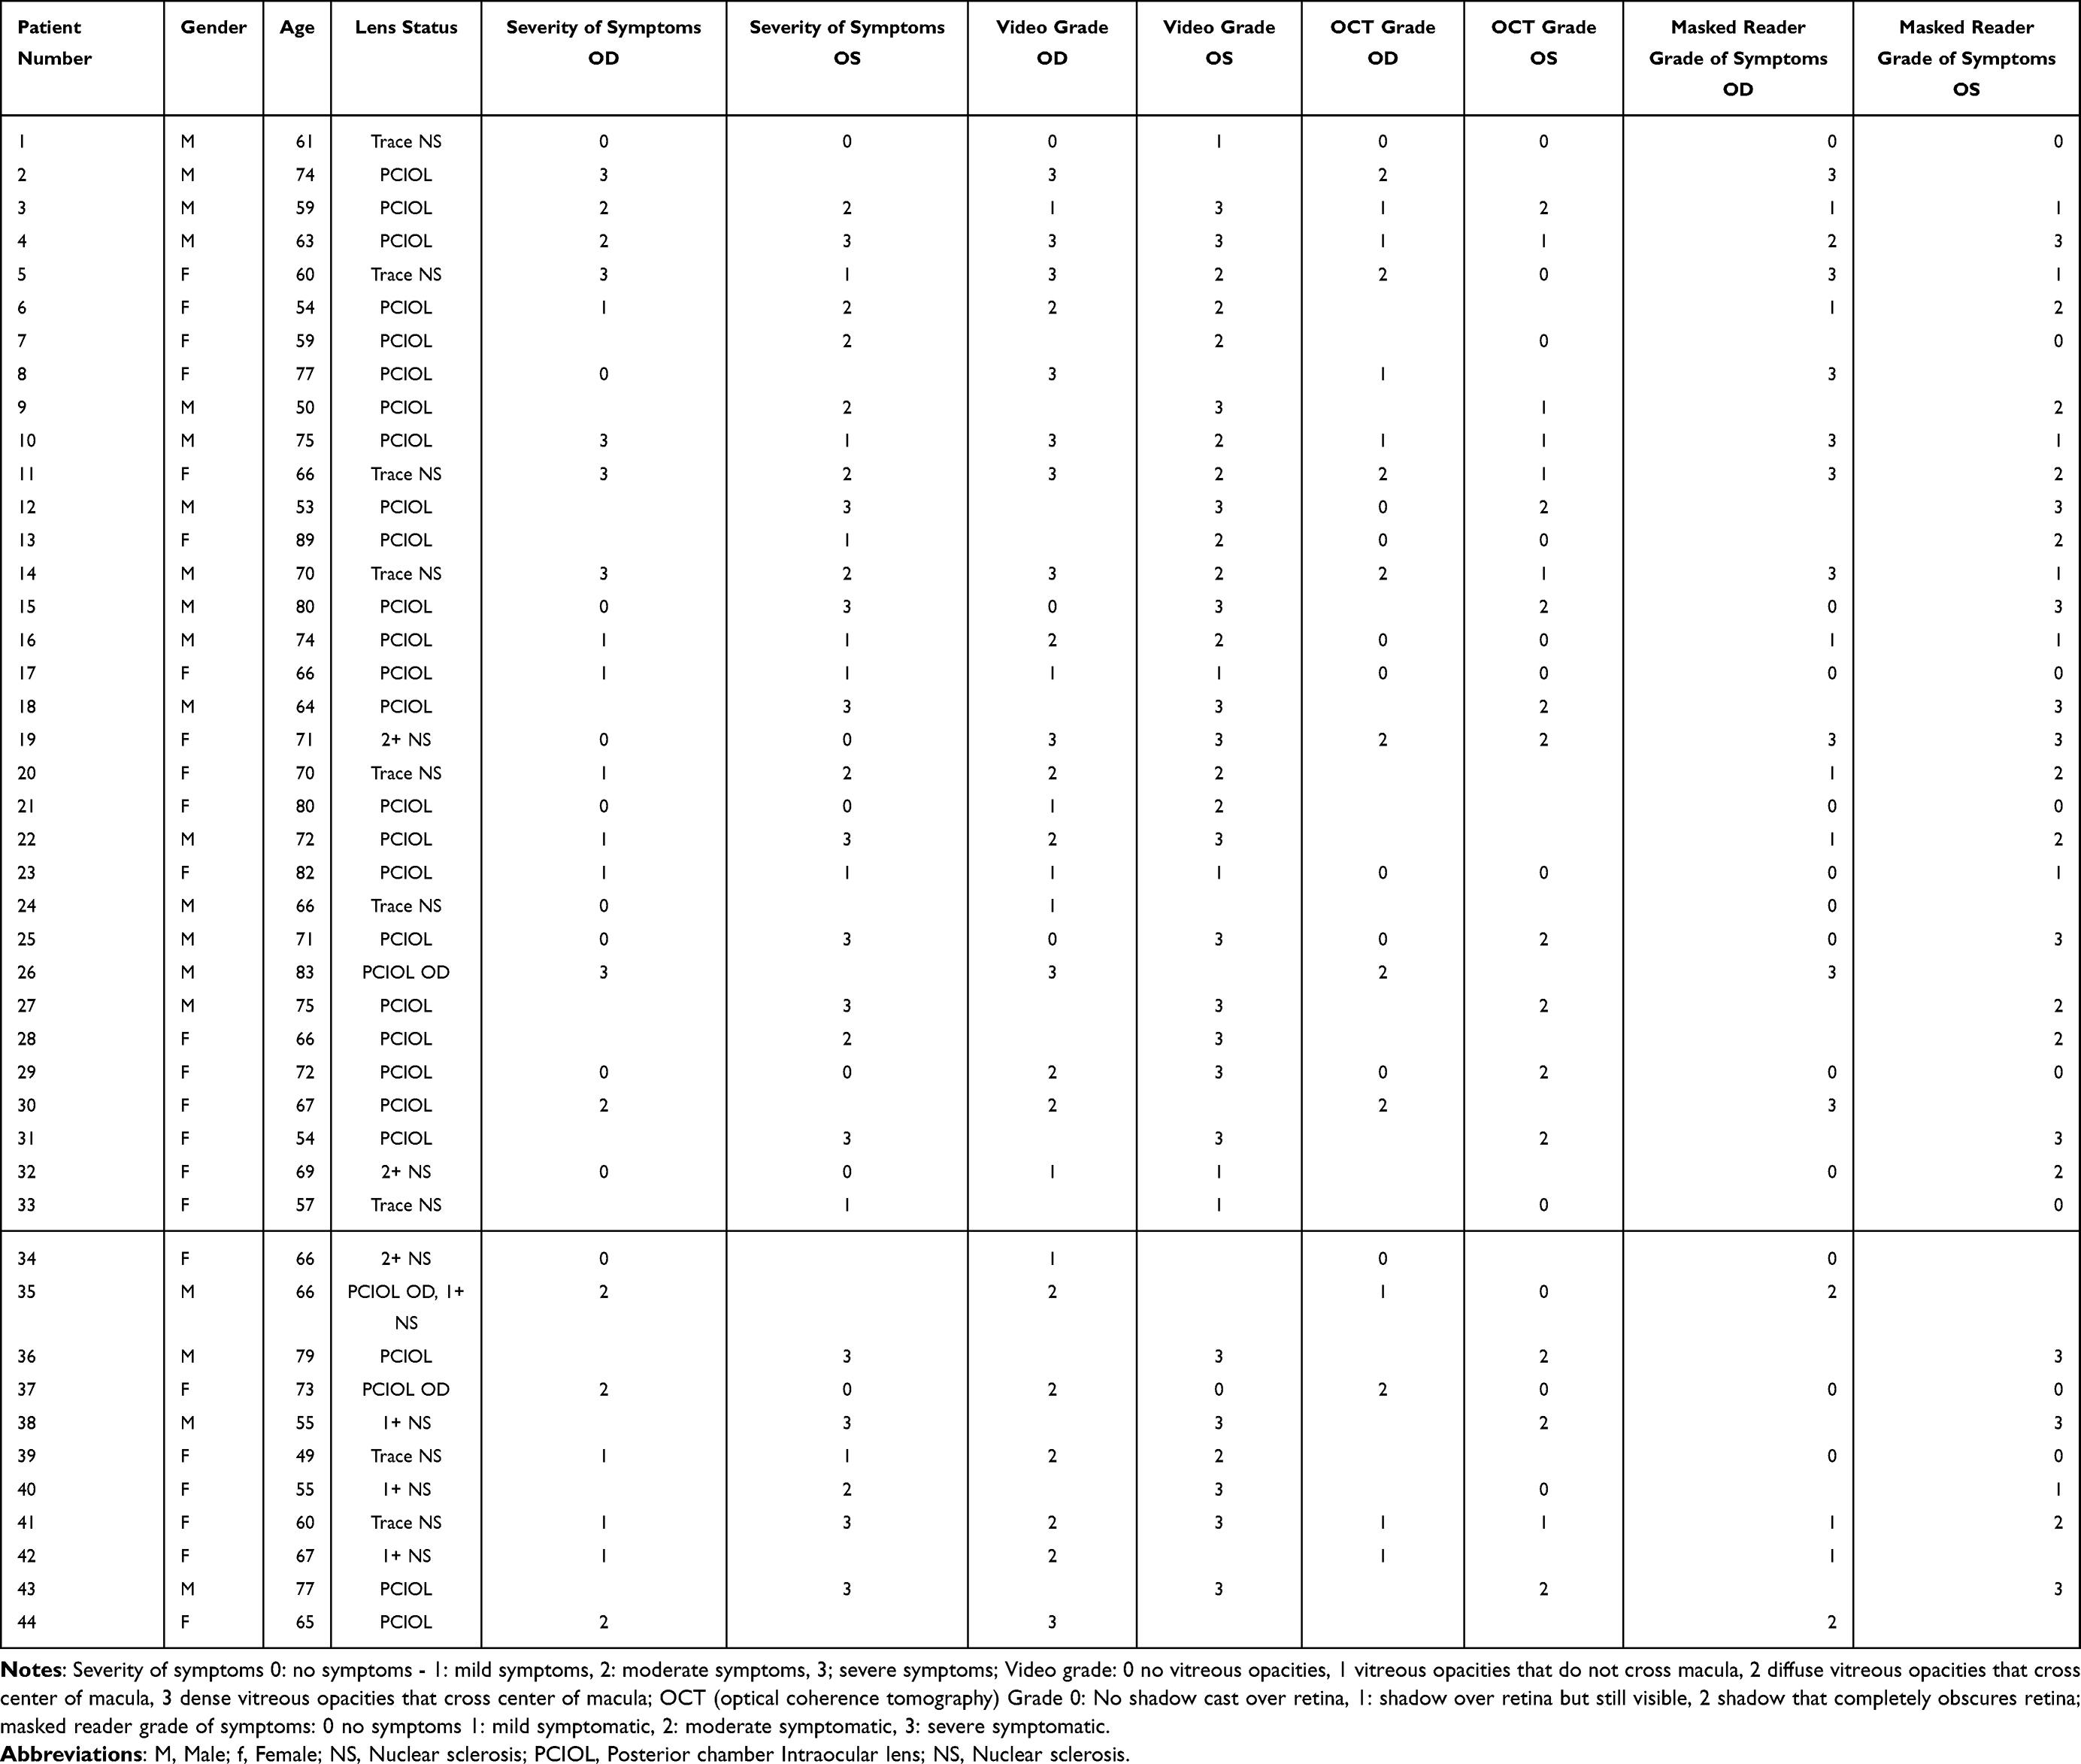 |
Table 3 Patient’s Data |
After review and analysis of the infrared videos by the unmasked reader, there were 4 characteristics that correlated with those patient’s that had symptoms: size – the larger the vitreous opacity, the more symptomatic; location – vitreous opacities over the center of the macula with straight fixation were more symptomatic; movement – transient opacity that covered the center of the macula with refixation after saccadic movements were more symptomatic; and density of vitreous opacity, which can be noticed by obscuration of the retina in the videos and in the Bscan images of the OCT. The vitreous opacities in the asymptomatic patients were found to be located over the optic nerve (ON) in 10 eyes (62.5%) and peripheral to the superior and inferior branch in 6 eyes (37.5%). Based on the characteristics mentioned before, a grading system was defined and Table 1 and Table 2 were created.
Spearman’s test revealed a positive significant correlation between symptoms and IR video grading R: 0.583 (p < .00001) (Figure 4) and between the symptoms and OCT grading R = 0.625 (p < .00001) (Figure 5) (Table 4).
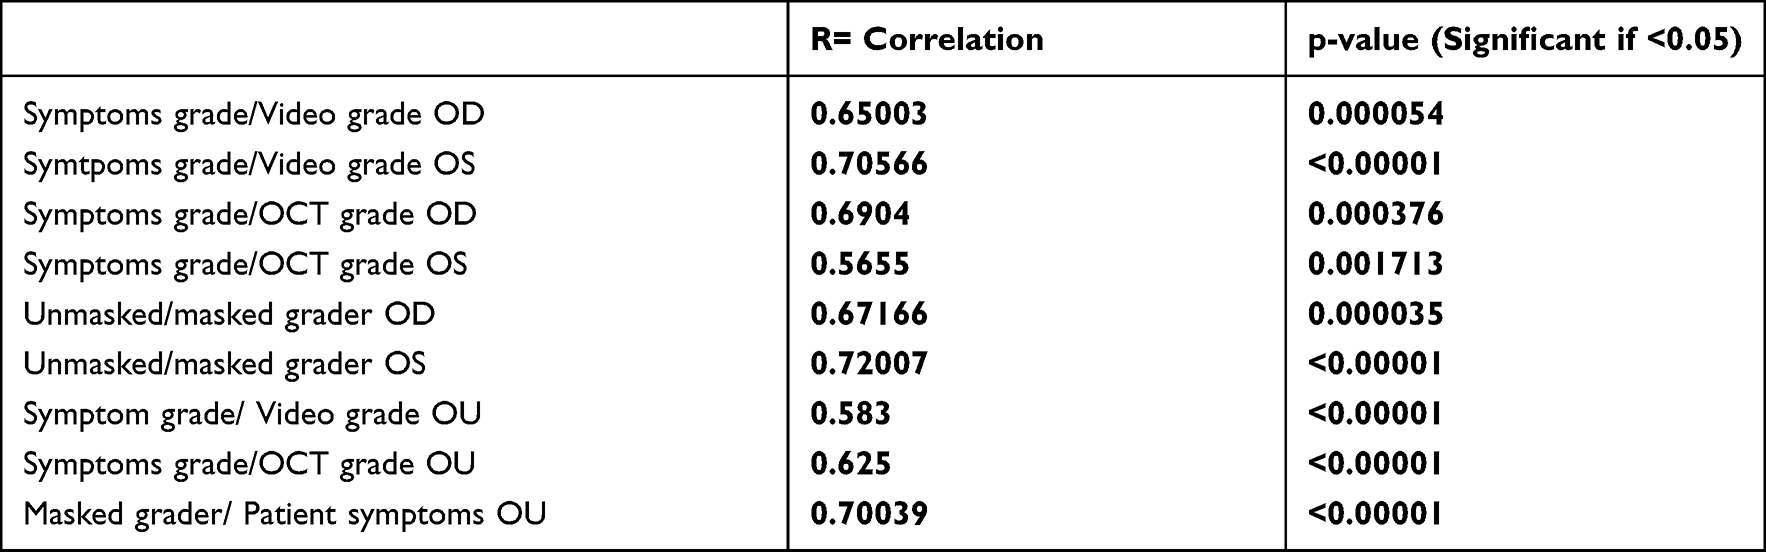 |
Table 4 Correlation and p-value of Data |
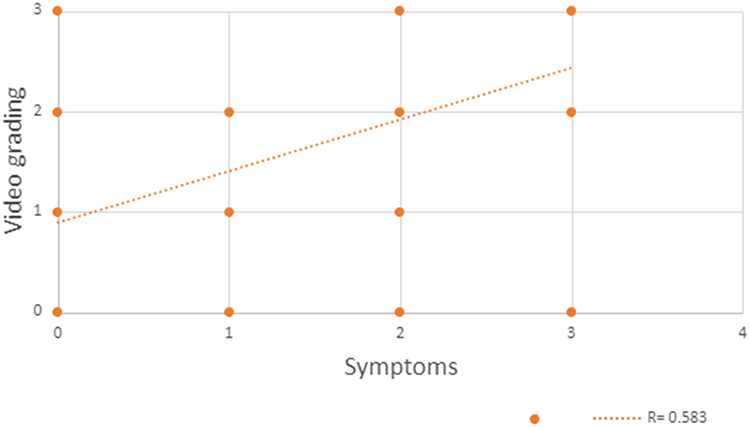 |
Figure 4 Spearman’s correlation revealed a significative positive correlation between the IR video grading and symptoms. Correlation coefficient: 0.583 (p=<.00001). |
To evaluate the grading system created, a masked reader to the patient symptoms was given the grading system (Table 1 and Table 2) and was asked to grade the videos and OCT. At the time of grading based in these characteristics, the masked reader had a positive Spearman correlation with patient symptoms of 0.70039 (p < 0.00001) (Figure 6).
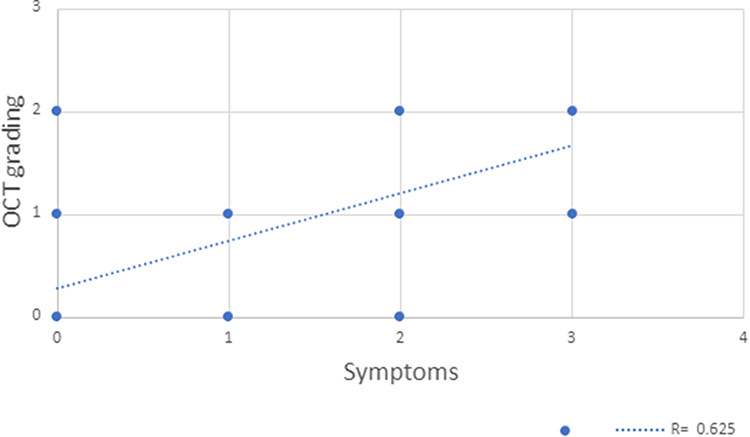 |
Figure 5 Spearman’s correlation revealed a significative positive correlation between OCT grading and symptoms. Correlation coefficient: 0.625 (p=<.00001). |
 |
Figure 6 Spearman’s correlation revealed a significative positive correlation between masked grader and symptoms. Correlation coefficient: 0.700 (p=<.00001). |
Figures 1 and 3 and Supplementary Video 1 show an example of a symptomatic patient and Figure 2 and Supplementary Video 2 shows an example of an asymptomatic patient. As shown in the images/video of the symptomatic patient, the obscuration casted by the vitreous opacities can be visualized, the symptomatic patient had higher obscuration and more central location of the opacities (Supplementary Video 1), which correlates with the areas of obscuration seen in the OCT Bscan (Figure 3), the asymptomatic patients had less dense vitreous opacities or were located over the ON, and did not cross the macular area with saccadic movements (Supplementary Video 2).
As per how symptomatic the patients were, 50 eyes of the 36 symptomatic patients said they noticed the floaters all the time (severe), 15 (30%) said most of the time (moderate), 17 (33%) said intermittently (mild). And 16 eyes did not notice floaters.
Discussion
Dynamic IR video capture is a new imaging technique able to qualitatively assess vitreous opacities. The technique is dynamic and is performed with the patient’s eye movements, allowing us to analyze the vitreous opacities in a way that could be compared to the shadowing effect that these opacities have during real life.
In this study, we were able to identify characteristics that made these opacities more likely to be symptomatic. Symptomatic patients were more likely to have a larger opacity, a centrally located opacity, an opacity that crossed the fovea with saccades, or an opacity that created shadowing artifacts on the OCT. Using these characteristics, a masked reviewer was able to identify symptomatic patients with a positive Spearman correlation of 0.70039 (p < 0.00001) (Figure 6).
Several attempts were made to visualize/classify vitreous floaters using IR image and OCT. In a study performed by Garcia-Aguirre et al,6 vitreous floaters were analyzed using a wide field IRcSLO that allowed visualization of floaters in a wide view and a grading system was devised by the authors considering the density of the opacities and the involvement of the macular area after upwards saccadic movement. Vandorselaer et al8 used SLO to objectively observe the position, the size, and the motility of the vitreous floaters before and after YAG laser vitreolysis. Sun et al9 evaluated the floater areas in IR imaging to evaluate the distribution and areas of the floaters by quantifying the grey areas using Image J (version 1.43u, National Institutes of Health, Bethesda, MD, USA). Another study by Keane et al10 used OCT to analyze vitreous haze, a grading system was created and comparison between vitreous and RPE intensity was used for quantitative assessment of vitreous haze.
In our study, we analyzed vitreous floaters using IR video imaging from Heidelberg Spectralis 30 degrees. The video captures 30 degrees which, in primary gaze position. gives a clear view of the macular area and allows visualization of vitreous floaters before and after saccadic movements in all directions, this way the grader can clearly detect if the floater crosses the macula, this is an important aspect in our study since after review of the different videos, a constant characteristic in symptomatic patients was that the floaters were located in the macular area in primary gaze or after saccadic movements and versus asymptomatic patients were the floaters were located peripheral to the vascular branches or over the ON. What also helped to identify the vitreous density was the use of the B scan segmentations of the OCT, which correlates with a shadowing effect over the retinal layers in the specific points where the vitreous is denser.
By using a masked reader, we were able to show the clinical utility and validity of using this test to correlate it with the patient’s symptoms. This imaging modality provided a qualitative assessment of the patient’s severity of symptoms based on the location and density of the visualized vitreous opacities. The technique is simple to perform and the videos easy to evaluate.
The limitation of this study is the retrospective nature, the small sample size and the subjective report of symptoms by the patients. A standardized instrument such as VFQ-25 questionnaire or AST manifold platform (Adaptive sensory technology) which measures not only vision but also contrast sensitivity could be more appropriate.
Future directions include quantification based on subtraction maps on the size of the vitreous floaters and correlation between patient’s symptomatology based on VFQ or AST platform, using these data to quantify grade of disturbance could help to select patients that could improve with vitrectomy.
Patient Consent
Written informed consent for publication of their details was obtained from the patients.
Disclosure
The authors report no conflicts of interest in this work.
References
1. Milston R, Madigan MC, Sebag J. Vitreous floaters: etiology, diagnostics, and management. Surv Ophthalmol. 2016;61(2):211–227. doi:10.1016/j.survophthal.2015.11.008
2. Sebag J. Floaters and the quality of life. Am J Ophthalmol. 2011;152(1):3–4 e1. doi:10.1016/j.ajo.2011.02.015
3. Dysager DD, Koren SF, Grauslund J, Wied J, Subhi Y. Efficacy and safety of pars plana vitrectomy for primary symptomatic floaters: a systematic review with meta-analyses. Ophthalmol Ther. 2022;11(6):2225–2242. doi:10.1007/s40123-022-00578-9
4. Schwartz SG, Flynn HW
5. Mamou J, Wa CA, Yee KM, et al. Ultrasound-based quantification of vitreous floaters correlates with contrast sensitivity and quality of life. Invest Ophthalmol Vis Sci. 2015;56(3):1611–1617. doi:10.1167/iovs.14-15414
6. Garcia-Aguirre G, Henaine-Berra A, Salcedo-Villanueva G. Visualization and grading of vitreous floaters using dynamic ultra-widefield infrared confocal scanning laser ophthalmoscopy: a pilot study. J Clin Med. 2022;11(19):5502. doi:10.3390/jcm11195502
7. Aumann S, Donner S, Fischer J, Muller F. Optical Coherence Tomography (OCT): principle and technical realization. In: Bille JF, editor. High Resolution Imaging in Microscopy and Ophthalmology: New Frontiers in Biomedical Optics. Springer; 2019:59–85.
8. Vandorselaer T, Van De Velde F, Tassignon MJ. Eligibility criteria for Nd-YAG laser treatment of highly symptomatic vitreous floaters. Bull Soc Belge Ophtalmol. 2001;280:15–19.
9. Sun X, Tian J, Wang J, Zhang J, Wang Y, Yuan G. Nd:YAG laser vitreolysis for symptomatic vitreous floaters: application of infrared fundus photography in assessing the treatment efficacy. J Ophthalmol. 2019;2019:8956952. doi:10.1155/2019/8956952
10. Keane PA, Karampelas M, Sim DA, et al. Objective measurement of vitreous inflammation using optical coherence tomography. Ophthalmology. 2014;121(9):1706–1714. doi:10.1016/j.ophtha.2014.03.006
 © 2023 The Author(s). This work is published and licensed by Dove Medical Press Limited. The
full terms of this license are available at https://www.dovepress.com/terms
and incorporate the Creative Commons Attribution
- Non Commercial (unported, 3.0) License.
By accessing the work you hereby accept the Terms. Non-commercial uses of the work are permitted
without any further permission from Dove Medical Press Limited, provided the work is properly
attributed. For permission for commercial use of this work, please see paragraphs 4.2 and 5 of our Terms.
© 2023 The Author(s). This work is published and licensed by Dove Medical Press Limited. The
full terms of this license are available at https://www.dovepress.com/terms
and incorporate the Creative Commons Attribution
- Non Commercial (unported, 3.0) License.
By accessing the work you hereby accept the Terms. Non-commercial uses of the work are permitted
without any further permission from Dove Medical Press Limited, provided the work is properly
attributed. For permission for commercial use of this work, please see paragraphs 4.2 and 5 of our Terms.