Back to Journals » Journal of Inflammation Research » Volume 15
Dynamic Changes in Gut Microbiome of Ulcerative Colitis: Initial Study from Animal Model
Authors Gu W ![]() , Zhang L
, Zhang L ![]() , Han T, Huang H, Chen J
, Han T, Huang H, Chen J
Received 17 January 2022
Accepted for publication 13 April 2022
Published 24 April 2022 Volume 2022:15 Pages 2631—2647
DOI https://doi.org/10.2147/JIR.S358807
Checked for plagiarism Yes
Review by Single anonymous peer review
Peer reviewer comments 3
Editor who approved publication: Dr Monika Sharma
Wenchao Gu,1,* Liangkun Zhang,1,* Tao Han,2 Hailiang Huang,2 Jian Chen1
1Department of Traditional Chinese Medicine, Central Hospital Affiliated to ShanDong First Medical University (Jinan Central Hospital), Jinan, 250000, People’s Republic of China; 2Shandong University of Traditional Chinese Medicine, Jinan, 250355, People’s Republic of China
*These authors contributed equally to this work
Correspondence: Jian Chen, Central Hospital Affiliated to ShanDong First Medical University (Jinan Central Hospital), No. 105 Jiefang Road, Lixia District, Jinan, People’s Republic of China, Tel +86 133 7058 7597, Email [email protected] Hailiang Huang, Shandong University of Traditional Chinese Medicine, No. 4655 Daxue Road, Changqing District, Jinan, People’s Republic of China, Tel +86 15628987355, Email [email protected]
Background: An animal model of DSS-induced UC has been widely used in basic research, and the dysbiosis of gut microbiome is one of the important pathogenetic mechanisms of DSS-induced UC, but its dynamic changes and correlation with inflammatory factors are not clear yet.
Methods: Clinical signs and tissue damage degree of C57BL/6 ulcerative colitis mice model induced by different concentrations of DSS were compared with that of normal mice, and finally the optimal concentration of DSS was determined. Then we analyzed the sequencing results of gut microbiome and inflammatory factors to determine the dynamic patterns of gut microbiome and their correlation with the inflammatory factors.
Results: DSS at 2.5% and 3.0% concentration could cause intestinal injury and induce colitis. However, 3.0% DSS resulted in higher mortality. In addition, there were dynamic changes of gut microbiome in DSS-induced UC model: the relative abundance of intestinal flora increased first and then decreased in Bacteroides, Parabacteroides, Romboutsia, Clostridium_sensu_stricto_1, Lachnospiraceae_NK4A136_group, norank_f_norank_o_Clostridia_UCG-014, Parasutterella, and decreased first and then increased in Lactobacillus, Muribaculum, norank_f_Muribaculaceae, in addition, Bifidobacterium, Coriobacteriaceae_UCG-002 and Enterorhabdus did not change in the first 14 days but increased significantly on day 21. Moreover, inflammatory cytokines were closely associated with the imbalance of the intestinal microbiota in mice with UC: most pathogenic bacteria in the intestinal tract of the UC animal model were positively correlated with pro-inflammatory factors and negatively correlated with anti-inflammatory factors, while beneficial bacteria were the opposite.
Conclusion: Intestinal microecology plays an important role in DSS-induced UC model, and the relative abundance of gut microbiome changes dynamically in the occurrence and development of ulcerative colitis.
Keywords: ulcerative colitis, DSS, gut microbiome, dynamic changes, 16S rDNA
Introduction
Ulcerative colitis (UC) is a chronic, nonspecific recurrent disease characterized by persistent, diffuse inflammation of the mucosa and the lower layer of the mucosa, with diarrhea, intermittent stool blood or pus as the main clinical manifestations, accompanied by abdominal pain, fatigue, loss of appetite, fever and other systemic symptoms.1–4 The course of the disease is long and does not heal on its own. Patients with UC often have repeated seizures and many require life-long treatment, which seriously reduces the quality of life. Thus, UC has been listed by the World Health Organization as a modern difficult disease.5–7 Because of diet changes and increased stress, the number of UC cases is rapidly rising, and the total prevalence is approximately 116 per 100,000 in mainland China,8 meanwhile, the morbidity is increasing. Studies have also shown that UC can significantly increase the risk of developing colorectal cancer, which is disconcerting.9–11 The risk increases with the length of the patient’s course of UC. In patients with an UC disease course of 10, 20, or 30 years, the percentage of patients with colon cancer is 1.6%, 8.3%, and 18.4%, respectively, and this is currently the main public health challenge.12 Some researchers believe that UC is a complex systemic disease that is closely related to a variety of pathogenic factors, such as instability in the gut flora,13,14 immune imbalances,15,16 genetic susceptibility,17,18 and poor lifestyle. However, the etiology and pathogenesis of the disease have not been completely clarified to date. Therefore, more basic research studies are needed to answer the abovementioned questions.
The selection and establishment of a mature, stable and reliable animal model is the premise and basis for various basic research studies investigating UC-related pathogenesis and pharmacodynamics and in preclinical research. At present, there are numerous UC modeling methods that can be summarized as chemical, immunological, genetic modification and compounding.19 The principles for different modeling methods vary. No animal model can completely encompass all the causes and clinical manifestations of human UC, and different models have more research significance and attribution.
Currently, because immunological, gene modification and other modeling methods are highly technical, difficult to manipulate, expensive, and have low adaptability and other issues, many models are only used in specific studies, but are not widely used in basic research. Chemical induction modeling has become the preferred modeling method for researchers because of its low cost, simplicity, stability and high level of controllability. The chemical induction method mainly includes dextran sodium sulfate (DSS) model, 2,4,6-trinitrobenzene sulfonic acid (TNBS) model, oxazolone (OXZ) model, acetic acid model, horn fork vegetable gum model, and dinitrochlorobenzene (DNCB) model. The TNBS20,21 and acetic acid models22 more closely resemble the clinical symptoms of human Crohn’s disease (CD) but do not adequately model clinical symptoms of human UC. The DNCB model is self-healing and uses guinea pigs and domestic rabbits with relatively high feeding costs.23 The fork gum, OXZ and DSS models can better demonstrate pathological symptoms of human UC, and because of low cost, simplicity, stability, and reliability.24–27 Among them, the DSS model has become the preferred modeling method to study UC in China and abroad due to pathological and clinical manifestations that are very similar to human UC.28–32
The DSS model was originally created and reported by a Japanese scholar named Okayasu and other researchers.33 DSS enters the intestine to act on the colon epithelium, reduces the amount of mucoprotein, destroys the structure of tightly connected protein, destroys the microecological balance of intestine, and alters the composition of gut microbiome.34,35 The model can be widely used to study UC pathogenesis and related drug efficacy, including studies about UC innate immunity, multi-signaling pathway interactions and long-term enteritis-induced colon cancer related mechanisms. The model can also be used to study gut microbiome in UC research.
After combing and analyzing the existing literature, we found that a large number of studies induced animal models of UC with 2.5% or higher concentration of DSS and carried out relevant basic studies on gut microbiome and immune inflammation.36–39 Other studies have found that the relative abundance of some bacteria (Bacteroides, norank_f_Muribaculaceae, Turicibacter, Romboutsia, Clostridium_sensu_stricto_1) in the intestinal tract of DSS-induced UC model changed significantly.40–43 In addition, the altered bacteria could trigger changes in levels of relevant inflammatory factors.44–47 However, there have been no reports on the dynamic changes in intestinal flora when using the DSS model or effects of different concentrations of DSS on intestinal flora and immune inflammation. Most studies have not considered this factor, which may have led to variable experimental results. Previous experimental study of the research group found that a high concentration of DSS could significantly increase the mortality of mice. Therefore, in this experiment, we used 2.5% and 3.0% DSS to induce UC model to explore the dynamic role of intestinal microbiome by measuring dynamic changes in gut microbiome and levels of inflammatory cytokines in serum and local tissue in a murine model of UC induced by different concentrations of DSS with the goal of improving our understanding of the etiology and pathogenesis of UC.
Materials and Methods
Reagents and Instruments
The following reagents and instruments were used: DSS (molecular weight = 36 kDa to 50 kDa; MP Biomedical, California, USA) and enzyme-linked immunosorbent assay (ELISA) kits: interleukin-2 (IL-2), interleukin-4 (IL-4), interleukin-6 (IL-6), interleukin-10 (IL-10), interleukin-22 (IL-22), interferon-gamma (IFN-γ), tumor necrosis factor-alpha (TNF-α), 5-hydroxytryptamine (5-HT) (Neobioscience Technology Company, Shanghai, China).
Animal Grouping and Intervention
Twenty-four pathogen-free healthy male C57BL/6N mice (6 weeks old, 20±2 g) were purchased from Beijing Weitong Lihua Experimental Animal Technology Co., Ltd (license number: SCXK (Beijing) 2016-0006) and were maintained at the Animal Experimental Center of Shandong University of Traditional Chinese Medicine (license number: SYXK (Lu) 2017-0022, Shandong, China). All mice were maintained under specific pathogen-free conditions where they received standard food and sterilized water ad libitum at a constant temperature (23±1.5°C) and humidity (60±10%) with a 12 h/12 h light/dark cycle. The mice were allowed to acclimatize for one week before the study began. Animals were randomized by weight (prior to challenge) into three groups: control group, model 2.5 group and model 3.0 group; each group contained 10 mice. Mice in the model 2.5 and model 3.0 groups received 2.5% and 3.0% DSS, respectively, in their drinking water for seven days, while control mice received regular water only (Figure 1). Animal care and all experiments were performed according to procedures approved by the University Animal Care and Use Committee of Shandong University of Traditional Chinese Medicine (SDUTCM20210311003). All protocols were performed in strict accordance with the Guidance Suggestions for the Care and Use of Laboratory Animals, as formulated by the Ministry of Science and Technology of the People’s Republic of China, and all efforts were made to minimize animal suffering and reduce the number of animals used.
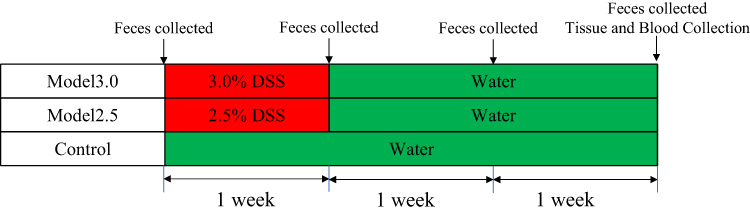 |
Figure 1 Experimental protocol of DSS-induced ulcerative colitis mice. |
Biological Data and Sample Collection
All mice were weighed daily from the first to the last day of the experiment, and their weights, general condition and deaths were recorded daily. Stool samples were collected and stored at −80°C on days 0, 7, 14, and 21 of the experiment for 16S sequencing, and body weight, fecal status, and hematochezia status were recorded. The disease activity index (DAI) scores were calculated according to the formula DAI=A+B+C, where A, B, and C are the body weight loss score, fecal status score, and hematochezia score in Table 1, respectively.
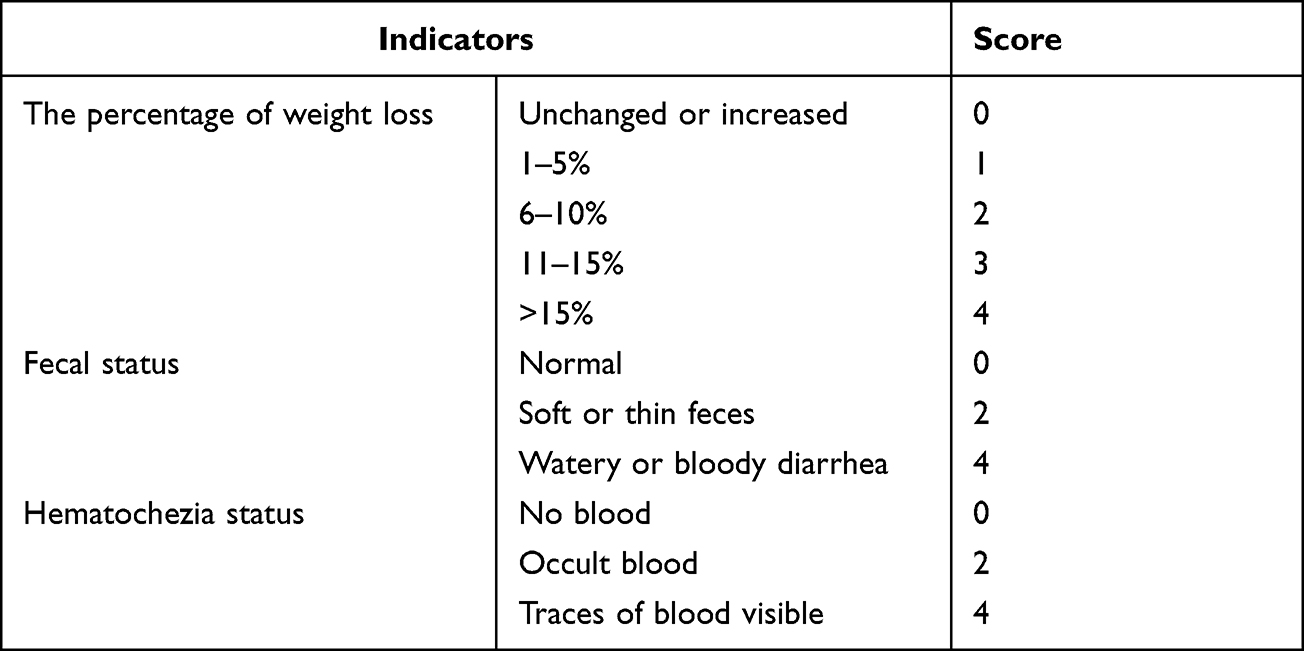 |
Table 1 Scoring Criteria of Disease Activity Index (DAI) in UC Mice |
After euthanasia, first, blood was collected by removing eyeballs and centrifuged at 3000 rpm for 15 min to obtain serum and stored at −80°C for the detection of inflammatory cytokines. Then, the spleen, liver, kidneys, and colon were dissected from mice and weighed, and colon length was measured. Finally, the colon was divided into segments representing the proximal, middle, and distal segments. Proximal and distal segments were fixed in a tube containing 4% paraformaldehyde solution for histological evaluation, and the middle colon was stored at −80°C for the detection of inflammatory cytokines.
Histological Evaluation
The proximal and distal sections of the colon were embedded in paraffin, cut into 5 µm sections and stained with hematoxylin and eosin (H&E) according to standard protocols. The sections were visualized under a microscope and photographed and viewed at a final magnification of 200× using Leica Application Suite/Leica DM5000B.
Histological scoring was performed based on four variables: inflammation cell infiltration, depth of lesions, destruction of crypts, and width of lesions. The total pathology score was expressed as the sum of the scores for all parameters. The pathological score was independently evaluated by two pathologists in a double-blind manner based on the colon histopathology scoring criteria in Table 2. Discrepant results were adjudicated by a third experienced pathologist.
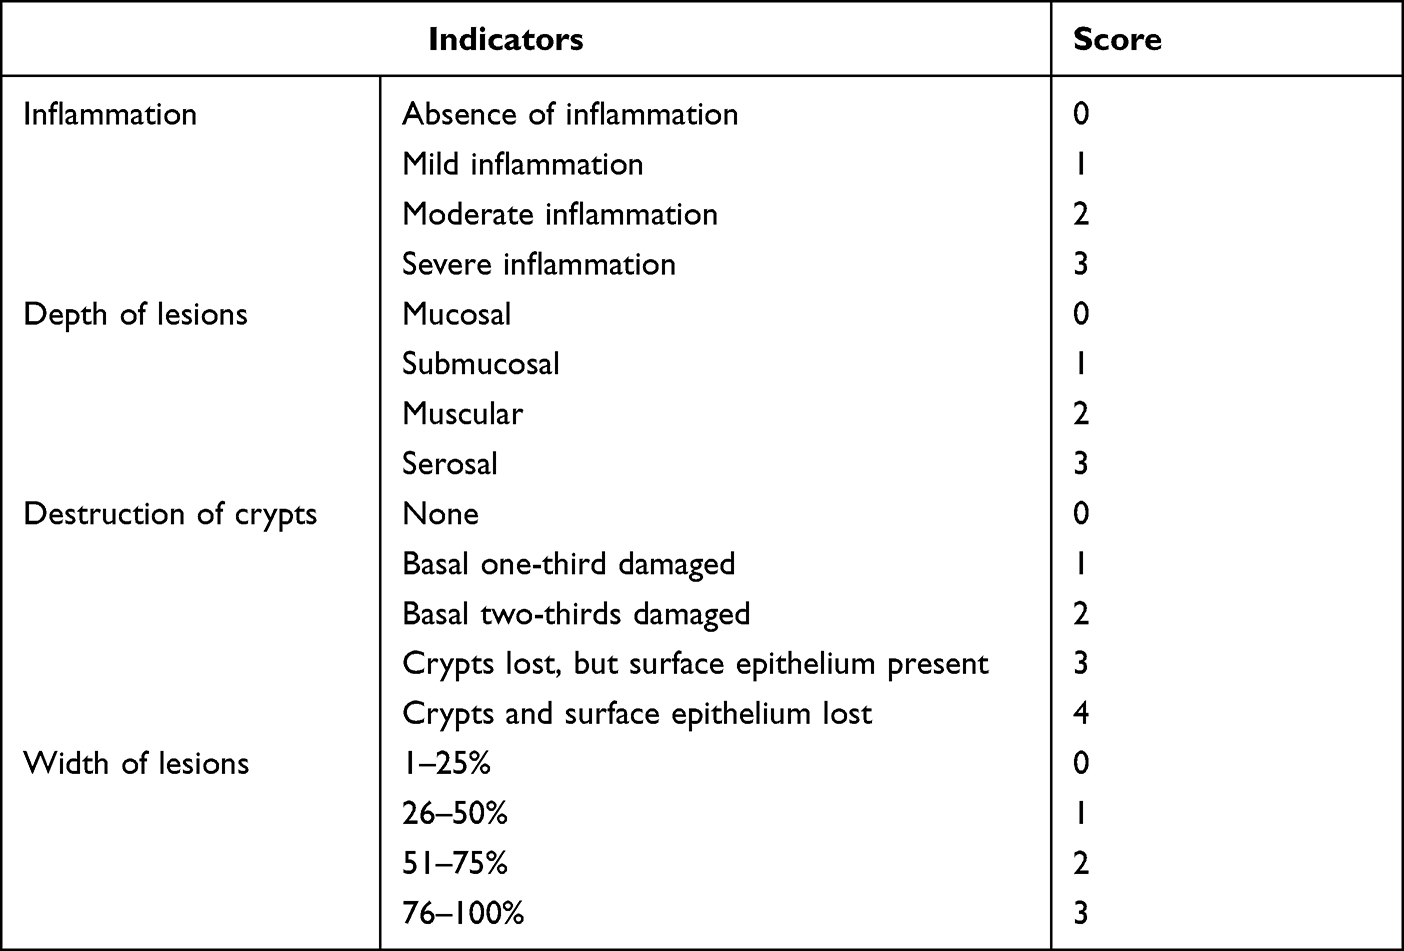 |
Table 2 Scoring Criteria of Histopathological in UC Mice |
Cytokine Expression Analyzed by ELISA
The levels of inflammatory cytokines IL-2, IL-4, IL-6, IL-10, IL-22, 5-HT in serum and IL-2, IL-4, IL-6, IL-10, and IL-22, 5-HT, TNF-α, IFN-γ in colon tissue homogenate were detected by commercial ELISA kits purchased at Jiangsu Jingmei Biological Technology Co. Ltd (Jiangsu, China). Absorbance was determined at 450 nm using an enzyme labeling instrument (Labsystems Multiskan, Finland). All experiments were performed according to manufacturer’s instructions.
Illumina MiSeq Pyrosequencing of Gut Microbiome
The standard procedures for gut microbiome detection in the literature48–51 were followed. Microbial DNA was extracted from fecal samples using the E.Z.N.A.® soil DNA Kit (Omega Biotek, Norcross, GA, USA) according to manufacturer’s protocol. The final DNA concentration and purification level were determined by a NanoDrop 2000 UV-vis spectrophotometer (Thermo Scientific, Wilmington, DE, USA), and DNA quality was checked by 1% agarose gel electrophoresis. The V3-V4 hypervariable regions of the bacterial 16S rRNA gene were amplified with primers 338F (5’-ACTCCTACGGGAGGCAGCAG-3’) and 806R (5’-GGACTACHVGGGTWTCTAAT-3’) by a thermocycler PCR system (GeneAmp 9700, ABI, USA). The PCRs were conducted using the following program: 3 min of denaturation at 95°C, 27 cycles of 30 seconds at 95°C, 30 seconds for annealing at 55°C, and 45 seconds for elongation at 72°C, and a final extension at 72°C for 10 min. PCRs were performed in triplicate in a 20 μL mixture containing 4 μL of 5×FastPfu buffer, 2 μL of 2.5 mM dNTPs, 0.8 μL of each primer (5 μM), 0.4 μL of FastPfu polymerase and 10 ng of template DNA. The resulting PCR products were extracted from a 2% agarose gel, further purified using the AxyPrep DNA Gel Extraction Kit (Axygen Biosciences, Union City, CA, USA) and quantified using QuantiFluor™-ST (Promega, USA) according to the manufacturer’s protocol.
Purified amplicons were pooled in equimolar amounts and paired-end sequenced (2×300) on an Illumina MiSeq platform (Illumina, San Diego, USA) according to the standard protocols of Majorbio Bio-Pharm Technology Co. Ltd (Shanghai, China).
Raw fastq files were demultiplexed, quality-filtered by Trimmomatic and merged by FLASH with the following criteria: (i) The readings were truncated at any site receiving an average quality score <20 over a 50 bp sliding window. (ii) Primers were matched exactly, allowing 2 nucleotide mismatches, and reads containing ambiguous bases were removed. (iii) Sequences with an overlap longer than 10 bp were merged according to the overlap sequence.
Operational taxonomic units (OTUs) were clustered with a 97% similarity cutoff using UPARSE (version 7.1 http://drive5.com/uparse/), and chimeric sequences were identified and removed using UCHIME. The taxonomy of each 16S rRNA gene sequence was analyzed by the RDP Classifier algorithm (http://rdp.cme.msu.edu/) against the 16S SILVA database (Silva 138, Bremen, Germany) using a confidence threshold of 70%.
Statistical Analysis
The experimental data were analyzed by GraphPad Prism 9.0 and expressed as the mean ±SD. Statistical differences were analyzed using one-way ANOVA test and graphed using GraphPad Prism 9.0 and R statistical programming language. A p-value of *,#p<0.05 was considered a statistically significant difference, and **,##p<0.01 was considered an extremely significant difference.
Results
General Assessment of Animals in Different Groups
The mice in control group exhibited a good mental state, physical agility, normal stools and shiny hair and were in good shape throughout entire study. The mice in model group were dispirited and exhibited less activity, drowsiness and tiredness, especially in model 3.0 group, compared with the control group. Four mice died during the experiment, one in model 2.5 group and three in model 3.0 group, while no death was observed in control group (Figure 2A). Mortality events occurred on days 11–13, and mean body weight of mice that died was significantly lower than that of other mice in the same time period.
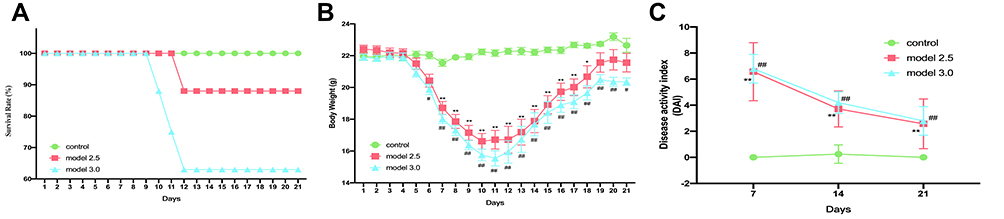 |
Figure 2 General condition of DSS-induced ulcerative colitis mice. (A) Mice survival was monitored daily. (B) The body weight of mice was measured once daily. (C) The DAI score was calculated by measuring the clinical score of body weight change, stool, and fecal occult blood. The graphs are represented as mean±SD. *,#p<0.05, **,##p<0.01. *Control and model 2.5. #Control and model 3.0. |
As shown in Figure 2B, beginning on day four, mice in the model groups exhibited weight loss. The most weight loss occured on day 10 of the experiment in model 2.5 group, but the model 3.0 group lost the most weight on day 11. Weight curve of model groups reached a plateau on day 19, and mice in model groups, especially in model 3.0 group, had significantly lower body weights than the control group (losing 2.4% and 5.3% of the initial body weight in groups of models 2.5 and 3.0). After DSS intervention, DAI scores of model groups were significantly increased and always remained significantly higher than those in the control group (p<0.05), while there was no significance between the two model groups (Figure 2C). Mice in model groups presented severe diarrhea, especially in the 3.0 model group, with the appearance of mucopurulent bloody stools after five days of DSS treatment.
These results indicate that both 2.5% and 3.0% DSS could reduce body weight, increase DAI index and cause UC symptoms in mice. Meanwhile, the disease symptoms induced by 3.0% DSS were more severe.
Histopathological Changes
Histopathological analysis is the gold standard method to diagnose UC. The results of the histopathological changes in the colon are shown in Figure 3. Crypt destruction, goblet cell loss and inflammatory cell infiltration was observed in model mice groups, and part of the lesion area developed severe edema, bleeding, and ulceration. In addition, the disease pathology was more severe in model 3.0 group. Histopathological scores of the proximal and distal segments of mice colon were depicted in Figure 3. The histopathological scores of both proximal and distal colon in model group were significantly higher than those in control group (p<0.05), and higher in 3.0% group (p<0.01). Moreover, we found that there was also statistical difference in pathological score between the two model groups, among which the 3.0% group was significantly higher than the 2.5% group (p<0.05).
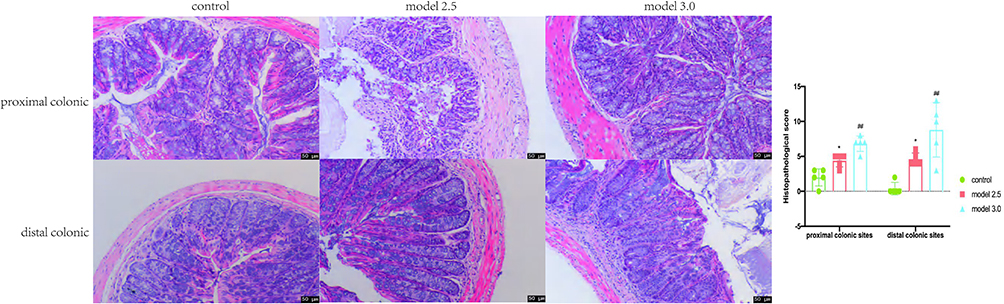 |
Figure 3 Colons tissue of the proximal and distal colon sections were stained with H&E, and the histological images were obtained through an optical microscope. Histopathological scores of inflammation cell infiltration, depth of lesions, destruction of crypts, width of lesions, and crypt damage were measured. The graphs are represented as mean ±SD. *p<0.05, #p<0.01. *Control and model 2.5. #Control and model 3.0. |
Based on the aforementioned findings, it is evident that DSS could cause severe tissue damage in both proximal and distal colon, and the damage degree caused by 3.0% DSS is worse than 2.5% DSS. In other words, pathological damage degree of local tissues in DSS-UC model is positively correlated with DSS concentration.
Changes of Inflammatory Cytokines
The results of ELISA are presented in Figure 4. Compared to the control group, the expression levels of IL-4 and 5-HT in serum and TNF-α, IFN-γ and 5-HT in the colon in the two model groups were significantly increased (p<0.05), while the expression levels of colon IL-2, IL-6, IL-10, and serum IL-6 appeared to be changed, but the changes were not statistically significant. The mice in model 3.0 group showed decreased expression levels of serum IL-10, IL-22, and colon IL-22 and elevated expression of serum IL-2 (p<0.05), however, the changes in model 2.5 group were not significantly different. Here, we found an interesting phenomenon that IL-4 content expression in serum of model 2.5 and 3.0 groups was significantly higher than that in control group (p<0.05), while the different situation was observed in the colon, and only IL-4 concentration in model 3.0 group was significantly lower (p<0.05).
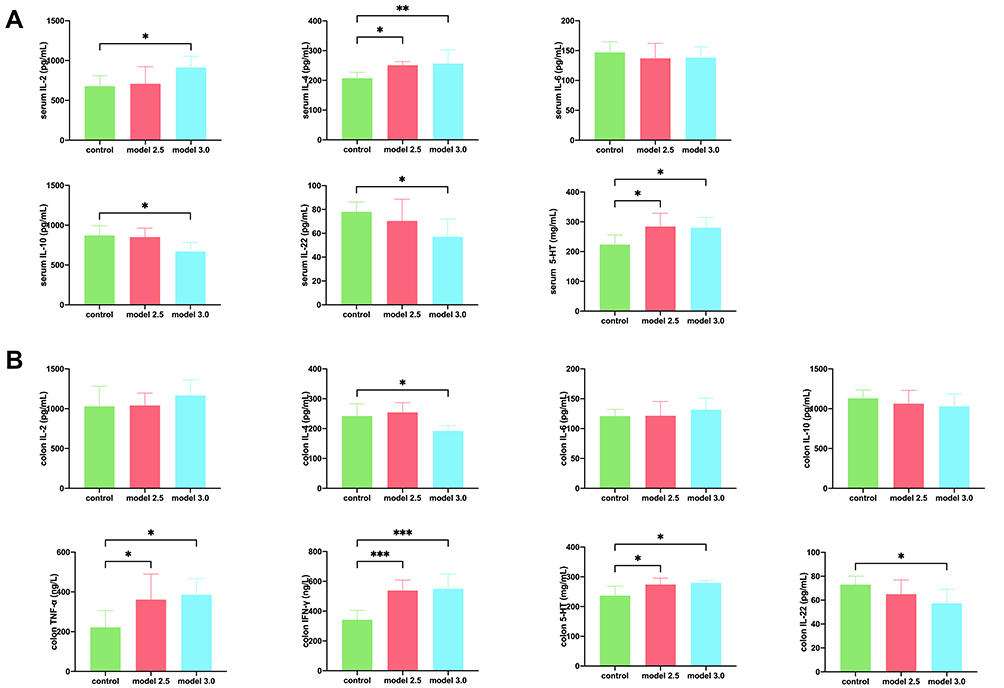 |
Figure 4 Levels of inflammatory cytokines was measured by ELISA in DSS-induced ulcerative colitis. (A) The level of inflammatory cytokines such as IL-2, IL-4, IL-6, IL-10, IL-22, or 5-HT from the serum of the mice. (B) The level of inflammatory cytokines such as IL-2, IL-4, IL-6, IL-10, IL-22, TNF-α, IFN-γ, or 5-HT from the colon of the mice. The graphs are represented as mean ±SD. *p<0.05, **p<0.01 and ***p<0.001. |
In the above results, we found that DSS increased the levels of IL-2, IL-4, 5-HT in serum and TNF-α and IFN-γ in colon tissue, and decreased the levels of IL-22 in serum and colon. At the same time, different concentrations of DSS have different effects on the above inflammatory cytokines.
Changes in Gut Microbiome Composition
Illumina sequencing of V3 and V4 regions in 16S rRNA gene produced the number of sequences in each OTU that were counted to obtain the taxonomic information of OTUs for all fecal samples from surviving mice at different periods with a similarity level of 97%. All 80 microbiome samples were sub-sampled to 2,162,480 sequence reads to conduct an OTU diversity analysis. These readings included 686 OTUs belonging to 10 phyla, 15 classes, 35 orders, 59 families, 126 genera, and 215 species. The rarefaction curves of all samples appeared to flatten (Figure 5A,), indicating that the amount of sequencing data was large enough to reflect the true level of bacterial diversity in the respective samples, and the amount of sequencing data was reasonable (Figure 5B). A total of 181 OTUs, which were assigned to 68 genera, were shared by all groups. The number of OTUs of model 2.5 and 3.0 groups decreased by varying degrees on days 7 and 14 of experiment, respectively, while some degree of recovery occurred on day 21 (Figure 5C).
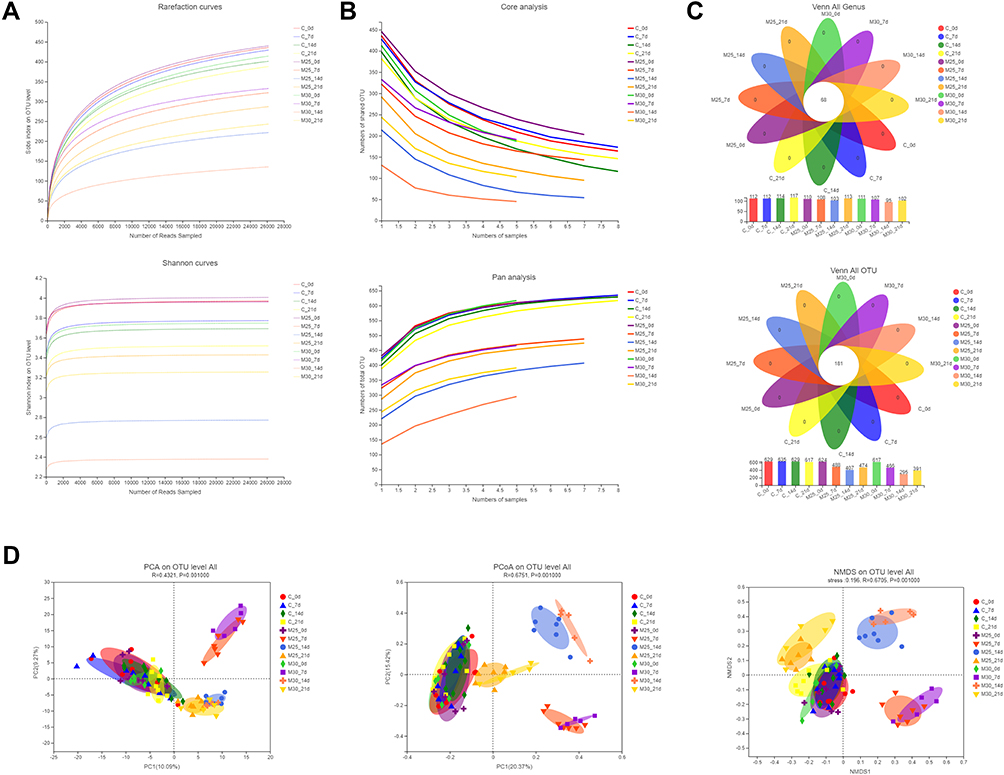 |
Figure 5 DSS changed the structure of gut microbiome in UC model mice. (A) Rarefaction/Shannon curve indicates the amount of sequencing data is large enough to reflect the true level of bacterial diversity. (B) Pan/core analysis shows the amount of sequencing data is reasonable. (C) Venn diagram (OTU and genus) analysis notes DSS could reduce the richness of bacterial community. (D) Beta-diversity analyses illustrates the gut microbiome composition of different groups differed at different time points. |
Principal component analysis (PCA), principal coordinate analysis (PCoA) and non-metric multidimensional scaling (NMDS) plot analysis showed clustering of samples by group. The clustered results shown in Figure 5D indicated that all 12 individual groups were clearly clustered into cluster. Indeed, we found that the results showed that samples without DSS intervention (control group at 0, 7, 14, and 21 days, model 2.5 and 3.0 group at 0 day) clustered into a cluster. At the same time, the samples of model 2.5 and 3.0 groups clustered into a cluster on the seventh day of the experiment, which were far apart from other groups in a separate quadrant. In addition, only in PCoA and NMDS analysis, samples of model 2.5 and 3.0 group were gathered separately on days 14 and 21 of the experiment. The 14-day samples cluster was also isolated in a quadrant, far from the other groups. The 21-day samples cluster was close to the group without DSS intervention, but had distinct boundaries. Through the above experimental results, we could find that DSS-induced and time-point were the primary determinant of intestinal flora clustering, while the concentration of DSS had little significance on gut microbiome diversity at the overall level.
We then conducted an in-depth analysis of the average relative abundance of each genus and phylum in samples for all groups at four different time points. No significant difference in the relative abundances was observed at genus and phylum levels prior to the experiment (day 0). Compared with control group, the same change tendency and significant changes in the relative abundance of many taxa at phylum and genus levels were observed in model 2.5 and 3.0 groups after DSS treatment (day seven of experiment). At phylum level (Figure 6A), Firmicutes (p<0.01), Proteobacteria (p<0.05) were significantly increased; however, Bacteroidota (p<0.01) and Patescibacteria (p<0.05) were significantly decreased. At genus level, the abundance of 10 genera was significantly changed (Figure 6B): Bacteroides (p<0.05), Lachnospiraceae_NK4A136_group (p<0.01), Turicibacter (p<0.01), Clostridium_sensu_stricto_1 (p<0.01), Eubacterium_fissicatena_group (p<0.05), Colidextribacter (p<0.05), Parasutterella (p<0.05) and Parabacteroides (p<0.05) were significantly increased; however, norank_f_Muribaculaceae (p<0.01), Lactobacillus (p<0.01) and Muribaculum (p<0.01) were much decreased. Otherwise, the abundance changes of Cyanobacteria (p<0.05), unclassified_f_Lachnospiraceae (p<0.05) and Escherichia-Shigella (p<0.05) were significantly increased only in model 3.0 group. Meanwhile, norank_f_norank_o_Clostridia_UCG-014 (p<0.05) and Romboutsia (p<0.01) were significantly increased only in model 2.5 group.
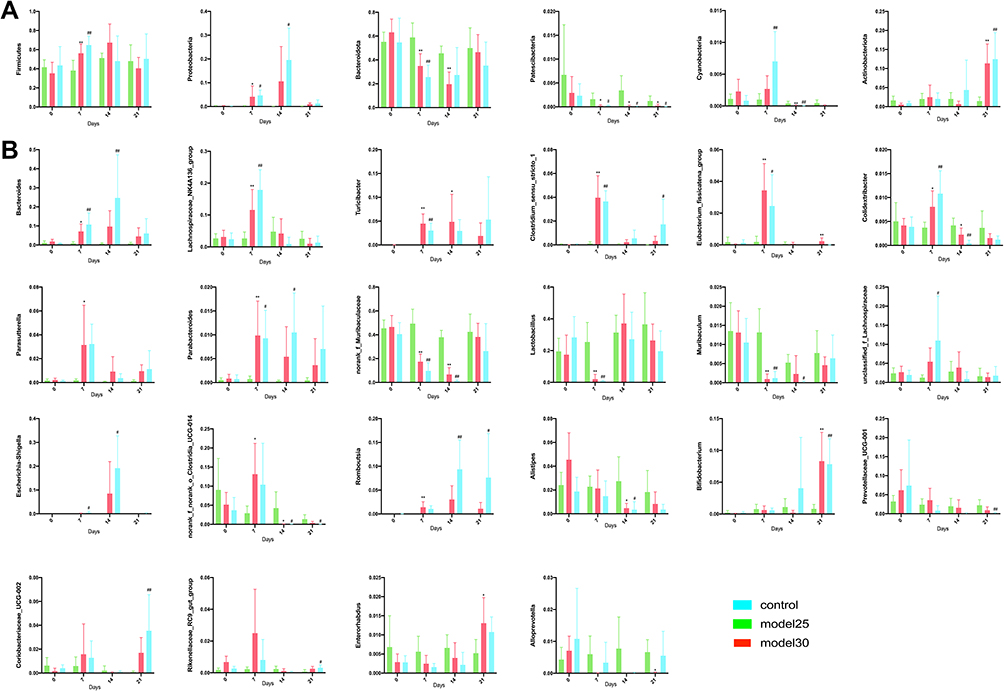 |
Figure 6 Differential gut microbiome results. (A and B) The difference genera of intestinal flora in mice at phylum (A) and genus (B) levels at different time points was analyzed. The graphs are represented as mean±SD. *,#p<0.05, **,##p<0.01. *Control and model 2.5. #Control and model 3.0. |
By day 14, the abundance of the following microbial taxa changed significantly across the model 2.5 and 3.0 groups: At phylum level (Figure 6A), Patescibacteria (p<0.05) and Cyanobacteria (p<0.05) were significantly decreased. Alternatively, Proteobacteria (p<0.05) was significantly increased only in model 3.0 group, meanwhile, Bacteroidota (p<0.01) were significantly decreased only in model 2.5 group. In addition, at genus level (Figure 6B), Romboutsia (p<0.05) was increased, while norank_f_Muribaculaceae (p<0.01), norank_f_norank_o_Clostridia_UCG-014 (p<0.05) and Alistipes (p<0.05) and Colidextribacter (p<0.05) decreased. Moreover, Bacteroides (p<0.01), Escherichia-Shigella (p<0.05) and Parabacteroides (p<0.05) was significantly increased, while Muribaculum (p<0.05) were significantly decreased only in model 3.0 group.
By day 21, only three bacterial taxa were significantly different from control group in model groups (Figure 6): Actinobacteriota (p<0.01) and Patescibacteria (p<0.05), which are at phylum level, were increased and decreased respectively; apart from that, at genus level Bifidobacterium (p<0.01) was increased. Other than that, the abundance changes of norank_f_norank_o_Clostridia_UCG-014 (p<0.05), Prevotellaceae_UCG-001 (p<0.01) were significantly decreased, while Romboutsia (p<0.05), Clostridium_sensu_stricto_1 (p<0.05), Coriobacteriaceae_UCG-002 (p<0.01) and Rikenellaceae_RC9_gut_group (p<0.05) increased only in model 3.0 group. Meanwhile, Enterorhabdus (p<0.05) and Eubacterium_fissicatena_group (p<0.01) were significantly increased, but Alloprevotella (p<0.05) decreased only in model 2.5 group.
By analyzing the relative abundance of each species in each group at different periods, results showed that at 7, 14, and 21 days after DSS intervention with different concentrations, there were statistical differences in the relative abundance of some species in control group, whether at phylum genus level. However, in different intervention days, there were also differences in types of bacteria with statistical differences.
Furthermore, we also performed an analysis of the average relative abundance of microbial taxa at genus and phylum levels in samples for different groups at different time points (Figure S1). We found that in two model groups, the relative abundance of three flora (Actinobacteriota, Patescibacteria and Cyanobacteria) at phylum level and of 22 floras (norank_f_Muribaculaceae, Lactobacillus, Bacteroides, Lachnospiraceae_NK4A136_group, norank_f_norank_o_Clostridia_UCG-014, Parasutterella, Clostridium_sensu_stricto_1, Muribaculum, Enterorhabdus, Eubacterium_fissicatena_group and Colidextribacter) at genus level changed significantly over time. Concurrently, two floras (Firmicutes and Bacteroidota) at phylum level and five floras (Prevotellaceae_UCG-001, Bifidobacterium, Romboutsia, Alloprevotella and Parabacteroides) at genus level changed significantly only in model 2.5 group. In parallel, Proteobacteria at phylum level and two floras (Escherichia-Shigella and Coriobacteriaceae_UCG-002) at genus level changed significantly only in model 3.0 group.
By analyzing the relative abundance of different groups in different periods of DSS intervention, results indicated that both DSS intervention and drug concentration had a great impact on the abundance of intestinal flora in mice. Moreover, compared with 3.0% DSS, 2.5% DSS owned a greater impact on the abundance of gut microbiome.
Correlation Analysis Between Genera and Cytokines
To further explore the relationship between the abundance of gut microbiome and inflammatory factors in mice, Spearman’s rank correlation test was performed to analyze the correlation between the above different bacteria and inflammatory cytokines (Figure 7 and Supplement Table 1). According to the analysis results, we found that the significantly inflammatory factors were associated with enriched species in mice with UC. For example, in serum level, IL-2 was positively correlated with Parabacteroides (r=0.47, p=0.034), and IL-4 was positively correlated with Bacteroides (r=0.65, p=0.002), Clostridium_sensu_stricto_1 (r=0.73, p=0.0002), Parasutterella (r=0.46, p=0.04) and Romboutsia (r=0.67, p=0.001), and negatively correlated with Alloprevotella (r=−0.47, p=0.037), Muribaculum (r=−0.54, p=0.013) and norank_f__Muribaculaceae (r=−0.49, p=0.028). In addition, IL-10 was positively correlated with Colidextribacter (r=0.53, p=0.017) and norank_f__Muribaculaceae (r=0.46, p=0.04) and negatively correlated with Romboutsia (r=−0.51, p=0.023). Moreover, IL-22 was positively correlated with Prevotellaceae_UCG-001 (r=0.53, p=0.016), and negatively correlated with Bifidobacterium (r=−0.51, p=0.02), Clostridium_sensu_stricto_1 (r=−0.48, p=0.031), Coriobacteriaceae_UCG-002 (r=−0.61, p=0.005), Enterorhabdus (r=−0.57, p=0.009), Parasutterella (r=−0.56, p=0.0098) and Romboutsia (r=−0.53, p=0.017). 5-HT was positively correlated with Coriobacteriaceae_UCG-002 (r=0.51, p=0.021), Enterorhabdus (r=0.52, p=0.018), Parasutterella (r=0.63, p=0.003) and Romboutsia (r=0.55, p=0.012), and negatively correlated with Alloprevotella (r=−0.58, p=0.008), norank_f__norank_o__Clostridia_UCG-014 (r=−0.64, p=0.003) and Prevotellaceae_UCG-001 (r=−0.51, p=0.023). Interestingly, in colon level, IL-4 was negatively correlated with Clostridium_sensu_stricto_1 (r=−0.50, p=0.026) and Coriobacteriaceae_UCG-002 (r=−0.45, p=0.045), and IL-6 was positively correlated with Lachnospiraceae_NK4A136_group (r=0.59, p=0.006) and negatively correlated with Lactobacillus (r=−0.48, p=0.032). IL-22 was positively correlated with Lachnospiraceae_NK4A136_group (r=0.52, p=0.018), norank_f__norank_o__Clostridia_UCG-014 (r=0.49, p=0.027) and Prevotellaceae_UCG-001 (r=0.53, p=0.015), while negatively correlated with Parasutterella (r=−0.50, p=0.025) and Romboutsia (r=−0.58, p=0.008). Alternatively, 5-HT was positively correlated with Bifidobacterium (r=0.64, p=0.002), Clostridium_sensu_stricto_1 (r=0.57, p=0.009), Coriobacteriaceae_UCG-002 (r=0.57, p=0.009), Enterorhabdus (r=0.48, p=0.031), Parasutterella (r=0.45, p=0.048) and Romboutsia (r=0.48, p=0.03), and negatively correlated with Prevotellaceae_UCG-001 (r=−0.53, p=0.017). TNF-α was positively correlated with Bifidobacterium (r=0.48, p=0.033), Clostridium_sensu_stricto_1 (r=0.48, p=0.033), Coriobacteriaceae_UCG-002 (r=0.51, p=0.021), Parasutterella (r=0.58, p=0.007) and Romboutsia (r=0.53, p=0.017), and negatively correlated with norank_f__norank_o__Clostridia_UCG-014 (r=−0.55, p=0.012) and Prevotellaceae_UCG-001 (r=−0.50, p=0.024). Further, IFN-γ was positively correlated with Bacteroides (r=0.82, p=0.00001), Clostridium_sensu_stricto_1 (r=0.60, p=0.005), Coriobacteriaceae_UCG-002 (r=0.49, p=0.028), Eubacterium_fissicatena_group (r=0.51, p=0.023), Parabacteroides (r=0.58, p=0.008), Parasutterella (r=0.53, p=0.016), Rikenellaceae_RC9_gut_group (r=0.53, p=0.016) and Romboutsia (r=0.69, p=0.001), and negatively correlated with Alloprevotella (r=−0.57, p=0.009), norank_f__norank_o__Clostridia_UCG-014 (r=−0.52, p=0.018) and Prevotellaceae_UCG-001 (r=−0.57, p=0.008). In conclusion, these results suggest that the inflammatory cytokines are closely associated with the imbalance of the gut microbiome in mice with UC.
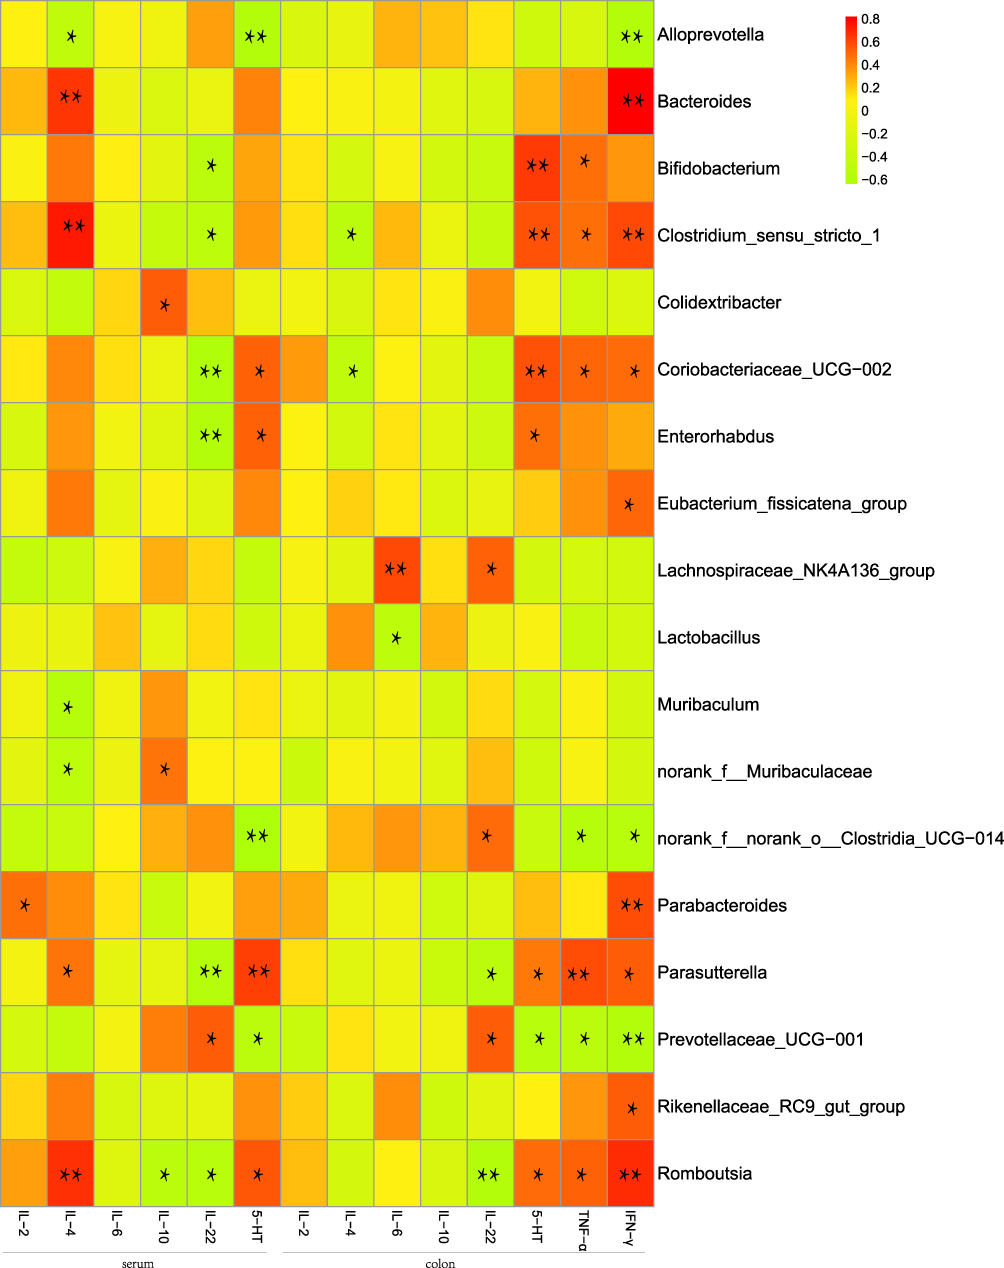 |
Figure 7 Heatmap of correlation analysis between gut microbiome and inflammatory cytokines in UC mice. Spearman’s rank correlation coefficient is indicated using a color gradient: red indicates positive correlation; green indicates negative correlation,*p<0.05, **p<0.01. |
Discussion
Gut microbiome and inflammatory cytokines play a critical role in the progression of DSS-induced UC in mice. The DSS colitis model has advantages over other various chemically induced experimental models due to its rapidity, simplicity, reproducibility and controllability, which has been widely used in basic research into the induced ulcerative colitis model.52,53 Studies in the literature suggested intestinal microecological imbalance in mice with DSS-induced UC abnormal intestinal microbial diversity and structure, and altered levels of inflammatory factors. However, few studies have explored the dynamic changes of gut microbiome in the DSS-UC model, and the changing trend and mechanism of flora in the occurrence and development of the disease are still unclear. Therefore, our study analyzed the abundance of gut microbiome in mice at different time points, and the correlation between inflammatory factors and intestinal flora to explore the pathogenesis of DSS-UC.
Through analyzed experimental mice weight loss, diarrhea, mortality, DAI index change, histopathological grading, inflammatory factor levels and relative abundance of gut microbes, we found that, in our experimental environment, DSS induced ulcerative colitis could be by intervening the intestinal microecological balance and inflammatory factors in mice, causing intestinal injury. Meanwhile, the symptoms of mice were gradually relieved after 14 days of the experiment over time, indicating that DSS-UC mice model had a certain self-healing ability. This result is consistent with another study.47 In addition, experimental results showed that the severity of UC induced by 2.5% and 3.0% DSS concentration was different. The clinical manifestations of mice with DSS-UC were highly associated with concentration: higher concentrations commonly led to more severe clinical disease manifestations. Compared with model 2.5 group, mice in 3.0 group exhibited a severe clinical manifestation, which had a more severe presentation at diagnosis and higher mortality. Hence, we preferred to use 2.5% DSS for induction modeling under the same experimental conditions as ours in view of animal ethics and experimental costs.
Literature searches suggested that intestinal flora plays a major role in the pathogenesis of ulcerative colitis.54–57 However, how the gut microbiome dynamically changes in DSS-induced UC in mice remains unclear. Through this experiment, we found that after the establishment of UC model in mice, the relative abundance of intestinal flora increased first and then decreased in Bacteroides, Parabacteroides, Romboutsia, Clostridium_sensu_stricto_1, Lachnospiraceae_NK4A136_group, norank_f_norank_o_Clostridia_UCG-014, Parasutterella, and decreased first and then increased in Lactobacillus, Muribaculum, norank_f_Muribaculaceae, in addition, Bifidobacterium, Coriobacteriaceae_UCG-002 and Enterorhabdus did not change in the first 14 days but increased significantly in the 21st day.
Previous researchers have shown that the abundance of Lactobacillus decreased in UC,58,59 which were consistent with the results of our study. Lactobacillus is an anaerobic probiotic that synthesizes amino acids and vitamins in intestinal tract. It could improve the integrity of intestinal mucosal barrier by inducing the differentiation of regulatory T cells (Treg), reduce the level of pro-inflammatory cytokines, inhibit the reproduction of pathogenic bacteria and inhibit the production of endotoxin to restore intestinal immune system balance and relieve the onset of ulcerative colitis.60–64 Accordingly, we speculated that the relative abundance of Lactobacillus recovered to normal level at day 14, which might be due to the increase of Lactobacillus induced by inflammatory feedback type of DSS. Moreover, studies found that Lactobacillus was negatively correlated with pro-inflammatory factor IL-6, which could trigger inflammatory storm at early stage of inflammation and then gradually decrease,65 which also explained the reason why there was no significant difference between pro-inflammatory factor IL-6 and control group at day 21 of the experiment.
In addition, the relative abundance of Bacteroides was significantly higher than that of control group on day seven, and then decreased but still higher than that of control group. Bacteroides is a symbiotic gram-negative exclusive anaerobic bacterium in intestinal tract of mammals, which could regulate body immunity and maintain homeostasis of internal environment.66 Its relative abundance could be significantly increased in both acute and chronic UC animal models to ameliorate Th1/Th2 immune imbalance and thus protect intestinal tissue.33,67,68 However, other study has found that Bacteroides could aggravate intestinal injury in UC,33 but there is still no definite conclusion and further research is needed.
Bifidobacterium is a common gram-positive anaerobic beneficial bacterium, which the stability of relative abundance is crucial for maintaining normal intestinal function and body health.69,70 Studies have shown that the number of Bifidobacterium decreased in UC, and increasing in intestinal tract could alleviate UC.71–73 However, the present study suggests that the relative abundance of Bifidobacterium did not change over 14 days, but increased significantly by 21 days. Yang et al believed that Bifidobacterium could only be found in intestinal tract of mice in control group.74 Therefore, we could reasonably infer that the intestinal injury of animal model has been significantly recovered after 21 days of experiment, indicating that DSS-induced UC model has certain self-healing ability, which is consistent with the literature.47 This result also explained that the relative abundance of microflora recovered partly in later experiment. For instance, Clostridium_sensu_stricto_1, Lachnospiraceae_NK4A136_group, norank_f_norank_o_Clostridia_UCG−014 and Parasutterella showed the variation trend was increased first and then decreased, while Lactobacillus, Muribaculum and norank_f_Muribaculaceae decreased first and then increased, which showed no significant difference between control group at 21 days.
Clostridium_sensu_stricto_1 played an important role in development of UC. The present results corresponded with the results of previous studies that the relative abundance of Clostridium_sensu_stricto_1 increased significantly in animal models.75–77 In addition, we also found that Clostridium_sensu_stricto_1 was positively correlated with IL-4 in serum, 5-HT, TNF-α and IFN-γ in colon. Studies have shown that IL-4 in UC could induce monocytes and eosinophils to participate in inflammatory response and stimulate mast cell proliferation, thus promoting inflammatory response and aggravating the degree of UC.78,79 The level of peripheral 5-HT, a pro-inflammatory factor, which could regulate cellular immune function, promote emission of IFN-γ and other inflammatory factors,80 and also aggravate inflammatory response of UC, was positively correlated with the severity of UC,80,81 Taken together, DSS could increase the abundance of Clostridium_sensu_stricto_1 relative pro-inflammatory factors, promotes the release of IL-4, 5-HT, TNF-α and IFN-γ, which could promote intestinal inflammation, leading to ulcerative colitis.
Short-chain fatty acids (SCFAs), which generated by the degradation and fermentation of indigestible carbohydrates by gut microbiome, could increase intestinal peristalsis and oxygen content in the intestinal mucosa, and promote epithelial cell proliferation and gland development.82–84 SCFAs, which are important source of energy for immune cells,85,86 are essential substrate of intestinal epithelium normal function, regulation of the immune response and inflammation,87,88 Literature searches suggested that SCFAs were closely associated to UC,31,89,90 and the relative levels of bacteria, which could produce SCFAs also changed significantly in UC, which could relieve clinical symptoms and promote intestinal microecological balance, thus playing a positive role in recovery of UC.91,92 Our study found that DSS could lead to significant changes in relative levels of bacteria, such as Lachnospiraceae_NK4A136_group and Muribaculum, which could produce SCFAs in the intestinal tract but different trends after DSS intervention. We inferred the reason may be that Lachnospiraceae_NK4A136_group is a beneficial bacterium, and when the level of Lachnospiraceae_NK4A136_group increased in an early stage of inflammation, SCFAs were generated to against inflammatory response. After inflammatory response reduced, its abundance decreased. However, Muribaculum was significantly inhibited at early stage, so its abundance decreased, and then increased to produce SCFAs to against inflammation. In conclusion, intestinal microflora plays an anti-inflammatory effect role in whole process of occurrence and development of UC, but different bacteria have anti-inflammatory effects at different times.
To study mechanism between inflammatory cytokines and intestinal flora in pathogenesis of UC, we conducted correlation analysis and found that most pathogenic bacteria in the intestinal tract of the UC animal model were positively correlated with pro-inflammatory factors and negatively correlated with anti-inflammatory factors, while beneficial bacteria were the opposite. For example, the relative abundance of pathogenic bacteria (Clostridium_sensu_stricto_1, Coriobacteriaceae_UCG−002, Parasutterella and Romboutsia) was positively correlated with the level of pro-inflammatory factors (IL-4, TNF-α, IFN-γ, 5-HT), but negatively correlated with anti-inflammatory factors (IL-10, IL-22). This result is consistent with previous studies.37,44,47,93 These findings suggest that DSS could affect the relative abundance of intestinal microorganisms and the level of inflammatory factors in mice, disrupt intestinal immune balance, cause tissue damage and induce UC.
Conclusion
Our study found that 2.5% DSS caused colon tissue damage to UC by decreasing abundance of certain probiotics, increasing abundance of pathogenic bacteria to reduce the level of anti-inflammatory factors and increase pro-inflammatory factors. Moreover, there were significant differences in relative abundance of bacteria in different stages of UC, and most of them tended to be normal at day 21. Our study, together with previous studies, suggests that Intestinal microecology plays an important role in DSS-induced UC model, and the relative abundance of gut microbiome changes dynamically in the occurrence and development of ulcerative colitis.
Abbreviations
UC, ulcerative colitis; DSS, dextran sodium sulfate; TNBS, 2,4,6-trinitrobenzene sulfonic acid; OXZ, oxazolone; DNCB, dinitrochlorobenzene; CD, Crohn’s disease; ELISA, enzyme-linked immunosorbent assay; IL-2, interleukin-2; IL-4, interleukin-4; IL-6, interleukin-6; IL-10, interleukin-10; IL-22, interleukin-22; IFN-γ, interferon-gamma; TNF-α, tumor necrosis factor-alpha; 5-HT, 5-hydroxytryptamine; DAI, disease activity index; H&E, hematoxylin and eosin; OTUs, operational taxonomic units; PCA, principal component analysis; PCoA, principal coordinate analysis; NMDS, non-metric multidimensional scaling; Treg, regulatory T cells; SCFA, short-chain fatty acids.
Acknowledgments
Supported by the Traditional Chinese Medicine Science and Technology Development Plan Project of Shandong Province (No. 2020M096), Qilu Health and Health Leading Talents Training Project in 2020 (Lu Wei Talent Zi [2020] No. 3) first batch of scientific research and innovation outstanding team project of Shandong University of Traditional Chinese Medicine (220316)-Innovation team of action mechanism and efficacy evaluation of Jingfang in treating major diseases and Shandong Province key RESEARCH and Development Plan (key technologies and key industrial key technologies) (2016CYJS08A01-6).
Author Contributions
All authors made a significant contribution to the work reported, whether that is in the conception, study design, execution, acquisition of data, analysis and interpretation, or in all these areas; took part in drafting, revising or critically reviewing the article; gave final approval of the version to be published; have agreed on the journal to which the article has been submitted; and agree to be accountable for all aspects of the work.
Disclosure
The authors report no conflicts of interest in this work.
References
1. Atreya R, Siegmund B. Location is important: differentiation between ileal and colonic Crohn’s disease. Nat Rev Gastroenterol Hepatol. 2021;18:544–558. doi:10.1038/s41575-021-00424-6
2. American Gastroenterological Association. Management of mild-to-moderate ulcerative colitis: patient guide. Gastroenterology. 2019;156(3):766–767. doi:10.1053/j.gastro.2019.01.036
3. Al-Horani R, Spanudakis E, Hamad B. The market for ulcerative colitis. Nat Rev Drug Discov. 2022;21(1):15–16. doi:10.1038/d41573-021-00194-5
4. Cleveland NK, Torres J, Rubin DT. What does disease progression look like in ulcerative colitis, and how might it be prevented? Gastroenterology. 2022;162(5):1396–1408.
5. Cui G, Yuan A. A systematic review of epidemiology and risk factors associated with Chinese inflammatory bowel disease. Front Med. 2018;5:183. doi:10.3389/fmed.2018.00183
6. Ng SC, Shi HY, Hamidi N, et al. Worldwide incidence and prevalence of inflammatory bowel disease in the 21st century: a systematic review of population-based studies. Lancet. 2017;390(10114):2769–2778. doi:10.1016/S0140-6736(17)32448-0
7. Neurath MF. Targeting immune cell circuits and trafficking in inflammatory bowel disease. Nat Immunol. 2019;20(8):970–979. doi:10.1038/s41590-019-0415-0
8. APDW2004 Chinese IBD Working Group. Retrospective analysis of 515 cases of Crohn’s disease hospitalization in China: nationwide study from 1990 to 2003. J Gastroenterol Hepatol. 2006;21(6):1009–1015. doi:10.1111/j.1440-1746.2006.04140.x
9. Short SP, Pilat JM, Barrett CW, et al. Colonic epithelial-derived selenoprotein P is the source for antioxidant-mediated protection in colitis-associated cancer. Gastroenterology. 2021;160:1694–1708.e3. doi:10.1053/j.gastro.2020.12.059
10. Kobayashi T, Siegmund B, Le Berre C, et al. Ulcerative colitis. Nat Rev Dis Primers. 2020;6(1):74. doi:10.1038/s41572-020-0205-x
11. Damas OM, Abreu MT. Are patients with ulcerative colitis still at increased risk of colon cancer? Lancet. 2020;395(10218):92–94. doi:10.1016/S0140-6736(19)33225-8
12. Eaden JA, Abrams KR, Mayberry JF. The risk of colorectal cancer in ulcerative colitis: a meta-analysis. Gut. 2001;48(4):526–535. doi:10.1136/gut.48.4.526
13. Galipeau HJ, Caminero A, Turpin W, et al. Novel fecal biomarkers that precede clinical diagnosis of ulcerative colitis. Gastroenterology. 2020;160:1532–1545. doi:10.1053/j.gastro.2020.12.004
14. He X, Gao J, Peng L, et al. Bacterial O-GlcNAcase genes abundance decreases in ulcerative colitis patients and its administration ameliorates colitis in mice. Gut. 2020;70(10):1872–1883.
15. Hovhannisyan Z, Treatman J, Littman DR, Mayer L. Characterization of interleukin-17-producing regulatory T cells in inflamed intestinal mucosa from patients with inflammatory bowel diseases. Gastroenterology. 2011;140(3):957–965. doi:10.1053/j.gastro.2010.12.002
16. Nakase H, Sato N, Mizuno N, Ikawa Y. The influence of cytokines on the complex pathology of ulcerative colitis. Autoimmun Rev. 2022;21(3):103017. doi:10.1016/j.autrev.2021.103017
17. Annese V. Genetics and epigenetics of IBD. Pharmacol Res. 2020;159:104892. doi:10.1016/j.phrs.2020.104892
18. Quigley EM. Epigenetics: filling in the ‘heritability gap’ and identifying gene-environment interactions in ulcerative colitis. Genome Med. 2012;4(9):72. doi:10.1186/gm373
19. Bilsborough J, Fiorino MF, Henkle BW. Select animal models of colitis and their value in predicting clinical efficacy of biological therapies in ulcerative colitis. Expert Opin Drug Discov. 2020;16:1–11.
20. Silva I, Pinto R, Mateus V. Preclinical study in vivo for new pharmacological approaches in inflammatory bowel disease: a systematic review of chronic model of TNBS-induced colitis. J Clin Med. 2019;8(10):1574. doi:10.3390/jcm8101574
21. Kozik AJ, Nakatsu CH, Chun H, Jones-Hall YL. Comparison of the fecal, cecal, and mucus microbiome in male and female mice after TNBS-induced colitis. PLoS One. 2019;14(11):e0225079. doi:10.1371/journal.pone.0225079
22. Maduzia D, Matuszyk A, Ceranowicz D, et al. The influence of pretreatment with ghrelin on the development of acetic-acid-induced colitis in rats. J Physiol Pharmacol. 2015;66(6):875–885.
23. Rabin BS, Rogers SJ. A cell-mediated immune model of inflammatory bowel disease in the rabbit. Gastroenterology. 1978;75(1):29–33. doi:10.1016/0016-5085(78)93759-9
24. Randhawa PK, Singh K, Singh N, Jaggi AS. A review on chemical-induced inflammatory bowel disease models in rodents. Korean J Physiol Pharmacol. 2014;18(4):279–288. doi:10.4196/kjpp.2014.18.4.279
25. González-Ramírez AE, González-Trujano ME, Orozco-Suárez SA, Alvarado-Vásquez N, López-Muñoz FJ. Nerol alleviates pathologic markers in the oxazolone-induced colitis model. Eur J Pharmacol. 2016;776:81–89. doi:10.1016/j.ejphar.2016.02.036
26. Devkota S, Wang Y, Musch MW, et al.Dietary-fat-induced taurocholic acid promotes pathobiont expansion and colitis in Il10~(-/-) mice. Nature. 2012;487(7405):104–108.
27. Onderdonk AB, Hermos JA, Dzink JL, Bartlett JG. Protective effect of metronidazole in experimental ulcerative colitis. Gastroenterology. 1978;74(3):521–526. doi:10.1016/0016-5085(78)90289-5
28. Wu B, Qiang L, Zhang Y, et al. The deubiquitinase OTUD1 inhibits colonic inflammation by suppressing RIPK1-mediated NF-κB signaling. Cell Mol Immunol. 2022;19(2):276–289. doi:10.1038/s41423-021-00810-9
29. Kim S, Lee JY, Shin SG, et al. ESRRA (estrogen related receptor alpha) is a critical regulator of intestinal homeostasis through activation of autophagic flux via gut microbiota. Autophagy. 2021;17(10):2856–2875. doi:10.1080/15548627.2020.1847460
30. Xu Y, Zhu BW, Li X, Li YF, Ye XM, Hu JN. Glycogen-based pH and redox sensitive nanoparticles with ginsenoside Rh(2) for effective treatment of ulcerative colitis. Biomaterials. 2022;280:121077. doi:10.1016/j.biomaterials.2021.121077
31. Yang Y, Zheng X, Wang Y, et al. Human fecal microbiota transplantation reduces the susceptibility to dextran sulfate sodium-induced germ-free mouse colitis. Front Immunol. 2022;13:836542. doi:10.3389/fimmu.2022.836542
32. Li H, Zhang Y, Liu M, et al. Targeting PDE4 as a promising therapeutic strategy in chronic ulcerative colitis through modulating mucosal homeostasis. Acta Pharm Sin B. 2022;12(1):228–245. doi:10.1016/j.apsb.2021.04.007
33. Okayasu I, Hatakeyama S, Yamada M, Ohkusa T, Inagaki Y, Nakaya R. A novel method in the induction of reliable experimental acute and chronic ulcerative colitis in mice. Gastroenterology. 1990;98(3):694–702. doi:10.1016/0016-5085(90)90290-H
34. Kiesler P, Fuss IJ, Strober W. Experimental models of inflammatory bowel diseases. Cell Mol Gastroenterol Hepatol. 2015;1:154–170. doi:10.1016/j.jcmgh.2015.01.006
35. Das S, Rachagani S, Sheinin Y, et al. Mice deficient in Muc4 are resistant to experimental colitis and colitis-associated colorectal cancer. Oncogene. 2015;35(20):2645–2654.
36. Qu S, Fan L, Qi Y, et al. Akkermansia muciniphila alleviates dextran sulfate sodium (DSS)-induced acute colitis by NLRP3 activation. Microbiol Spectr. 2021;9(2):e0073021. doi:10.1128/Spectrum.00730-21
37. Larabi A, Barnich N, Nguyen HTT. New insights into the interplay between autophagy, gut microbiota and inflammatory responses in IBD. Autophagy. 2020;16(1):38–51. doi:10.1080/15548627.2019.1635384
38. Yu W, Wang G, Lu C, et al. Pharmacological mechanism of Shenlingbaizhu formula against experimental colitis. Phytomedicine. 2022;98:153961. doi:10.1016/j.phymed.2022.153961
39. Huang X, Ai F, Ji C, et al. A rapid screening method of candidate probiotics for inflammatory bowel diseases and the anti-inflammatory effect of the selected strain Bacillus smithii XY1. Front Microbiol. 2021;12:760385. doi:10.3389/fmicb.2021.760385
40. Yu W, Su X, Chen W, et al. Three types of gut bacteria collaborating to improve Kui Jie’an enema treat DSS-induced colitis in mice. Biomed Pharmacother. 2019;113:108751. doi:10.1016/j.biopha.2019.108751
41. Dong L, Du H, Zhang M, et al. Anti-inflammatory effect of Rhein on ulcerative colitis via inhibiting PI3K/Akt/mTOR signaling pathway and regulating gut microbiota. Phytother Res. 2022. doi:10.1002/ptr.7429
42. Chen J, Zhang LK, Gu WC, et al. Effect of Banxia Xiexin Decoction on intestinal flora of mice with ulcerative colitis induced by dextran sodium sulfate. Zhongguo Zhong Yao Za Zhi. 2021;46(11):2871–2880. doi:10.19540/j.cnki.cjcmm.20210119.401
43. Rosa F, Matazel KS, Elolimy AA, et al. Human milk-fed piglets have a distinct small intestine and circulatory metabolome profile relative to that of milk formula-fed piglets. mSystems. 2021;6(1). doi:10.1128/mSystems.01376-20
44. van de Guchte M, Mondot S, Doré J. Dynamic properties of the intestinal ecosystem call for combination therapies, targeting inflammation and microbiota, in ulcerative colitis. Gastroenterology. 2021;161(6):1969–1981.e1912. doi:10.1053/j.gastro.2021.08.057
45. Mills RH, Dulai PS, Vázquez-Baeza Y, et al. Multi-omics analyses of the ulcerative colitis gut microbiome link Bacteroides vulgatus proteases with disease severity. Nat Microbiol. 2022;7(2):262–276. doi:10.1038/s41564-021-01050-3
46. Lima SF, Gogokhia L, Viladomiu M, et al. Transferable immunoglobulin A-coated odoribacter splanchnicus in responders to fecal microbiota transplantation for ulcerative colitis limits colonic inflammation. Gastroenterology. 2022;162(1):166–178. doi:10.1053/j.gastro.2021.09.061
47. Jialing L, Yangyang G, Jing Z, et al. Changes in serum inflammatory cytokine levels and intestinal flora in a self-healing dextran sodium sulfate-induced ulcerative colitis murine model. Life Sci. 2020;263:118587. doi:10.1016/j.lfs.2020.118587
48. Wang GH, Dittmer J, Douglas B, Huang L, Brucker RM. Coadaptation between host genome and microbiome under long-term xenobiotic-induced selection. Sci Adv. 2021;7(19). doi:10.1126/sciadv.abd4473
49. Huang H, Jiang Y, Zhao J, Li S, Schulz S, Deng L. BTEX biodegradation is linked to bacterial community assembly patterns in contaminated groundwater ecosystem. J Hazard Mater. 2021;419:126205. doi:10.1016/j.jhazmat.2021.126205
50. Zheng G, Ma Y, Zou Y, Yin A, Li W, Dong D. HCMDB: the human cancer metastasis database. Nucleic Acids Res. 2018;46(D1):D950–d955. doi:10.1093/nar/gkx1008
51. Zhang X, Johnston ER, Barberán A, Ren Y, Lü X, Han X. Decreased plant productivity resulting from plant group removal experiment constrains soil microbial functional diversity. Glob Chang Biol. 2017;23(10):4318–4332. doi:10.1111/gcb.13783
52. Eichele DD, Kharbanda KK. Dextran sodium sulfate colitis murine model: an indispensable tool for advancing our understanding of inflammatory bowel diseases pathogenesis. World J Gastroenterol. 2017;23(33):6016–6029. doi:10.3748/wjg.v23.i33.6016
53. Gaudio E, Taddei G, Vetuschi A, et al. Dextran sulfate sodium (DSS) colitis in rats: clinical, structural, and ultrastructural aspects. Dig Dis Sci. 1999;44(7):1458–1475. doi:10.1023/A:1026620322859
54. Nishihara Y, Ogino H, Tanaka M, et al. Mucosa-associated gut microbiota reflects clinical course of ulcerative colitis. Sci Rep. 2021;11(1):13743. doi:10.1038/s41598-021-92870-0
55. Mei Z, Huang X, Zhang H, et al. Chitin derivatives ameliorate DSS-induced ulcerative colitis by changing gut microbiota and restoring intestinal barrier function. Int J Biol Macromol. 2022;202:375–387. doi:10.1016/j.ijbiomac.2022.01.049
56. Li Q, Ding X, Liu K, et al. Fecal microbiota transplantation for ulcerative colitis: the optimum timing and gut microbiota as predictors for long-term clinical outcomes. Clin Transl Gastroenterol. 2020;11(8):e00224. doi:10.14309/ctg.0000000000000224
57. Cui L, Guan X, Ding W, et al. Scutellaria baicalensis Georgi polysaccharide ameliorates DSS-induced ulcerative colitis by improving intestinal barrier function and modulating gut microbiota. Int J Biol Macromol. 2021;166:1035–1045. doi:10.1016/j.ijbiomac.2020.10.259
58. Wu M, Li P, An Y, et al. Phloretin ameliorates dextran sulfate sodium-induced ulcerative colitis in mice by regulating the gut microbiota. Pharmacol Res. 2019;150:104489. doi:10.1016/j.phrs.2019.104489
59. Yu P, Ke C, Guo J, Zhang X, Li B. Lactobacillus plantarum L15 alleviates colitis by inhibiting LPS-mediated NF-κB activation and ameliorates DSS-induced gut microbiota dysbiosis. Front Immunol. 2020;11:575173. doi:10.3389/fimmu.2020.575173
60. El-Baz AM, Khodir AE, Adel El-Sokkary MM, Shata A. The protective effect of Lactobacillus versus 5-aminosalicylic acid in ulcerative colitis model by modulation of gut microbiota and Nrf2/Ho-1 pathway. Life Sci. 2020;256:117927. doi:10.1016/j.lfs.2020.117927
61. Jeon SG, Kayama H, Ueda Y, et al. Probiotic Bifidobacterium breve induces IL-10-producing Tr1 cells in the colon. PLoS Pathog. 2012;8(5):e1002714. doi:10.1371/journal.ppat.1002714
62. Imaoka A, Shima T, Kato K, et al. Anti-inflammatory activity of probiotic Bifidobacterium: enhancement of IL-10 production in peripheral blood mononuclear cells from ulcerative colitis patients and inhibition of IL-8 secretion in HT-29 cells. World J Gastroenterol. 2008;14(16):2511–2516. doi:10.3748/wjg.14.2511
63. Bian X, Wu W, Yang L, et al. Administration of Akkermansia muciniphila ameliorates dextran sulfate sodium-induced ulcerative colitis in mice. Front Microbiol. 2019;10:2259. doi:10.3389/fmicb.2019.02259
64. Wang G, Liu Y, Lu Z, et al. The ameliorative effect of a Lactobacillus strain with good adhesion ability against dextran sulfate sodium-induced murine colitis. Food Funct. 2019;10(1):397–409. doi:10.1039/C8FO01453A
65. Ma X, Hu Y, Li X, et al. Periplaneta americana ameliorates dextran sulfate sodium-induced ulcerative colitis in rats by Keap1/Nrf-2 activation, intestinal barrier function, and gut microbiota regulation. Front Pharmacol. 2018;9:944. doi:10.3389/fphar.2018.00944
66. Bornet E, Westermann AJ. The ambivalent role of Bacteroides in enteric infections. Trends Microbiol. 2022;30(2):104–108. doi:10.1016/j.tim.2021.11.009
67. Mazmanian SK, Liu CH, Tzianabos AO, Kasper DL. An immunomodulatory molecule of symbiotic bacteria directs maturation of the host immune system. Cell. 2005;122(1):107–118. doi:10.1016/j.cell.2005.05.007
68. Im E, Jung J, Pothoulakis C, Rhee SH. Disruption of Pten speeds onset and increases severity of spontaneous colitis in Il10(-/-) mice. Gastroenterology. 2014;147(3):667–679.e610. doi:10.1053/j.gastro.2014.05.034
69. Ming J, Yu X, Xu X, et al. Effectiveness and safety of Bifidobacterium and berberine in human hyperglycemia and their regulatory effect on the gut microbiota: a multi-center, double-blind, randomized, parallel-controlled study. Genome Med. 2021;13(1):125. doi:10.1186/s13073-021-00942-7
70. Reghu S, Miyako E. Nanoengineered bifidobacterium bifidum with optical activity for photothermal cancer immunotheranostics. Nano Lett. 2022;22:1880–1888. doi:10.1021/acs.nanolett.1c04037
71. Groeger D, O’Mahony L, Murphy EF, et al. Bifidobacterium infantis 35624 modulates host inflammatory processes beyond the gut. Gut Microbes. 2013;4(4):325–339. doi:10.4161/gmic.25487
72. Liwinski T, Casar C, Ruehlemann MC, et al. A disease-specific decline of the relative abundance of Bifidobacterium in patients with autoimmune hepatitis. Aliment Pharmacol Ther. 2020;51(12):1417–1428. doi:10.1111/apt.15754
73. Furrie E, Macfarlane S, Kennedy A, et al. Synbiotic therapy (Bifidobacterium longum/Synergy 1) initiates resolution of inflammation in patients with active ulcerative colitis: a randomised controlled pilot trial. Gut. 2005;54(2):242–249. doi:10.1136/gut.2004.044834
74. Yang C, Jie L, Si-min Z, et al. Effect of Gegen Qinlian Decoction and it’s different compatibility groups on gut microbiota in rats with acute enteritis based on high-throughput sequencing. China J Chin Materia Medica. 2020;45(06):1406–1417. doi:10.19540/j.cnki.cjcmm.20191112.401
75. Chen L, Wang W, Zhou R, et al. Characteristics of fecal and mucosa-associated microbiota in Chinese patients with inflammatory bowel disease. Medicine. 2014;93(8):e51. doi:10.1097/MD.0000000000000051
76. Yang WY, Lee Y, Lu H, Chou CH, Wang C. Analysis of gut microbiota and the effect of lauric acid against necrotic enteritis in Clostridium perfringens and Eimeria side-by-side challenge model. PLoS One. 2019;14(5):e0205784. doi:10.1371/journal.pone.0205784
77. Ghosh SS, Gehr TW, Ghosh S, et al. PPARgamma ligand attenuates PDGF-induced mesangial cell proliferation: role of MAP kinase. Kidney Int. 2003;64(1):52–62. doi:10.1046/j.1523-1755.2003.00054.x
78. Nowak JK, Adams AT, Kalla R, et al. Characterization of the circulating transcriptomic landscape in inflammatory bowel disease provides evidence for dysregulation of multiple transcription factors including NFE2, SPI1, CEBPB, and IRF2. J Crohns Colitis. 2022. doi:10.1093/ecco-jcc/jjac033
79. Uchiyama K, Takagi T, Mizushima K, et al. Mucosal interleukin-8 expression as a predictor of subsequent relapse in UC patients with MES 0. J Gastroenterol Hepatol. 2022. doi:10.1111/jgh.15813
80. Zhang L. Exploring the Mechanism of Banxia Xiexin Decoction and Its Decomposed Recipes for Treatment of Ulcerative Colitis Based on Gut Microbiota. [Dissertation]. Shandong University of Traditional Chineae Medicine; 2021.
81. Ren T, Ren M, Ren X, Ren P, Lin Y, Lin W. Characteristics of alter 5-Hydroxytryptamine signaling in colonic mucosa of patients with ulcerative colitis. Int J Digest Dis. 2019;39(03):222–227.
82. Wu PH, Chiu YW, Zou HB, et al. Exploring the benefit of 2-methylbutyric acid in patients undergoing hemodialysis using a cardiovascular proteomics approach. Nutrients. 2019;11(12):3033. doi:10.3390/nu11123033
83. Ichikawa N, Sasaki H, Lyu Y, et al. Cold exposure during the active phase affects the short-chain fatty acid production of mice in a time-specific manner. Metabolites. 2021;12(1):20. doi:10.3390/metabo12010020
84. Dass NB, John AK, Bassil AK, et al. The relationship between the effects of short-chain fatty acids on intestinal motility in vitro and GPR43 receptor activation. Neurogastroenterol Motil. 2007;19(1):66–74. doi:10.1111/j.1365-2982.2006.00853.x
85. Hecker M, Sommer N, Mayer K. Assessment of short- and medium-chain fatty acids on mitochondrial function in severe inflammation. Methods Mol Biol. 2015;1265:389–396.
86. Hecker M, Sommer N, Mayer K. Assessment of short- and medium-chain fatty acids on mitochondrial function in severe inflammation. Methods Mol Biol. 2021;2277:125–132.
87. Wang J, Li M, Gao Y, et al. Effects of Exopolysaccharides from Lactiplantibacillus plantarum JLAU103 on intestinal immune response, oxidative stress, and microbial communities in cyclophosphamide-induced immunosuppressed mice. J Agric Food Chem. 2022;70(7):2197–2210. doi:10.1021/acs.jafc.1c06502
88. Schlatterer K, Peschel A, Kretschmer D. Short-chain fatty acid and FFAR2 activation - a new option for treating infections? Front Cell Infect Microbiol. 2021;11:785833. doi:10.3389/fcimb.2021.785833
89. Machiels K, Joossens M, Sabino J, et al. A decrease of the butyrate-producing species Roseburia hominis and Faecalibacterium prausnitzii defines dysbiosis in patients with ulcerative colitis. Gut. 2014;63(8):1275–1283. doi:10.1136/gutjnl-2013-304833
90. Bajic D, Niemann A, Hillmer AK, et al. Gut microbiota-derived propionate regulates the expression of Reg3 mucosal lectins and ameliorates experimental colitis in mice. J Crohns Colitis. 2020;14(10):1462–1472. doi:10.1093/ecco-jcc/jjaa065
91. Magnusson MK, Isaksson S, Öhman L. The anti-inflammatory immune regulation induced by butyrate is impaired in inflamed intestinal mucosa from patients with ulcerative colitis. Inflammation. 2020;43(2):507–517. doi:10.1007/s10753-019-01133-8
92. Russo E, Giudici F, Fiorindi C, Ficari F, Scaringi S, Amedei A. Immunomodulating activity and therapeutic effects of short chain fatty acids and tryptophan post-biotics in inflammatory bowel disease. Front Immunol. 2019;10:2754. doi:10.3389/fimmu.2019.02754
93. Sayed IM, Ibeawuchi SR, Lie D, et al. The interaction of enteric bacterial effectors with the host engulfment pathway control innate immune responses. Gut Microbes. 2021;13(1):1991776. doi:10.1080/19490976.2021.1991776
 © 2022 The Author(s). This work is published and licensed by Dove Medical Press Limited. The
full terms of this license are available at https://www.dovepress.com/terms
and incorporate the Creative Commons Attribution
- Non Commercial (unported, 3.0) License.
By accessing the work you hereby accept the Terms. Non-commercial uses of the work are permitted
without any further permission from Dove Medical Press Limited, provided the work is properly
attributed. For permission for commercial use of this work, please see paragraphs 4.2 and 5 of our Terms.
© 2022 The Author(s). This work is published and licensed by Dove Medical Press Limited. The
full terms of this license are available at https://www.dovepress.com/terms
and incorporate the Creative Commons Attribution
- Non Commercial (unported, 3.0) License.
By accessing the work you hereby accept the Terms. Non-commercial uses of the work are permitted
without any further permission from Dove Medical Press Limited, provided the work is properly
attributed. For permission for commercial use of this work, please see paragraphs 4.2 and 5 of our Terms.