
Back to Journals » International Journal of Women's Health » Volume 17
Dutch Translation and Validation of the Treatment Expectation Questionnaire (TEX-Q)
Authors Keukens A  , Henst S, Burger P , Kriek E, Tiemens B, Shedden-Mora M, Bongers MY, Coppus SF, Maas JWM
Received 18 July 2025
Accepted for publication 21 November 2025
Published 5 December 2025 Volume 2025:17 Pages 5169—5180
DOI https://doi.org/10.2147/IJWH.S554835
Checked for plagiarism Yes
Review by Single anonymous peer review
Peer reviewer comments 2
Editor who approved publication: Dr Vinay Kumar
Anne Keukens,1,2 Suzanne Henst,3 Pia Burger,4,5 Eline Kriek,1 Bea Tiemens,3,6 Meike Shedden-Mora,7,8 Marlies Y Bongers,1,2 Sjors FPJ Coppus,1 Jacques WM Maas2,9
1Department of Gynecology, Máxima Medical Center, Veldhoven, the Netherlands; 2Department of Research, GROW – School for Oncology and Reproduction, Maastricht, the Netherlands; 3Department of Research, Pro Persona Research, Wolfheze, the Netherlands; 4Department of Psychiatry, GGZ Eindhoven, Eindhoven, the Netherlands; 5Department of Pediatrics, Emma Children’s Hospital/Amsterdam UMC, Amsterdam, the Netherlands; 6Behavioural Science Institute, Radboud University, Nijmegen, the Netherlands; 7Institute for Clinical Psychology and Psychotherapy & Department of Psychology, Medical School Hamburg, Hamburg, Germany; 8Department of Psychosomatic Medicine and Psychotherapy, University Medical Center Hamburg-Eppendorf, Hamburg, Germany; 9Department of Obstetrics and Gynaecology, Maastricht University Medical Center+, Maastricht, the Netherlands
Correspondence: Anne Keukens, Department of Gynecology, Máxima Medical Center, de Run 4600, Veldhoven, 5504 DB, the Netherlands, Tel +3140 888 8384, Email [email protected]
Purpose: The Treatment Expectation Questionnaire (TEX-Q) is a generic, multidimensional scale that measures patients’ expectations of medical and psychological treatments. Currently, it is available in English and German only. This study aims to translate the TEX-Q into Dutch and evaluate its psychometric properties.
Patients and Methods: The TEX-Q was translated into Dutch following international guidelines for cross-cultural adaptation of self-report measures. The Dutch version was tested in 163 gynaecological outpatients starting new treatments, a group suitable for validation due to their diverse treatment experiences. Test-retest reliability was assessed in a sample of 25 gynaecological outpatients. We examined data completeness (ie, no missing data), score distributions, internal consistency, construct validity, confirmatory factor analysis (CFA), and test-retest reliability. Convergent validity was tested through correlations with Credibility/Expectancy Questionnaire (CEQ) and a single item from Brief Illness Perception Questionnaire (B-IPQ). Discriminant validity was assessed using Life Orientation Test (LOT-R), General Self-Efficacy Scale (GSES), Generalized Anxiety Disorder Scale (GAD-7) and Patient Health Questionnaire (PHQ-9).
Results: Data completeness was 89%. Internal consistency, measured by Cronbach’s α, was good for most subscales, with values mostly above 0.75, except for the ‘Process” subscale (Cronbach’s α = 0.55). The mean TEX-Q score showed moderate to strong correlations with CEQ and the B-IPQ item (r = 0.29– 0.55). Correlations with discriminant measures like LOT-R, GSES, GAD-7 and PHQ-9 were low (r = 0.22, 0.23, -0.17, -0.14 respectively). CFA revealed an acceptable six-factor model. Factor loadings were high (minimum of 0.76). The test-retest reliability was moderate for the mean TEX-Q score (ICC = 0.72).
Conclusion: The Dutch version of the TEX-Q demonstrates acceptable validity and reliability, making it suitable for research and clinical practice in gynaecology. Further validation across diverse clinical populations is recommended.
Keywords: surveys and questionnaires, motivation, psychometrics, nocebo effect, placebo effect
Introduction
Patients’ treatment expectations are an important predictor of health outcomes in various medical and psychological treatments.1–3 These expectations are related to both treatment outcome and treatment duration, where positive treatment expectations lead to shorter treatment duration4 and better outcomes in many conditions and treatments including pain,5,6 surgery7 and psychological treatments.3,8 Expectations can induce psychological and physiological changes in patients, such as pain perception, and are also considered to be a core mechanism of action of placebo and nocebo effects.9 The placebo effect is an improvement in symptoms that a person may experience from an inert treatment that cannot be attributed to the treatment itself. The nocebo effect is the opposite; the nocebo effect occurs when a patient experiences negative effects due to the expectation of harm or negative side effects.10 Relevantly, placebo and nocebo effects are not limited to inert placebo treatments, but are a core component of any treatment including active medical interventions.11 A comprehensive understanding and precise measurement of patient expectations in healthcare are central to enhancing patient satisfaction, treatment effects and delivering patient-centered care.12
Several instruments have been developed to assess treatment expectations, including disease-specific, non-validated tools as well as brief or single-item measures. Other established questionnaires, such as the Credibility/Expectancy Questionnaire (CEQ), Generic rating scale for previous treatment experiences, treatment expectations, and treatment effects (GEEE) and the Expectation for Treatment Scale (ETS), are generic, however not multidimensional.13–15 Moreover, they do not distinguish between positive and negative treatment expectations, which can be understood as independent constructs.16 In contrast, the Treatment Expectation Questionnaire (TEX-Q) is a theory-based, validated, and multidimensional instrument designed for use across different treatments and conditions in both research and clinical settings. It captures expectations across six factors: treatment benefit, positive impact, adverse consequences, negative impact, treatment process, and behavioral control.17 The original German TEX-Q has previously been translated and adapted in English and Turkish. The psychometric properties of the original and translated versions have been thoroughly evaluated, demonstrating good reliability and validity.18,19
Currently, the TEX-Q is not yet available in Dutch and cannot be applied to the Dutch population. Therefore, the aim of this study was to translate the TEX-Q into Dutch and to evaluate its psychometric properties within a sample of Dutch women presenting gynaecological complaints. We hypothesized that the Dutch version of the TEX-Q will have sound psychometric properties.
Methods
Ethics
The study protocol was reviewed by the Medical Ethics Committee of Máxima Medical Center in Veldhoven, the Netherlands (File number: N23.031). They declared that the Dutch Medical Research Involving Human Subjects Act (WMO) did not apply to this study and that official approval of this study was therefore not required. This study was conducted in accordance with the Declaration of Helsinki. All participants provided their online or written consent before filling in the questionnaires.
Translation
We obtained permission to translate and adapt the TEX-Q from the designers of the original questionnaire.17 The translation and adaptation of the TEX-Q was conducted in accordance with the guidelines for the process of cross-cultural adaptation of self-report measures.20 The following steps were taken: 1) forward translation, 2) backward translation, 3) consolidation of translation and adaptation.
Forward Translation
Two translators independently conducted the forward translation of the original German TEX-Q into Dutch. The native language of both translators was Dutch and they both spoke German very well. One of the translators was familiar with the concept and was affiliated with the gynaecology department (T1). The other translator was not familiar with the concept and had no medical background (T2). The translators each produced a written report of their translation. Both translators collaboratively produced the final forward translation in the presence of two researchers (AK, SH).
Backward Translation
Two translators, native in German and blinded to the original version, independently carried out the backward translation of the Dutch questionnaire into German. Neither translator (T3, T4) was familiar with the concept or had a medical background. The original questionnaire and the back-translations were compared and discrepancies were resolved in the presence of AK and SH.
Consolidation of Translations and Adaption
T1, T3, members of the research team (AK, SH, BT), a methodologist, a language professional and original developer of the questionnaire (MSM) formed an expert committee. They reviewed and consolidated all versions of the questionnaire into a preliminary final version, solving semantic, idiomatic and conceptual issues, and after further simplifying and clarifying items. Particular attention was paid to standardizing response categories and clarifying ambiguous words, which were further assessed for appropriateness in a pilot study. A process report of the meeting was written.
Pilot Study
We conducted a pilot study with 30 participants to test the questionnaire’s pre-final version. We recruited patients who were about to start gynaecological treatment at the outpatient clinic at Máxima Medical Center, Veldhoven and patients who were about to start outpatient psychological treatment at Pro Persona Connect in Arnhem, a large mental health institution. Participants were asked to complete the paper questionnaire at baseline and by telephone after a minimum of one week. During the second time, the questionnaire was completed using the “Think-aloud Method” and the researcher interviewed the participant using a semi-structured interview guidance.21 The researcher asked questions regarding the single items (for example “What were you thinking about when you were answering that question?”, “Why did you find this question difficult to answer?”) and the overall comprehensibility of the scale (for example “Can you give me a final conclusion on the comprehensibility of the questionnaire?”). Participants were probed about their initial reactions, their understanding of the content and whether there was any alternative wording they would find easier to understand. Alternative wording was particularly asked for three items: 1, 8, and 12. The pilot sample consisted half of patients who were going to start gynecological treatment and half of patients who were going to start psychological treatment. Seventy-seven percent were women, the mean age was 42 years and most had tertiary education (33%). Participants found the questionnaire understandable, but sometimes felt that things seemed to be asked twice. It was also noted that for items 4, 5, 6, sometimes no effect was expected, but then participants were not sure whether they should fill in “0” or “5” for that question. It was decided to include “no change expected” as an extra response option. Minor changes were made in wording. Otherwise, no problems with translation occurred for any of the items. The revisions of the questionnaire were made twice after a block of 10–15 interviews. The final revisions were discussed by two researchers (AK and SH). The research team approved the final version of the questionnaire.
Sample
The study sample included outpatients, aged ≥18 years, who were planning to undergo a new treatment at the Department of Gynaecology, Máxima Medical Center, Veldhoven, the Netherlands. They were recruited between 11th April 2023 and 25th October 2023. Exclusion criteria were insufficient Dutch language skills, severe psychiatric illness such as psychotic episodes or suicidality, and planned oncological treatment. Participants were randomly selected from the study sample to complete the TEX-Q for a second time, provided they had not started their treatment. A minimum interval of one week was maintained between the invitation to complete the questionnaire and their previous participation. The sample did not participate in the pilot study. All participants received a web-based survey of the Dutch version of TEX-Q administered through ResearchManager Electronic Data Capture software without using forced entry format.
The sample was divided into four treatment categories for analysis: patients receiving pharmacological treatment (such as oral medication, intrauterine device or cream), hysteroscopic surgery (such as hysteroscopic myomectomy, polyp resection or endometrial ablation), laparoscopic surgery (such as ovariectomy or hysterectomy), and other surgery (such as placing Tension-free Vaginal Tape, scar correction or colporrhaphy).
The sample size calculation for validation of the Dutch TEX-Q was based on a subject-to-item ratio of 10–1, the minimum number of 3 items per factor, and sample size recommendations for test construction.22 Based on these data, we aimed a sample size of 150 participants for the factor analysis. The same dataset was used for reliability analysis. For test-retest reliability analysis, 20–30 participants were deemed sufficient.
Measures
The final Dutch TEX-Q included seventeen items with an 11-point Likert-scale ranging from zero (no change, no risk, no relief, etc.) to ten (maximum change, extreme risk, maximum relief, etc.) and was divided into six subscales. (Additional Figure S1) Items 7–11 were inverted for the calculation of the mean score, allowing a higher score to represent more positive expectations. Items 4 to 6 allowed the option of indicating “no expected change”, which was translated to a score of zero in the analysis. Items 16 and 17 did not contribute to the mean score and were incorporated due to scientific interest upon request of the original creators of the questionnaire.
To assess the convergent validity, the Credibility/Expectancy Questionnaire (CEQ) and the treatment control item of the Brief Illness Perception Questionnaire (B-IPQ) were used. The CEQ effectively evaluates treatment expectations and credibility with standardized sum scores derived from four items, each rated on a nine-point numeric scale (ranging from one to nine) and two items that are rated on a numeric scale ranging from zero to hundred percent. It is composed by two subscales: treatment credibility and outcome expectation. The total score ranges from 0 to 27 with higher scores indicating more credibility or higher treatment expectations.14 From the B-IPQ, the item: “How much do you think your treatment can help with your illness?” was used and this score ranges from zero (“not at all”) to ten (“extremely helpful”).23
Discriminant validity was assessed by correlating the TEX-Q with four different scales measuring generalized expectations and an unrelated construct: psychopathology. The Life Orientation Test (LOT-R) measures optimism and pessimism with ten items. Each item is rated on a scale ranging from zero (“not agree at all”) to four (“fully agree”). The scores of the optimism and pessimism sub-scales are the sum of the scores of the corresponding items with higher scores indicating more optimism or pessimism.24,25 The General Self-Efficacy Scale (GSES) evaluates generalized self-efficacy with ten items; each rated on a scale from zero (“do not agree”) to four (“fully agree”). The total score ranges from ten to forty with a higher score indicating more self-efficacy.26 The Generalized Anxiety Disorder Scale (GAD-7) measures severity of anxiety over the past two weeks. This measure consists of seven items; each rated on a scale ranging from zero (“not at all”) to three (“nearly every day”). The total score ranges from 0 to 21 with a higher score indicating more severe anxiety.27 The Patient Health Questionnaire (PHQ-9) measures severity of depressive symptoms over the past two weeks. This measure consists of nine items; each rated on a scale ranging from zero (“not at all”) to three (“nearly every day”). The total score ranges from 0 to 27 with a higher score indicating more severe depressive symptoms.28
Statistical Analysis
Descriptive statistics were used to analyze baseline characteristics and questionnaire scores, using means with 95% confidence intervals or medians with interquartile ranges, depending on the distribution of the data. A comparative analysis of questionnaire scores across the four treatment groups was performed to detect variations and patterns. Data completeness was assessed by evaluating the response rates and analyzing the percentage of patients who completed the questionnaire.
The internal consistency of the questionnaire was evaluated using Cronbach’s α, where values greater than 0.70 were considered indicative of good internal consistency.29 Additionally, the contribution of each item to the overall scale was assessed by calculating the corrected item-total correlations, where values greater than 0.30 were considered satisfactory.30
Construct validity was assessed by evaluating both convergent and discriminant validity through bivariate correlations. Based on the German validation study and theoretical assumptions, we expected moderate (Pearson correlation coefficient (r) = 0.3–0.5) to high correlations (r > 0.5) with specific expectation scales (CEQ, B-IPQ) for convergent validity. And for discriminant validity, moderate to small correlations (r = 0.0–0.3) were expected with common generalized expectancy scales (LOT-R, GSE) and measures of psychopathology (GAD-7, PHQ-9).18
Test-retest reliability was assessed using intra class correlation (ICC) with a two-way mixed effects, single measures, absolute agreement model. Estimated values less than 0.5 are indicative of poor reliability, values between 0.5 and 0.75 moderate, values between 0.75 and 0.9 good, and values greater than 0.90 excellent reliability.31
A confirmatory factor analysis (CFA) was conducted with the subscales as found in the German and English versions of the questionnaire. The TEX-Q is based on a strong theoretical model and high factor loadings (>0.7) were found in the German factor structure. We expected to find these in the Dutch translation as well. The model was tested using the Comparative Fit Index (CFI), Tucker-Lewis Index (TLI) and the Root Mean Square Error of Approximation (RMSEA). Commonly accepted values for fit indices in CFA include a CFI and TLI value near 0.95 or greater, and a RMSEA value near 0.06 or less.32
The analyses were conducted using SPSS version 22, while factor analysis was executed with STATA version 17. P-values <0.05 were considered statistically significant.
Results
Of 264 patients who were approached, 179 (67.8%) participated in the study. After excluding data of 16 patients who did not complete the questionnaires, the final sample consisted of 163 patients. (Figure 1)
 |
Figure 1 Flow chart of the study. |
Baseline Characteristics
Baseline characteristics are shown in Table 1. The age of participants in the “other surgery” group was significantly older compared to the other treatment groups. No statistically significant difference was observed in education level among the four treatment groups. There was a significant difference of the mean TEX-Q score between the “other surgery” group and medical treatment- and laparoscopic surgery group, with the highest mean score of 7.1 measured in the “other surgery” group (p = 0.046). The CEQ expectancy subscale was the highest in the “other surgery” group. This was a significant difference compared to all the other groups (p = 0.046). The medical treatment group had a significantly lower score of the B-IPQ treatment control subscale compared to the other groups (p < 0.01). The mean scores for LOT-R, GSES, GAD-7 and PHQ-9 were not significantly different among the groups.
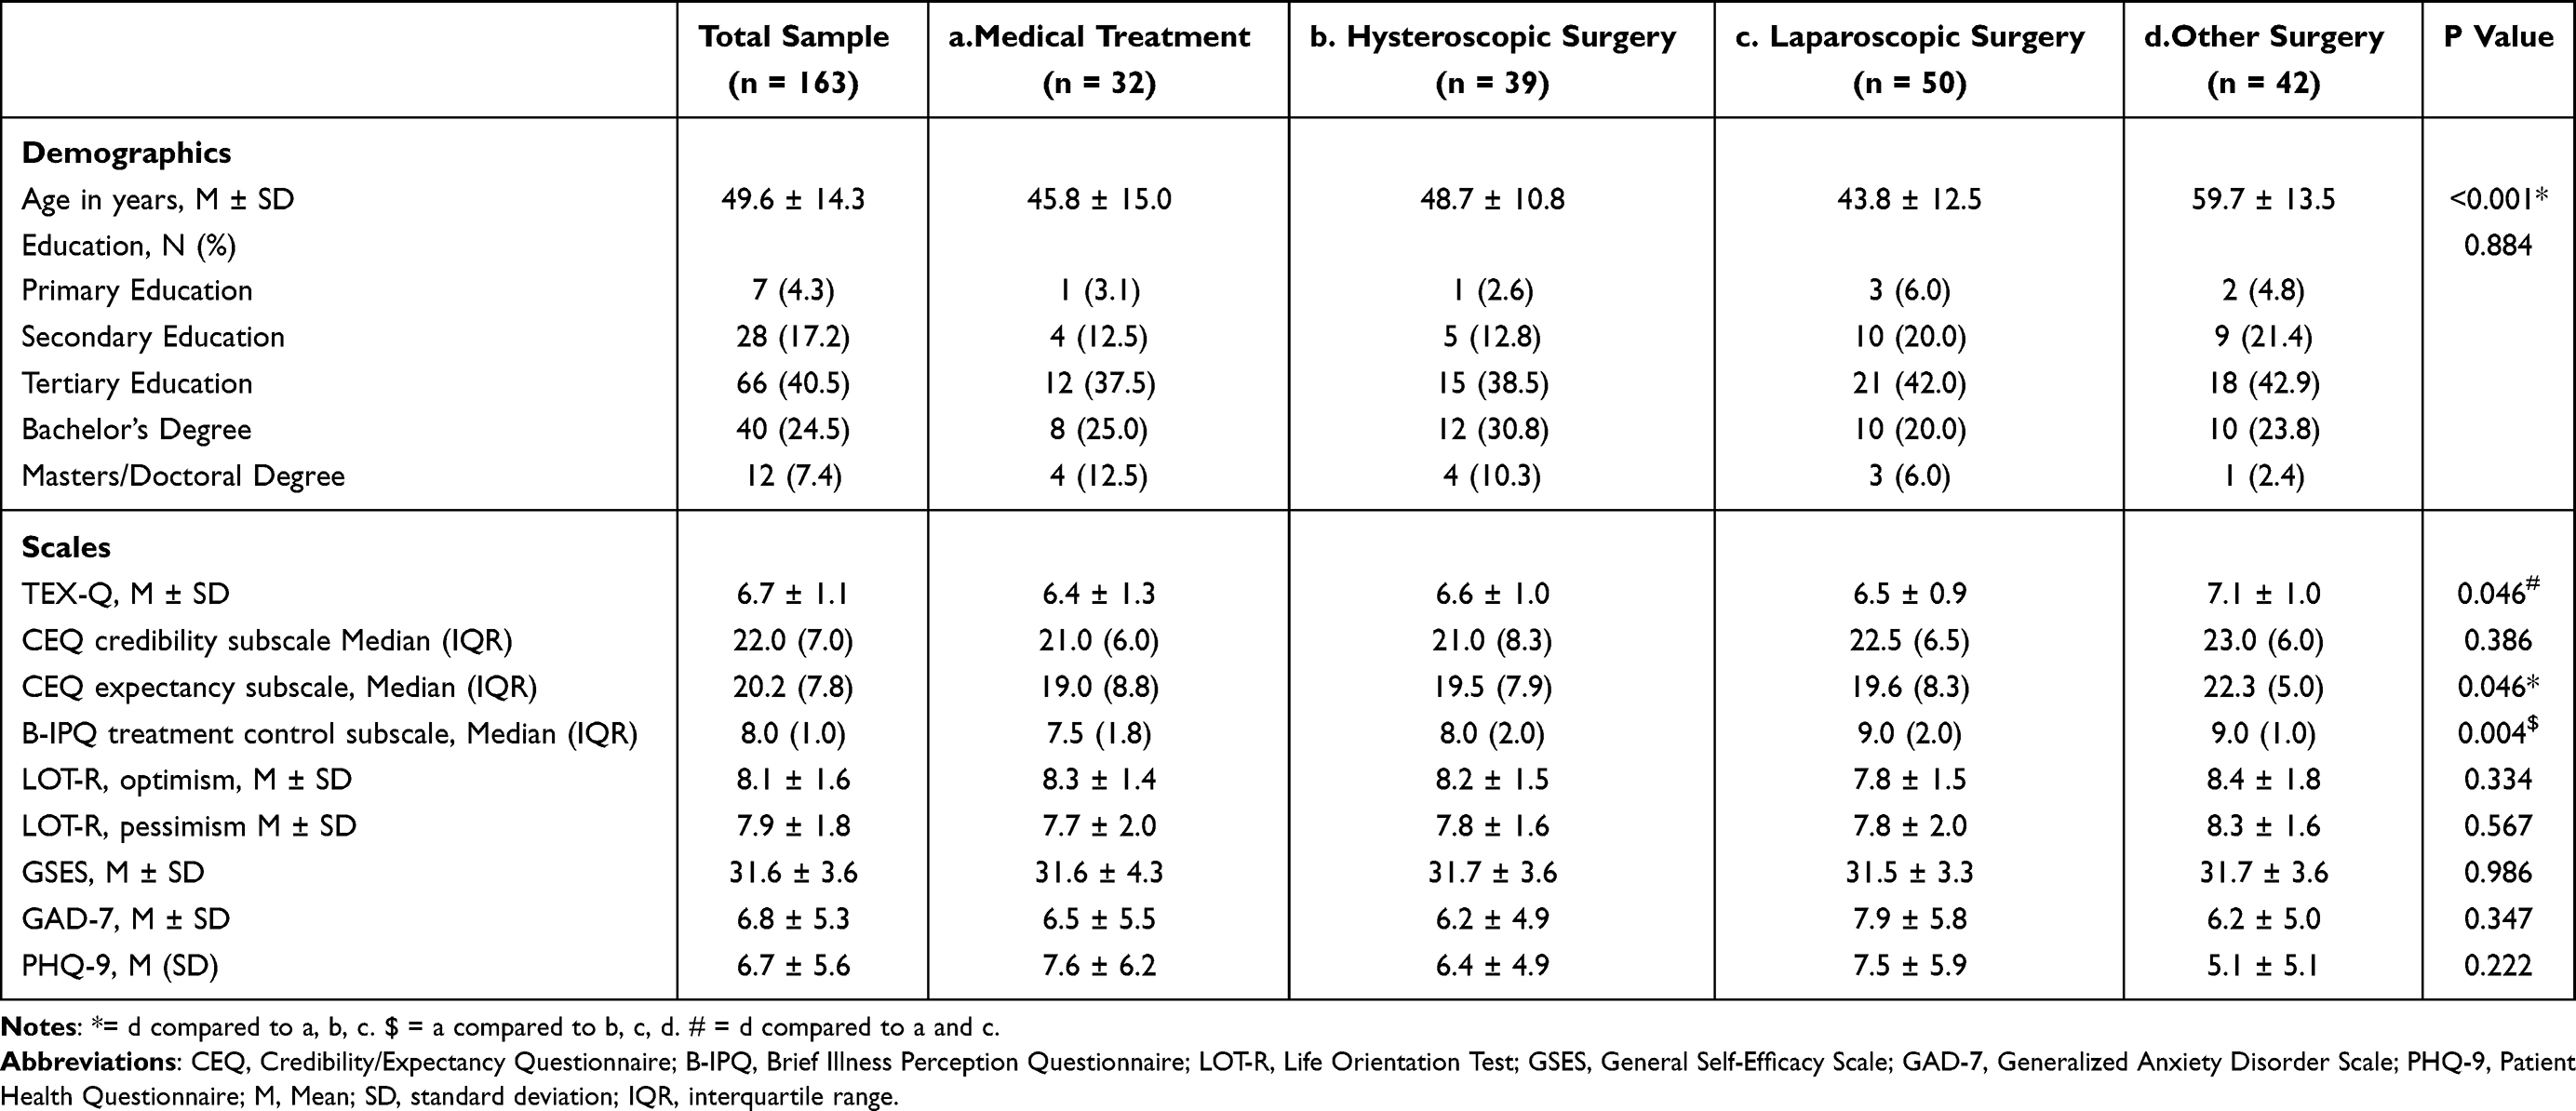 |
Table 1 Characteristics of the Validation Samples |
Of the 163 participants, 145 (89%) completed the entire TEX-Q without any missing data. The lowest mean TEX-Q score observed in the data was 2.7, while the highest score was 9.1. The mean TEX-Q score was normally distributed. The distribution was skewed for the subscales treatment benefit and negative impact. “No change expected” was answered 36 times for item 4, 24 times for item 5 and 66 times for item 5.
Internal Consistency
Table 2 presents item characteristics of the Dutch TEX-Q. Cronbach’s α coefficients of the subscales show good internal consistency. These were almost all above 0.75, except for the subscale “Process” (Cronbach’s α: 0.55). Corrected item-total correlations were all satisfactory, ie, above 0.30 (ranging from 0.41 to 0.83).
 |
Table 2 Item Characteristics of Dutch Treatment Expectation Questionnaire (TEX-Q) in the Validation Sample (n = 163) |
Construct Validity
The TEX-Q mean score, treatment benefit- and positive impact subscale were moderately to strong correlated (r = 0.33–0.55, p < 0.01) with the B-IPQ treatment control subscale. (Table 3) The TEX-Q mean score and treatment benefit subscale were moderately correlated (r = 0.29–0.44, p < 0.01) with the CEQ credibility and expectancy subscales. The correlations between the TEX-Q mean score and the measures of discriminant constructs LOT-R, GSES, GAD-7 and PHQ-9 were low (r = 0.28, 0.29, 0.23, -0.17, -0.14 respectively).
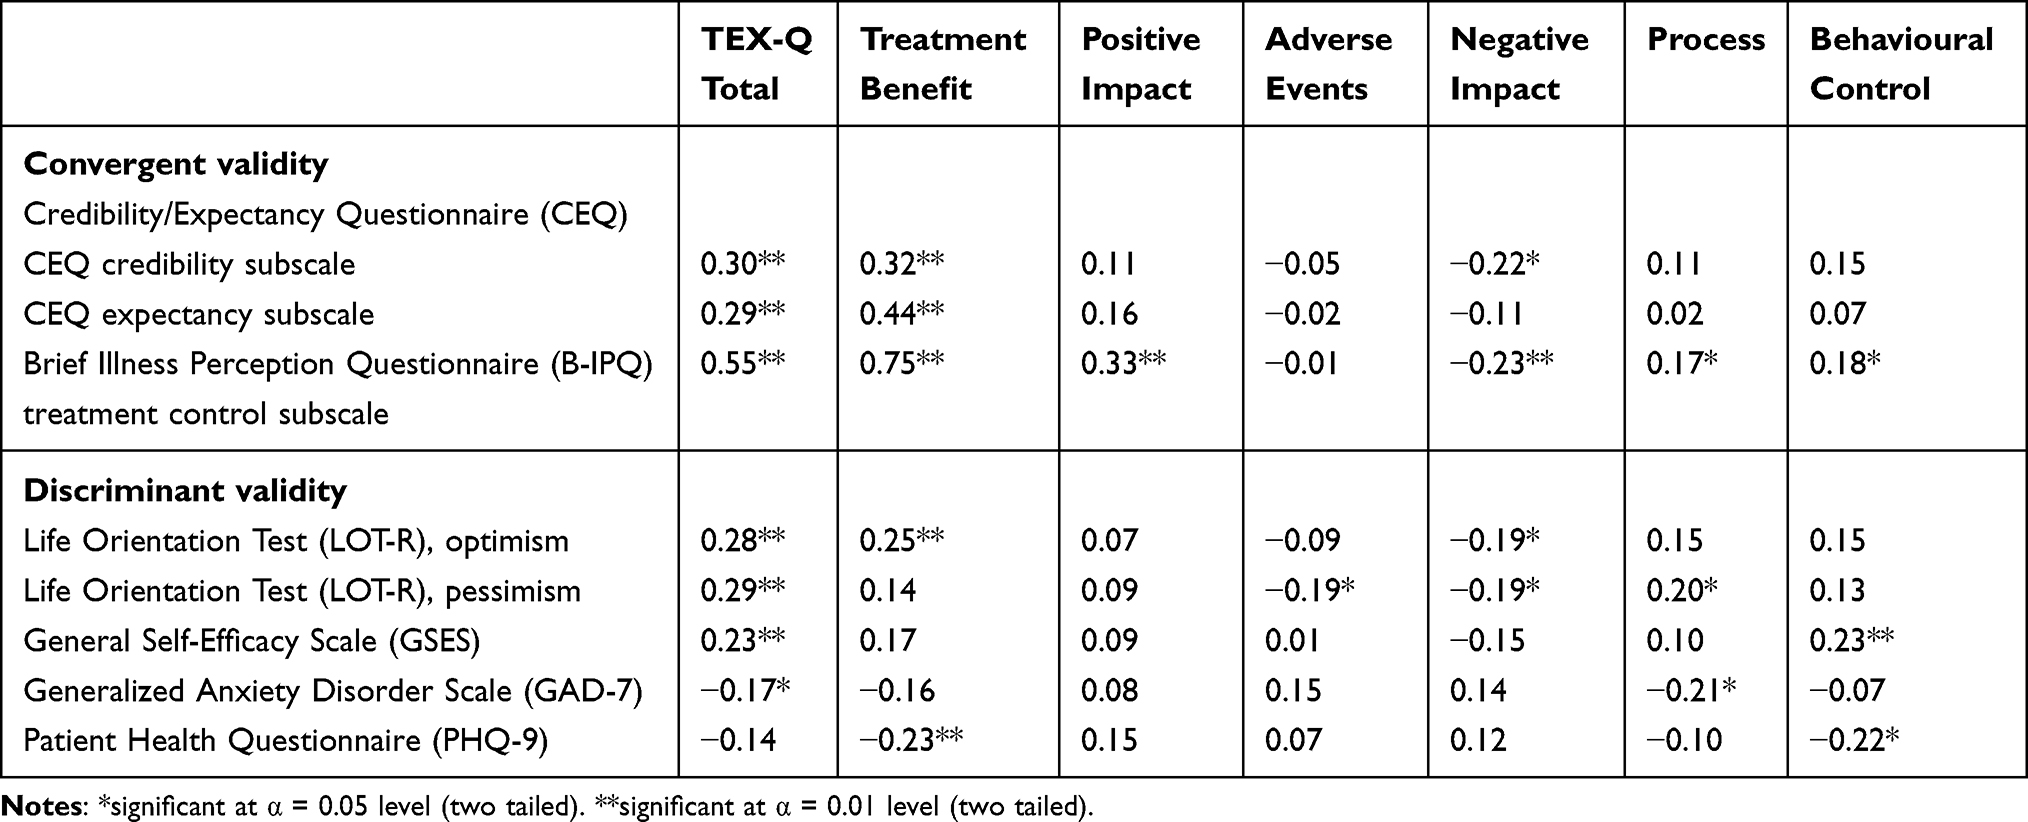 |
Table 3 Convergent and Discriminant Validity of the Dutch Treatment Expectation Questionnaire (TEX-Q): Pearson Correlation Coefficients |
Confirmatory Factor Analysis
Figure 2 presents the factor loadings. Confirmatory factor analysis was used to test the 6-factor structure. The global model fit was good (CFI = 0.890, TLI = 0.863, RMSEA = 0.094, 95% confidence interval 0.076–0.112). All factor loadings were between 0.76 and 0.96.
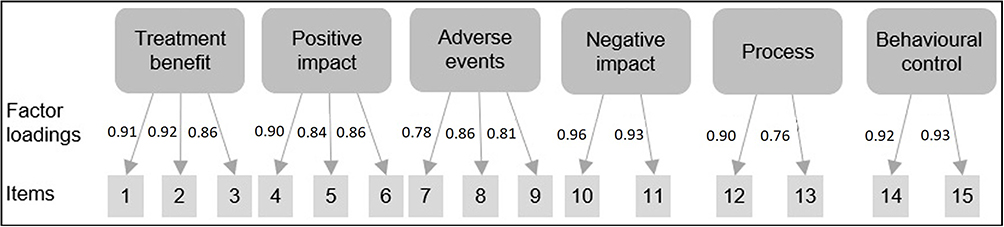 |
Figure 2 Factor loadings. |
Test-Retest Reliability
The test-retest sample consisted of 24 patients, however 5 of them were excluded because of incomplete questionnaires. We added data of the final six gynaecological patients of the pilot study so that we could analyze 25 patients in total. These patients had a mean age 52.0 years (SD 13.7). Most of them had tertiary education (44%) and most of them were planned for hysteroscopic surgery (44%). (Additional Table S1) The mean time between the first and second completion of the questionnaire was 12.5 days (range 6–21 days). The mean TEX-Q score was slightly higher during the retest (6.5 versus 6.3). However, there were no statistically significant differences in subscales and mean TEX-Q score between the first- and second assessment.
The test-retest reliability was moderate for the TEX-Q mean score (ICC: 0.72, p < 0.001) and was moderate to good for the subscales (treatment benefit (ICC: 0.72, p < 0.001), positive impact (ICC: 0.57, p = 0.001), adverse events (ICC: 0.68, p < 0.001), negative impact (ICC: 0.50, p = 0.006), process (ICC: 0.50, p = 0.005), and behavioral control (ICC: 0.83, p < 0.001)). (Additional Table S1)
Discussion
This study aimed to translate the Treatment Expectation Questionnaire (TEX-Q) into Dutch and assess its psychometric properties in a sample of women starting gynaecological treatment. The pilot study resulted in a comprehensible and conceptually appropriate Dutch version without major semantic or conceptual issues. The final version was validated in a sample with 89% data completeness, and results showed acceptable to good psychometric characteristics.
Internal consistency was acceptable for most subscales, with the exception of the process subscale, which showed a lower Cronbach’s alpha (α = 0.55) than in the original validation study (α = 0.71).18 However, in the original validation study, this subscale also seemed the most instable of the factors with low test-retest reliability and the lowest Cronbach’s α of all subscales. The lower Cronbach’s alpha may be attributed to the structure of the original questionnaire, which includes factors with a limited number of items per factor. In the Dutch translation process, most discussion revolved around item 12 with the use of the Dutch word “prettig” which translates as much as “pleasant” or “nice” which is part of the process subscale. While in the English translation “straightforward” was used and in the German version “angenehm”. Both words could be interpreted differently from “prettig”. We decided not to eliminate items and retain the subscale, because the internal consistency was low, however not unacceptable and the factor loadings were good. The original creators also discussed in their article that to date it is challenging to measure process expectations in a generic instrument used across various populations (with a great variety of different processes regarding treatments). The subscale remains relevant but might undergo some changes in the future. In the Turkish version, the internal consistency values across subscales ranged from α = 0.65 to.88, also reflecting some variation between domains.19
Furthermore, the Dutch TEX-Q demonstrated moderate to good convergent validity with other expectation measures (r = 0.29–0.55) and showed discriminant validity regarding generalized expectations and psychopathology (r ≤ 0.23). These results correspond with those of the original TEX-Q, which reported correlations ranging from r = 0.42 to 0.58 for convergent validity and below r = 0.28 for discriminant validity.18 Compared to the Turkish version, which found correlations of r = 0.45 for convergent validity and r = 0.42 for discriminant validity, the Dutch findings show a somewhat clearer distinction between convergent and discriminant validity.19
Confirmatory factor analysis reaffirmed the six-factor model from the original TEX-Q, with all items loading highly on their expected factors. This is in line with both the original study and the Turkish adaptation.18,19
Test-retest reliability in our study was moderate to good, with ICCs ranging from 0.50 to 0.83. Notably, the lowest ICC in our study was higher than the lowest reported in the original study, which ranged from 0.39 to 0.82.18 Similarly, the Turkish version demonstrated high intra-rater reliability, with ICCs ranging from 0.62 to 0.87.19
This study has contributed to the possibility to research treatment expectations in the Netherlands. There are only few validated general treatment expectancy questionnaires available in the Netherlands.14,23 This questionnaire is generic and measures patients’ expectations multidimensionally, which enables research into expectations across different populations and sectors. The modular structure allows differentiation across different aspects of the concept “expectations”.
There are some limitations to this study. First, our validation sample included only women who were about to start gynaecological treatment and therefore possibly not generalizable. However, the treatments were diverse, ranging from medical therapy to more extensive surgery. The questionnaire was designed to cover all types of conditions and treatments. Comparing the Dutch version in different study populations, such as a psychological sample could offer valuable insights. This is an ongoing study at Pro Persona to be published in the near future as well. Another limitation was the inability to compare respondents with non-respondents to examine potential nonresponse bias. Lastly, while the sample size used for test-retest reliability (n = 20–30) was deemed sufficient, future studies should aim to include larger samples to strengthen test-retest reliability.
Cut-offs for dysfunctional or unrealistic expectations still need to be studied. This will be useful for implementation of the questionnaire in clinical settings. We anticipate that this questionnaire will contribute to research on treatment expectations and placebo and nocebo effects in the Netherlands.
Conclusion
In conclusion, our findings indicate that the Dutch version of the TEX-Q is suitable for use in research and clinical gynaecological practice. The scale is well received by participants and demonstrates acceptable validity and reliability. Still further validation of the questionnaire in various clinical populations, particularly of its predictive validity, and further evaluation is required, along with potential revisions with regard to the process subscale.
Data Sharing Statement
The data underlying this article will be shared on reasonable request to the corresponding author.
Other versions of TEX-Q can be found as Additional file (Additional data file S1).
Ethics Approval and Informed Consent
All procedures performed in studies involving human participants were in accordance with the ethical standards of the institutional and/or national research committee and with the 1964 Helsinki declaration and its later amendments or comparable ethical standards. Informed consent was obtained from all individual participants included in the study. All participants provided their online or written consent before filling in the questionnaires.
Acknowledgments
We are thankful to all translators and members of the expert committee. Especially Gudule Boland for her valuable contributions in clarifying and simplifying the questionnaire. We also would like to thank Rebecca Steenaard for her assistance on the analysis.
Author Contributions
All authors made a significant contribution to the work reported, whether that is in the conception, study design, execution, acquisition of data, analysis and interpretation, or in all these areas; took part in drafting, revising or critically reviewing the article; gave final approval of the version to be published; have agreed on the journal to which the article has been submitted; and agree to be accountable for all aspects of the work.
Funding
This research received no specific grant from any funding agency in the public, commercial or not-for-profit sectors.
Disclosure
The authors report no conflicts of interest in this work.
References
1. Holtforth MG, Krieger T, Bochsler K, Mauler B. The prediction of psychotherapy success by outcome expectations in inpatient psychotherapy. Psychother Psychosom. 2011;80(5):321–322. doi:10.1159/000324171
2. Mondloch MV, Cole DC, Frank JW. Does how you do depend on how you think you’ll do? A systematic review of the evidence for a relation between patients’ recovery expectations and health outcomes. CMAJ. 2001;165(2):174–179.
3. Constantino MJ, Arnkoff DB, Glass CR, Ametrano RM, Smith JZ. Expectations. J Clin Psychol. 2011;67(2):184–192. doi:10.1002/jclp.20754
4. Greenberg RP, Constantino MJ, Bruce N. Are patient expectations still relevant for psychotherapy process and outcome? Clin Psychol Rev. 2006;26(6):657–678. doi:10.1016/j.cpr.2005.03.002
5. Eklund A, De Carvalho D, Page I, et al. Expectations influence treatment outcomes in patients with low back pain. A secondary analysis of data from a randomized clinical trial. Eur J Pain. 2019;23(7):1378–1389. doi:10.1002/ejp.1407
6. Geurts JW, Willems PC, Lockwood C, van Kleef M, Kleijnen J, Dirksen C. Patient expectations for management of chronic non-cancer pain: a systematic review. Health Expect. 2017;20(6):1201–1217. doi:10.1111/hex.12527
7. Auer CJ, Glombiewski JA, Doering BK, et al. Patients’ expectations predict surgery outcomes: a meta-analysis. Int J Behav Med. 2016;23(1):49–62. doi:10.1007/s12529-015-9500-4
8. Shedden-Mora M, Nestoriuc Y, Rief W. Lessons learned from placebo groups in antidepressant trials. Philos Trans R Soc Lond B Biol Sci. 2011;366(1572):1879–1888. doi:10.1098/rstb.2010.0394
9. Enck P, Bingel U, Schedlowski M, Rief W. The placebo response in medicine: minimize, maximize or personalize? Nat Rev Drug Discov. 2013;12(3):191–204. doi:10.1038/nrd3923
10. Tavel ME. Nocebo vs placebo effects: their clinical relevance. Am J Med. 2022;135(11):1296–1299. doi:10.1016/j.amjmed.2022.06.007
11. Petrie KJ, Rief W. Psychobiological mechanisms of placebo and nocebo effects: pathways to improve treatments and reduce side effects. Annu Rev Psychol. 2019;70:599–625. doi:10.1146/annurev-psych-010418-102907
12. El-Haddad C, Hegazi I, Hu W. Understanding patient expectations of health care: a qualitative study. J Patient Exp. 2020;7(6):1724–1731. doi:10.1177/2374373520921692
13. Rief W, Nestoriuc Y, Mueller EM, Hermann C, Schmidt K, Bingel U. Generic rating scale for previous treatment experiences, treatment expectations, and treatment effects (GEEE). PsychArchives. 2021. doi:10.23668/PSYCHARCHIVES.4717
14. Mertens VC, Moser A, Verbunt J, Smeets R, Goossens M. Content validity of the credibility and expectancy questionnaire in a pain rehabilitation setting. Pain Pract. 2017;17(7):902–913. doi:10.1111/papr.12543
15. Barth J, Kern A, Luthi S, Witt CM. Assessment of patients’ expectations: development and validation of the expectation for treatment scale (ETS). BMJ Open. 2019;9(6):e026712. doi:10.1136/bmjopen-2018-026712
16. Basedow LA, Fischer A, Benson S, et al. The influence of psychological traits and prior experience on treatment expectations. Compr Psychiatry. 2023;127:152431. doi:10.1016/j.comppsych.2023.152431
17. Alberts J, Löwe B, Glahn MA, et al. Development of the generic, multidimensional treatment expectation questionnaire (TEX-Q) through systematic literature review, expert surveys and qualitative interviews. BMJ Open. 2020;10(8):e036169. doi:10.1136/bmjopen-2019-036169
18. Shedden-Mora MC, Alberts J, Petrie KJ, et al. The Treatment Expectation Questionnaire (TEX-Q): validation of a generic multidimensional scale measuring patients’ treatment expectations. PLoS One. 2023;18(1):e0280472. doi:10.1371/journal.pone.0280472
19. Cakir F, Gercek H, Ozturk S, Kuru Colak T, Sari Z, Polat MG. The treatment expectation questionnaire tool: a cross-cultural adaptation and psychometric evaluation in Turkey. Eval Health Prof. 2025;48(3):300–307. doi:10.1177/01632787241268211
20. Beaton DE, Bombardier C, Guillemin F, Ferraz MB. Guidelines for the process of cross-cultural adaptation of self-report measures. Spine. 2000;25(24):3186–3191. doi:10.1097/00007632-200012150-00014
21. Charters E. The use of think-aloud methods in qualitative research an introduction to think-aloud methods. Brock Education Journal. 2003;12(2):1.
22. Wolf EJ, Harrington KM, Clark SL, Miller MW. Sample size requirements for structural equation models: an evaluation of power, bias, and solution propriety. Educ Psychol Meas. 2013;76(6):913–934. doi:10.1177/0013164413495237
23. de Raaij EJ, Schroder C, Maissan FJ, Pool JJ, Wittink H. Cross-cultural adaptation and measurement properties of the Brief Illness Perception Questionnaire-Dutch Language Version. Man Ther. 2012;17(4):330–335. doi:10.1016/j.math.2012.03.001
24. Klooster PMT, Weekers AM, Eggelmeijer F, et al. Optimisme en/of pessimisme: factorstructuur van de Nederlandse Life Orientation Test-Revised. Psychologie En Gezondheid. 2010;38:89–100.
25. Glaesmer H, Rief W, Martin A, et al. Psychometric properties and population-based norms of the Life Orientation Test Revised (LOT-R). Br J Health Psychol. 2012;17(2):432–445. doi:10.1111/j.2044-8287.2011.02046.x
26. Teeuw B, Schwarzer R, Jerusalem M. Dutch General Self-Efficacy Scale. 1994.
27. Donker T, van Straten A, Marks I, Cuijpers P. Quick and easy self-rating of generalized anxiety disorder: validity of the Dutch web-based GAD-7, GAD-2 and GAD-SI. Psychiatry Res. 2011;188(1):58–64. doi:10.1016/j.psychres.2011.01.016
28. Zuithoff NP, Vergouwe Y, King M, et al. The patient health questionnaire-9 for detection of major depressive disorder in primary care: consequences of current thresholds in a crosssectional study. BMC Fam Pract. 2010;11:98. doi:10.1186/1471-2296-11-98
29. Cronbach LJ. Coefficient alpha and the internal structure of tests. Psychometrika. 1951;16:297–334.
30. Ferketich S. Focus on psychometrics. Aspects of item analysis. Res Nurs Health. 1991;14(2):165–168. doi:10.1002/nur.4770140211
31. Koo TK, Li MY. A guideline of selecting and reporting intraclass correlation coefficients for reliability research. J Chiropr Med. 2016;15(2):155–163. doi:10.1016/j.jcm.2016.02.012
32. Lt H, Bentler PM. Cutoff criteria for fit indexes in covariance structure analysis: conventional criteria versus new alternatives. Structural Equation Modeling. 1999;6(1):1–55. doi:10.1080/10705519909540118
 © 2025 The Author(s). This work is published and licensed by Dove Medical Press Limited. The
full terms of this license are available at https://www.dovepress.com/terms
and incorporate the Creative Commons Attribution
- Non Commercial (unported, 4.0) License.
By accessing the work you hereby accept the Terms. Non-commercial uses of the work are permitted
without any further permission from Dove Medical Press Limited, provided the work is properly
attributed. For permission for commercial use of this work, please see paragraphs 4.2 and 5 of our Terms.
© 2025 The Author(s). This work is published and licensed by Dove Medical Press Limited. The
full terms of this license are available at https://www.dovepress.com/terms
and incorporate the Creative Commons Attribution
- Non Commercial (unported, 4.0) License.
By accessing the work you hereby accept the Terms. Non-commercial uses of the work are permitted
without any further permission from Dove Medical Press Limited, provided the work is properly
attributed. For permission for commercial use of this work, please see paragraphs 4.2 and 5 of our Terms.